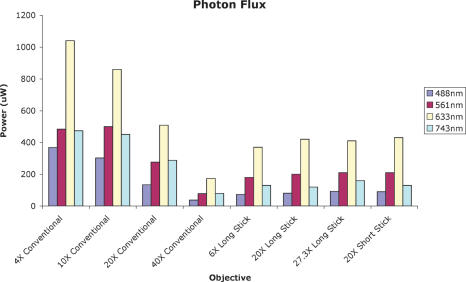
Figure 3.
A graph showing photon flux through the different objectives. The y-axis shows the photon flux measured at the tip of each objective. Despite their reduced footprint, stick objectives deliver adequate excitation light to the samples and provide high-resolution images from visible light to the near-infrared region.

