Abstract
Tumor vasculature is an attractive therapeutic target as it differs structurally from normal vasculature, and the destruction of a single vessel can lead to the death of many tumor cells. The effects of antivascular drugs are frequently short term, with regrowth beginning less than 24 hours posttreatment. This study investigated the duration of the response to the vascular targeting agent, ZD6126, of the GH3 prolactinoma, in which efficacy and dose-response have previously been demonstrated. GH3 prolactinomas were grown in the flanks of eight Wistar Furth rats. All animals were treated with 50 mg/kg ZD6126. The tumors were examined with dynamic contrast-enhanced magnetic resonance imaging (DCE-MRI) 24 hours pretreatment and posttreatment, and at a single time between 48 and 96 hours posttreatment. No evidence of recovery of perfusion was observed even at the longest (96-hour) time point. Involvement of a statistician at the project planning stage and the use of DCE-MRI, which permits noninvasive quantitation of parameters related to blood flow in intact animals, allowed this highly significant result to be obtained using only eight rats.
Keywords: ZD6126, vascular targeting, therapy, cancer, MRI
Introduction
In order to survive and grow, solid tumors need to maintain a functional vascular network. However, tumor blood vessels differ significantly from vessels in normal tissues, making tumor vasculature an important target for therapeutic intervention in cancer [1]. Vascular targeting aims to exploit these differences to selectively destroy tumor vasculature, irreversibly arresting blood flow to tumors. This induces tumor ischemia, leading to a rapid cell death by necrosis throughout central areas of the tumor normally considered resistant to conventional therapies. Characteristically, in experimental tumor models, a thin viable rim of tumor cells is seen to survive following treatment with vascular targeting agents. To explain this, it has been hypothesized that nontumor blood vessels in the surrounding tissues provide essential nutrients and oxygen, allowing tumor cells at the rim to survive the destruction of blood vessels throughout the tumor. Because the surviving rim of tumor is likely to be well perfused by surrounding vessels in normal tissues, the addition of other therapeutic modalities, such as chemotherapy and radiotherapy, may be particularly effective when combined with vascular targeting agents.
One vascular targeting approach has been to disrupt the proliferating, immature endothelial cells found selectively in tumor microvasculature compared with normal tissue microvasculature. Proliferating endothelial cells appear to rely on a microtubular cytoskeleton to maintain cell shape and, therefore, vessel function, and microtubule-destabilizing agents such as colchicines and the Vinca alkaloids have demonstrated vascular targeting activity against tumor blood vessels. However, these effects were only seen close to the maximum tolerated dose, and direct tumor cell killing through G2/mitotic arrest is likely to be the dominant mode of the antitumor action of these tubulin-binding agents.
Disruption of tumor blood vessel function by vascular targeting agents is a rapid event occurring within hours of drug treatment. Therefore, it has been proposed that the most effective vascular targeting agents will have rapidly reversible tubulin-binding kinetics, and a relatively rapid clearance in vivo, potentially minimizing direct cytotoxicity to tumor cells and normal tissues.
N-acetylcolchinol-O-phosphate (ZD6126) is a novel vascular targeting agent that in mouse allograft and xenograft models demonstrated rapid clearance in vivo (1–2 hours), with significant inhibition of both tumor blood flow and induction of massive central tumor necrosis (at ZD6126 doses of one thirtieth and one eighth of the maximum tolerated dose, respectively) [2,3]. It has also been shown to have significant antitumor activity in a mouse lung cancer metastasis model [4]. In addition, ZD6126 was also shown to induce rapid and reversible microtubule destabilization and cell shape change in endothelial cells in vitro. These studies have shown that the activity profile of ZD6126 is consistent with a vascular targeting, rather than a cytotoxic, mechanism.
A single dose of ZD6126 consistently induced massive central necrosis in a range of histologically diverse xenograft/allograft tumor models, although this did not always translate to tumor shrinkage, presumably due to regrowth from the remaining rim of viable tumor cells. Measuring necrosis histologically is a useful objective measure of drug response in preclinical models, but it has two significant drawbacks. As a preclinical tool, it is inefficient as the animal in which the tumor is grown must be sacrificed to perform the measurement, requiring many more animals than techniques where serial studies on a single animal are possible. Moreover, measuring necrosis is unlikely to provide a useful clinical measure of tumor response due to the heterogeneity of tumors and the sampling errors inherent in biopsy assessment. A noninvasive functional imaging technique that provides a quantitative endpoint is clinically translatable and permits serial studies, allowing reduction of animal usage. Magnetic resonance imaging (MRI) has been used to investigate the effects of ZD6126, both in animal models and in Phase I clinical trials. The majority of these studies have used dynamic contrast-enhanced magnetic resonance imaging (DCE-MRI). This can be analyzed with one of a number of compartmental models, giving a value for the transfer constant of a contrast agent from blood plasma to the extravascular extracellular space, or more simply by measuring the integrated area under the [gadolinium]-time curve (IAUGC). A high value of IAUGC may reflect high blood flow, high vascular volume, high interstitial fraction, and/or high endothelial permeability. The dramatic reductions in tumor perfusion that are observed after treatment with antivascular agents are therefore reflected in substantial reductions in the DCE-MRI parameters. Robinson et al. [5] performed a dose-response study using DCE-MRI in GH3 prolactinomas in rats, and showed highly significant changes in the fraction of the tumor that enhanced strongly 24 hours posttreatment with 25 or 50 mg/kg ZD6126, but no significant response at 12.5 mg/kg ZD6126; this study also demonstrated significant changes in the relaxation time T2* measured by multigradient echo MRI in GH3 prolactinomas and dosedependent increases in the necrotic fraction measured by histology. Evelhoch et al. [6] used DCE-MRI to evaluate the effects of ZD6126 in C38 colon adenocarcinomas in mice and, subsequently, in metastatic liver disease in patients receiving ZD6126 as part of a Phase I clinical trial [7]. In the human studies, IAUGC was reduced in five of six patients at 6 hours after treatment and in two of six patients at 18 to 21 days posttreatment. The murine studies revealed highly significant changes in IAUGC at doses of 100 or 200 mg/kg ZD6126, but no significant change at 50 mg/kg. Goertz et al. [8] used high-frequency (25–38 MHz) Doppler ultrasound to examine changes in blood flow in MeWo melanomas grown subcutaneously in nude mice pretreatment and posttreatment with 20 mg/kg ZD6126. Substantial drops in perfusion were observed at 4 hours posttreatment, with recovery by 24 hours. Histological perfused vessel counts based on Hoechst 33342 were consistent with the ultrasound data.
These previous functional imaging studies have assessed the dose response of experimental tumors 24 hours posttreatment as observed by DCE-MRI, and demonstrated a significant correlation between tumor necrosis and DCEMRI. Similar correlations between histologically measured necrosis and DCE-MRI parameters have also been demonstrated in human pediatric osteosarcoma after treatment with ifosfamide and carboplatin [9], and Ewing and osteogenic sarcomas after treatment with cyclophosphamide, doxorubicin, and vincristine, and methotrexate, cisplatin, and doxorubicin, respectively [10].
Regrowth of viable tumor after ZD6126 treatment has, to date, been assessed only by histological studies of treated tumors, which have shown that regrowth can occur within a few days of treatment [2,3]. The objective of the present study, therefore, was to explore the time course of recovery of perfusion, as evidenced by IAUGC analysis, following the expected [5] acute drop in perfusion at 24 hours posttreatment. The experimental design was selected in order to explore the broadest recovery time window (48–96 hours postdose) with the minimum number of animals. Each animal was used as its own control and imaged at baseline (24 hours before dosing), 24 hours after dosing, and n hours postdosing (where n = 48, 60, 72, or 96). It was considered undesirable to expose any animal to more than three bouts of anesthesia during the study. The design included two animals in each of four time points in order to provide more informative data rather than using a single n time point and allowing the half-time of a linear recovery in highly enhancing fraction (HEF) to be estimated.
Methods
All experiments were performed in accordance with the UK Home Office Animals Scientific Procedures Act 1986. GH3 prolactinomas were grown subcutaneously in the flanks of eight Wistar Furth rats [11]. Tumor volume was measured using calipers, assuming an ellipsoidal shape. The mean tumor volume at the first MRI scan was 1.71 ± 0.2 cm3 (mean ± standard error of the mean, range 0.95–2.47 cm3). Anesthesia was induced with 4 ml/kg fentanyl citrate (0.315 mg/ml) plus fluanisone (10 mg/ml) (Hypnorm; Janssen Pharmaceutica NV, Beerse, Belgium), midazolam (5 mg/ml) (Hypnovel; Roche, Basil, Switzerland), and water (1:1:2) injected intraperitoneally. This anesthetic mixture has been shown to have a minimal effect on tumor blood flow [12]. The imaging study lasted 90 minutes from administration of anesthetic.
Formulation, Administration, and Dosing of ZD6126
ZD6126 was formulated in 20% of 5% sodium carbonate and 80% phosphate-buffered saline, yielding a clear solution at ∼pH 7, and was administered intravenously as a bolus injection through a tail vein. All animals were treated with 50 mg/kg ZD6126. This dose has previously been demonstrated to be well tolerated and to have a large statistically significant effect on tumor necrosis and DCEMRI HEF in this host and tumor model [5].
DCE-MRI
Dynamic contrast-enhanced MRI (DCE-MRI) was performed three times on each rat: 24 hours pre- and post-ZD6126 treatment in each animal, and at one additional time point of 48, 60, 72, or 96 hours posttreatment (n = 2 per time point). MRI data were acquired on a Varian Unity Inova 4.7T horizontal bore system with 14 G/cm gradients of rise time of 250 microseconds and inner diameter of 154 mm. The radiofrequency coil used was a quadrature birdcage coil, which enclosed the rats from the neck to the base of the tail. For all images, the field of view was 60 mm, slice thickness was 2 mm, and resolution was 128 x 128 points, giving an in-plane resolution of 0.47 mm. One signal average was acquired per phase-encoding step for all images except for the T2-weighted images, for which two signal averages were acquired to enhance the signal-to-noise ratio. Prior to contrast agent administration, T1-weighted spin-echo images were obtained with echo time TE = 10 milliseconds and repetition times TR of 0.12, 0.5, 2, and 10 seconds to enable accurate calculation of the native tissue T1 value. Four contiguous sagittal slices covering the full volume of the tumor were selected together with one transverse slice through the abdomen to provide a normal tissue reference from paraspinal muscle. T2-weighted spin-echo images (TE = 120 milliseconds, TR = 3000 milliseconds) were also obtained from the same slices to facilitate definition of the tumor boundaries. The slice positions for the posttreatment scans were registered as closely as possible with the pretreatment scans for optimum comparison of the pretreatment and posttreatment DCE-MRI values. Multislice DCE-MRI data were then acquired using a spin-echo sequence (TR = 120 milliseconds, TE = 10 milliseconds, resulting in a time resolution of 15.4 seconds). Five image sets were acquired prior to injection of 0.1 mmol/kg gadodiamide (Omniscan; Nycomed Amersham Imaging) and 40 image sets postinjection, giving a total imaging time postinjection of 10 minutes and 15 seconds. The five preinjection image sets were averaged prior to DCE-MRI data processing to enhance the baseline signal-to-noise ratio and hence the precision of the tissue [gadodiamide] calculation, which depends on the change in signal from the baseline level. After the third MRI examination, each rat was euthanized by cervical dislocation while still anesthetized. The tumors were immediately excised, fixed in formal saline, sliced parallel to the MRI plane, and stained with hematoxylin and eosin (H&E). Tissue sections were assessed for necrosis, using a scale from grade 1 (0-10% necrosis) to grade 10 (> 90-100% necrosis) [2]. The necrosis scores represent the median value of between three and five sections for each tumor.
Tumor Growth Delay Studies
Sacrificing the group of rats undergoing MRI immediately after the last imaging session in order to confirm necrosis histologically prevented growth delay assessment. Therefore, growth delay studies were performed in a second cohort of animals in which all animals were studied for 96 hours posttreatment. Tumor volume was measured as before. Measurement was performed at 24-hour intervals from 0 to 168 hours postadministration of 50 mg/kg ZD6126 (n = 3) or saline vehicle for control (n = 3).
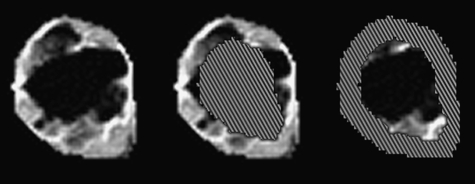
DCE-MRI data were analyzed using an IAUGC method [13,14], implemented in IDL 5.3/5.4 (Research Systems, Boulder, CO). Tumor data were calculated from all four slices, except where the tumor was too small to occupy all slices. Regions of interest (ROIs) were drawn around tumor and a reference tissue in the paraspinal muscle by a single blinded observer using manual segmentation. In order to investigate whether there was a difference in tumor response between the center and the periphery of the tumor [15,16], ROIs were automatically generated from the manually drawn tumor ROIs to segment the tumor into a core region and a rim of thickness 3 mm (Figure 1). Absolute values of IAUGC of reference tissues pretreatment and posttreatment were tested for systematic changes in response to treatment using paired two-sample t-test, and no significant effect was found (P = .66 for pretreatment versus the 24-hour time point and P = .41 for pretreatment versus the final time point in each animal). The concentration of gadodiamide was calculated in each voxel within the ROI from the change in the T1 relaxation time using a value of 3.8 mM-1 sec-1 for the relaxivity of gadodiamide. The IAUGC was calculated from the integral of the first 10 images, representing 153 seconds postcontrast administration. The IAUGC was normalized by division by the median value of the normal tissue in order to compensate for variations in the contrast agent arterial input function between animals. Voxels were defined to be highly enhancing where the normalized value was greater than 1. This choice of limit was made to define regions of tumor that did not enhance substantially, rather than to distinguish tumor from normal tissues. The choice was supported by cumulative histogram analysis of the data. The HEF is a proxy for the vascularized tumor volume [5]. The Wilcoxon signed rank statistic was used to analyze the changes in HEF at different time points.
Figure 1.
Examples of the ROIs selected for a single slice through the tumor grown in rat B 72 hours posttreatment with ZD6126. The images are of IAUGC. (A) Whole-slice ROI. Pixels outside the manually drawn ROIs have been set to black. IAUGC images of (B) an automatically generated rim ROI of thickness 3 mm and (C) the core ROI consisting of voxels at least 3 mm from the tumor surface. In (B) and (C), the core and rim ROIs, respectively, have been cross-hatched to help distinguish the limits of the ROI images. Note that posttreatment, IAUGC is very low in the bulk of the core.
Results
IAUGC Analysis
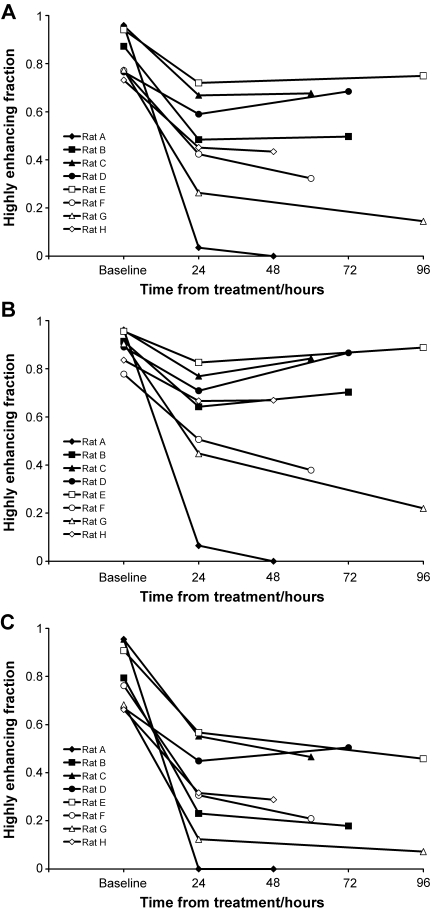
The HEF was high (between 0.73 and 0.96, mean ± standard deviation 0.85 ± 0.1) for all animals at baseline. All tumors showed a significant reduction overall in HEF 24 hours posttreatment (mean 46%, Wilcoxon signed rank statistic S = 18, P = .008, two-sided), but there was considerable interanimal variability in the response (range 23–96% reduction in HEF, mean ± standard deviation 0.45 ± 0.2). Previous studies [5] show that vehicle-treated GH3 tumors do not show a significant reduction in HEF due to spontaneous necrosis at this time point, even at a larger volume than those studied in this work. As shown in Figure 2A, there was no evidence of any trend to recovery in perfusion even at the latest time point of 96 hours (median difference 0.004, Wilcoxon signed rank statistic, S = 5, P = ns). No half-time for recovery of perfusion can be estimated from these data, as it would far exceed the time window of the experiment. The whole-tumor results are summarized in Table 1. Generally similar results are observed when the tumor data are segmented into rim (Figure 2B) and core (Figure 2C) regions, with all tumor cores and rims showing significant reduction in HEF. However, the reduction is smaller for the rims than for the cores (mean reduction 60% for cores and 35% for rims, Wilcoxon signed rank statistic S, = 18, P = .008 for both). There is no overall trend of recovery in perfusion at the final time point in either rims or cores (Wilcoxon signed rank statistic S = 5 (rims), S = 0 (cores), P = ns in each case). However, the rim values plotted in Figure 2B are consistent with a trend to earlier recovery associated with higher values of HEF at 24 hours posttreatment.
Figure 2.
(A) HEF of tumor voxels pretreatment and at two time points posttreatment with 50 mg/kg ZD6126. The HEF for each tumor is calculated from all four image slices. (B) HEF of voxels within the tumor rim (thickness 3 mm). (C) HEF of voxels within the tumor core, defined as regions at least 3 mm from the surface of the tumor.
Table 1.
HEF from IAUGC analysis, change in HEF 24 hours posttreatment, and necrosis score for tumors in individual rats (A)–(H).
| Rat | Baseline | HEF HEF 24 Hours Posttreatment | Change in HEF with Treatment (Baseline-24 Hours Posttreatment) | Time of Final HEF/Hours Posttreatment | Final HEF | Tumor Necrosis Score |
| A | 0.959 | 0.035 | 0.924 | 48 | 0.000 | 10 |
| B | 0.872 | 0.484 | 0.388 | 72 | 0.497 | 6.5 |
| C | 0.957 | 0.668 | 0.289 | 60 | 0.677 | 7 |
| D | 0.766 | 0.590 | 0.176 | 72 | 0.685 | 6 |
| E | 0.941 | 0.720 | 0.221 | 96 | 0.750 | 9 |
| F | 0.772 | 0.424 | 0.348 | 60 | 0.323 | 9.5 |
| G | 0.774 | 0.263 | 0.511 | 96 | 0.145 | 9.5 |
| H | 0.732 | 0.451 | 0.281 | 48 | 0.434 | 9 |
Tumors were excised and fixed for histology immediately after the final MRI scan. Necrosis was assessed on a scale from 1 to 10, where grade 1 represents 0% to 10% necrosis, and 10 represents 90% to 100% necrosis. Necrosis scores are the median values for three to five sections for each tumor.
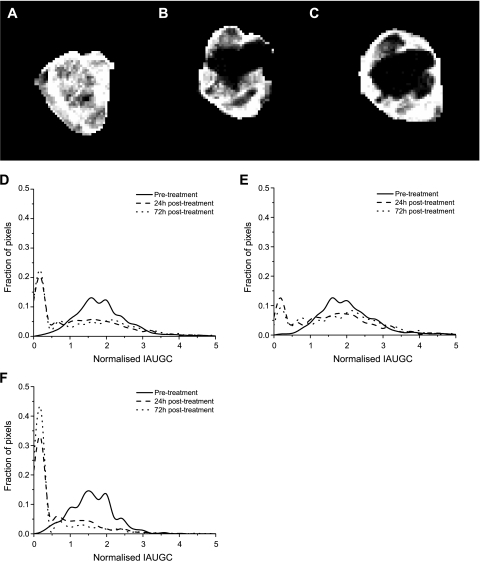
Example data are presented as IAUGC images (Figure 3, A–C) and histograms (Figure 3, D–F) for rat B, which was monitored until 72 hours posttreatment. The histograms are generated from all four tumor image slices. The HEF is equivalent to the proportion of the histogram above the point where the normalized IAUGC = 1. Image voxels outside the ROI drawn around the tumor are set to black. The pretreatment image is somewhat heterogeneous, the dark regions corresponding presumably to hypoperfused or necrotic areas where there is poor blood flow. At 24 hours posttreatment, a heterogeneous response is observed. The IAUGC is reduced close to zero over a large proportion of the tumor. Some regions are spared, with contrast enhancement of similar magnitude to that pretreatment being limited to the rim and a fraction of the core. At 72 hours, there is no sign of recovery, and the enhancing rim appears smaller. This is reflected in the IAUGC histogram distributions; overall (Figure 3D), the distribution changes dramatically with treatment. No substantial change is observed between 24 and 72 hours posttreatment, either overall or within the rim or core alone. The rim (Figure 3E) shows relatively little change on treatment; the shape of the histogram alters, with more voxels at very low IAUGC. However, the distribution is not greatly altered at normalized IAUGC values above 2. The distribution change on treatment is most dramatic in the core (Figure 3F), with the majority of the voxels being found in the spike at low IAUGC.
Figure 3.
Images of tumor IAUGC (A) pretreatment, (B) 24 hours posttreatment, and (C) 72 hours posttreatment with ZD6126. (D) Histograms of overall tumor IAUGC. Pretreatment, the distribution is approximately normal. Posttreatment, a dramatic shift to a bimodal distribution is observed. A large, narrow spike at low IAUGC corresponds to the proportion of tumor that does not enhance with contrast, or enhances very slowly. The residual enhancing vascularized portion forms a broad distribution of similar width to the pretreatment fraction. There is little change between 24 and 72 hours posttreatment. (E) Histograms of tumor rim. The change with treatment is small compared with that in the core. (F) Histograms of tumor core. Note the very high proportion of voxels in the low IAUGC spike posttreatment.
Histology
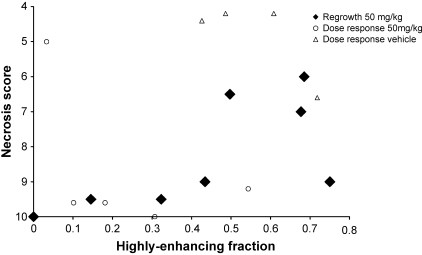
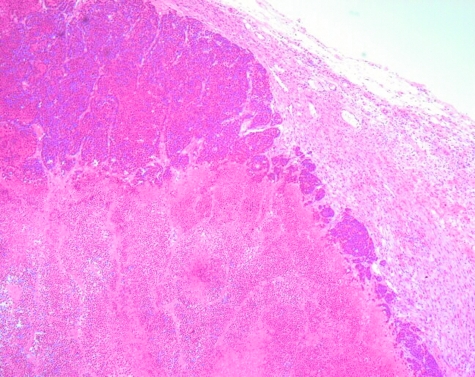
The mean tumor necrosis score on excision was 8.3 ± 0.6 (mean ± SEM). The necrosis score was not correlated with time from treatment (Kendall tau b = -0.23, P = .44), which is consistent with the absence of recovery observed by DCE-MRI. The tumor necrosis score after ZD6126 treatment, at all time points from 48 to 96 hours posttreatment, is significantly correlated with the HEF (Kendall Tau b = -0.714, P = .0133) measured in each tumor immediately prior to excision and histology. Necrosis score is plotted against HEF in Figure 4. No data were acquired from animals treated with vehicle alone in this study. Generally, the central portions of the tumor were necrotic and viable regions were restricted to the rim portions, reflecting the vascularized regions visible in the IAUGC images. An example of a tumor section stained with H&E 72 hours posttreatment is presented in Figure 5.
Figure 4.
Plot of necrosis score for each tumor versus HEF measured immediately before tumor excision. Necrosis scores range from 1 for 0% to 10% necrosis in a histological slice, to 10 for 100% necrosis. Plotted values are medians for three to five slices through each tumor. Black diamonds represent the data acquired in the present study. Necrosis is significantly correlated with HEF (Kendall tau b = -0.714, P = .0133). Open symbols represent data from a previous dose-response study [5] presented for comparison only. Tumors treated with 50 mg/kg in the dose-response study are represented by open circles and tumors treated with vehicle alone are represented by open triangles.
Figure 5.
Histological section of GH3 tumor sacrificed 72 hours posttreatment with 50 mg/kg ZD6126 and stained with H&E. Magnification, 50x. Note the viable peripheral tissue (upper center of figure) and necrotic center.
Tumor Growth Delay
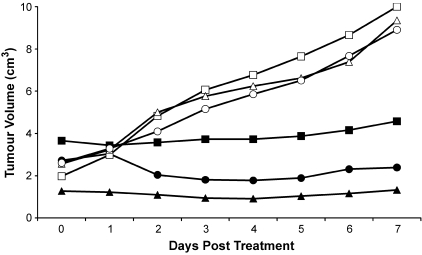
Tumor volumes for treated and control groups are presented in Figure 6. The doubling time for the control group was 3.75 ± 0.24 days. There was no change in the volume of the treated tumors between days 0 and 7 (paired t-test, t = 0.5639, P = .6296), which is consistent with the MRI findings.
Figure 6.
Tumor volume for controls and tumors treated with 50 mg/kg ZD6126. ZD6126-treated animals are represented by solid markers and vehicle-treated animals are represented by hollow markers. Note the absence of growth up to 7 days in the ZD6126-treated group.
Discussion and Conclusions
Previous preclinical studies have shown that a single dose of ZD6126 causes extensive central tumor necrosis in a range of histologically diverse experimental tumors, leaving a characteristic viable rim. The acute response observed by DCEMRI in this study is consistent with this response to ZD6126 as measured by MRI or histology [2,3,5,6]. Despite the induction of widespread central tumor necrosis, a single dose of ZD6126 does not induce prolonged tumor growth delays as regrowth from the remaining viable rim can be rapid. Hence, single doses of tubulin-binding tumor antivascular agents in isolation result in small, unsustained growth delays in many tumor models. Davis et al. [3] show unsustained growth delay in FaDu and CaNT tumors treated with a single dose of ZD6126, and Blakey et al. [2] show unsustained growth delay in Hras5, 5.7 days of growth delay in Calu-6, and 15.2, 12.8, and 9.4 days of growth delay in three independent experiments on LoVo tumors treated with ZD6126. Considerably greater growth delays result from the use of multiple doses of ZD6126, or its use in combination with certain cytotoxic therapies such as cisplatin [2] or radiotherapy [17]. At the outset of this study, our hypothesis was that recovery of perfusion as evidenced by increases in HEF after an initial reduction 24 hours after a single dose of ZD6126 would be evident by 96 hours postdosing. This hypothesis is not supported by the data, which provide no evidence at all for any recovery of perfusion. Moreover, there was good agreement between MRI-derived assessments of HEF and histological assessment of necrosis, indicating that our MRI measurements detect physiologically relevant perfusion. The 50-mg/kg necrosis scores are consistent with those in a previous study in the GH3 prolactinoma [5], where the necrosis scores were 4.3 ± 0.6 for the vehicle-treated group and 8.8 ± 1.0 for the 50 mg/kg ZD6126-treated group. Notably, the posttreatment scores are similar even though the tumors were excised for histology 24 hours posttreatment in the previous study and 48 to 96 hours posttreatment in the present regrowth study. We have not precisely quantified the growth delay in this study. However, the absence of any change in volume in the growth delay study treated group up to 7 days, combined with the histology and MRI data, suggests that the effect of ZD6126 is remarkably prolonged in this tumor model compared to other literature values. It is not yet known what determines the tumor regrowth rate posttreatment, although the doubling time of the untreated tumor is likely to be a contributing factor. It is particularly remarkable that none of the treated tumors shows regrowth, despite the wide range of response measured by changes in HEF. The acute response does resemble that of other models, with massive central necrosis but a residual viable rim after ZD6126 treatment. The strong inverse correlation between the HEF measured by DCE-MRI and necrosis score previously demonstrated in the dose-response study [5] is again evident in this study (Figure 4). However, in one case, the necrosis score is much larger than the region of reduced flow. This is reasonable, as cutting off blood flow must cause necrosis due to the removal of oxygen and nutrient supplies, but necrosis need not result only from the loss of blood supply. It is also possible that this necrosis results from regions where the blood supply was transiently interrupted by the action of ZD6126, but was restored less than 24 hours posttreatment. Prise et al. [18] investigated the effects of a single dose of combretastatin A-4 phosphate (another class of vascular targeting agent that destabilizes microtubules) on necrosis and blood flow measured by autoradiography in the rat P22 carcinosarcoma up to 96 hours posttreatment. They observed greater reductions in perfusion in the center of the tumor compared to the periphery. Substantial recovery occurs by 24 hours posttreatment and the reductions are not statistically significant after this time point. They also observe that at 96 hours posttreatment, the region of reduced flow extends beyond the region of necrosis, which is not the case at 24 hours. Galbraith et al. [16] observed significantly greater reductions in DCE-MRI in the core than in the rim of P22 carcinosarcomas 1 to 6 hours after treatment with 30 mg/kg combretastatin A-4 phosphate. They detected significant reductions in tumor Ktrans in patients receiving combretastatin A-4 phosphate doses of 52 mg/m2 or above as part of a Phase I clinical trial. In 6 of 14 patients showing reduction in tumor Ktrans, the reduction was observed to be greater in the core of the tumor than at its periphery. These results are broadly consistent with those obtained in the GH3 prolactinoma with DCE-MRI post-ZD6126 treatment. In this study, the mean HEF 24 hours posttreatment was 0.45 ± 0.2 (mean ± SD), whereas a previous dose-response study in the GH3 prolactinoma [5] found a value of 0.23 ± 0.2 at the same dose of 50 mg/kg ZD6126. It is interesting to note that the volumes of the tumors in this study (range 0.95-2.47 cm3) are smaller than those in the earlier dose-response study (range 2.54-5.38 cm3), and that the necrosis induced by tubulin-binding tumor antivascular agents including ZD6126 [19] and combretastatin [20] has been observed to increase with tumor volume.
The response of the tumors in this study has been evaluated using growth curves, DCE-MRI, and histological staining for necrosis, with consistent results. For this fastgrowing preclinical model, the tumor volume clearly shows the growth retardation resulting from drug treatment, but gives no information on the localization of the tumor necrosis, or on the degree of reperfusion taking place before this is reflected in volume increases. Volume measurements may be of limited use in a clinical setting, where the cytostatic nature of the effects of antivascular agents may not lead to a reduction in tumor volume. Histology allows localization of the tumor necrosis, but requires the sacrifice of the animal. The noninvasive MRI exam can be repeated several times in safety, and the IAUGC method used has been recommended as a method of choice for investigation of antivascular and antiangiogenic agents [21]. In this preclinical study, statistical power is greatly increased by the serial nature of the study, which permits the use of paired statistical tests. This study therefore provides a good example of the advantages of noninvasive imaging with careful experimental design, by using each animal as its own control, for extracting significant pharmacological information from small numbers of animals even in the presence of substantial interanimal variability.
In summary, we have demonstrated that a single dose of ZD6126 reduces perfusion for more than 96 hours in the GH3 prolactinoma grown in Wistar Furth rats, which is longer than the duration of reduced perfusion seen in other rodent tumor models. This result has been obtained with a method that is serially repeatable (allowing reduction in animal use) and translatable to the clinic.
Acknowledgements
The authors would like to thank Peter Hall for performing the histological analyses and Chris Brown and his staff for care of the animals.
Abbreviations
- DCE-MRI
dynamic contrast-enhanced magnetic resonance imaging
- IAUGC
integrated area under the [gadolinium]-time curve
- HEF
highly enhancing fraction
Footnotes
This work was supported by AstraZeneca Pharmaceuticals and Cancer Research UK [CRC] grant C12/A1209. S.P.R. is the recipient of a Royal Society University Research Fellowship.
References
- 1.Folkman J. Angiogenesis in cancer, vascular rheumatoid and other disease. Nat Med. 1995;1:27–31. doi: 10.1038/nm0195-27. [DOI] [PubMed] [Google Scholar]
- 2.Blakey DC, Westwood FR, Walker M, Hughes GD, Davis PD, Ashton SE, Ryan AJ. Antitumor activity of the novel vascular targeting agent ZD6126 in a panel of tumor models. Clin Cancer Res. 2002;8:1974–1983. [PubMed] [Google Scholar]
- 3.Davis PD, Dougherty GJ, Blakey DC, Galbraith SM, Tozer GM, Holder AL, Naylor MA, Nolan J, Stratford MR, Chaplin DJ, Hill SA. ZD6126: a novel vascular-targeting agent that causes selective destruction of tumor vasculature. Cancer Res. 2002;62:7247–7253. [PubMed] [Google Scholar]
- 4.Goto H, Yano S, Zhang H, Matsumori Y, Ogawa H, Blakey DC, Sone S. Activity of a new vascular targeting agent, ZD6126, in pulmonary metastases by human lung adenocarcinoma in nude mice. Cancer Res. 2002;62:3711–3715. [PubMed] [Google Scholar]
- 5.Robinson SP, McIntyre DJO, Checkley D, Tessier JJ, Howe FA, Griffiths JR, Ashton SE, Ryan AJ, Blakey DC, Waterton JC. Tumour dose response to the antivascular agent ZD6126 assessed by magnetic resonance imaging. Br J Cancer. 2003;88:1592–1597. doi: 10.1038/sj.bjc.6600926. [DOI] [PMC free article] [PubMed] [Google Scholar]
- 6.Evelhoch JL, He Z, Polin L, Corbett TH, Blakey DC, Waterton JC. Dynamic contrast - enhanced MRI evaluation of the effects of ZD6126 on tumor vasculature. Proc Int Soc Magn Reson Med. 2001;9:481. [Google Scholar]
- 7.Evelhoch JL, Lorusso P, Delproposto D, Stark K, Latif Z, Morton P, Waterton JC, Wheeler J, Barge A. Dynamic contrast - enhanced MRI evaluation of the effects of ZD6126 on tumor vasculature in a Phase I clinical trial. Proc Int Soc Magn Reson Med. 2002;10:2095. [Google Scholar]
- 8.Goertz DE, Yu JL, Kerbel RS, Burns PN, Foster FS. Highfrequency Doppler ultrasound monitors the effects of antivascular therapy on tumor blood flow. Cancer Res. 2002;62:6371–6375. [PubMed] [Google Scholar]
- 9.Reddick WE, Wang SH, Xiong XP, Glass JO, Wu SJ, Kaste SC, Pratt CB, Meyer WH, Fletcher BD. Dynamic magnetic resonance imaging of regional contrast access as an additional prognostic factor in pediatric osteosarcoma. Cancer. 2001;91:2230–2237. [PubMed] [Google Scholar]
- 10.Dyke JP, Panicek DM, Healey JH, Meyers PA, Huvos AG, Schwartz LH, Thaler HT, Tofts PS, Gorlick R, Koutcher JA, Ballon D. Osteogenic and Ewing sarcomas: estimation of necrotic fraction during induction chemotherapy with dynamic contrast-enhanced MR imaging. Radiology. 2003;228:271–278. doi: 10.1148/radiol.2281011651. [DOI] [PubMed] [Google Scholar]
- 11.Prysor-Jones RA, Jenkins JS. Effect of bromocriptine on DNA synthesis, growth and hormone secretion of spontaneous pituitary tumours in the rat. J Endocrinol. 1981;88:463–469. doi: 10.1677/joe.0.0880463. [DOI] [PubMed] [Google Scholar]
- 12.Menke H, Vaupel P. Effect of injectable or inhalational anesthetics and of neuroleptic, neuroleptanalgesic, and sedative agents on tumor blood flow. Radiat Res. 1988;114:64–76. [PubMed] [Google Scholar]
- 13.Evelhoch JL, Cunnings J, Lucas D, Pipe J, Ryan J, Morton P, Zalupski M. ISMRM Workshop Syllabus: MR of Cancer: Physiology and Metabolism. Berkeley, CA: ISMRM; 1996. pp. 61–64. [Google Scholar]
- 14.Evelhoch JL. Key factors in the acquisition of contrast kinetic data for oncology. J Magn Reson Imaging. 1999;10:254–259. doi: 10.1002/(sici)1522-2586(199909)10:3<254::aid-jmri5>3.0.co;2-9. [DOI] [PubMed] [Google Scholar]
- 15.Koutcher JA, Motwani M, Zakian KL, Li XK, Matei C, Dyke JP, Ballon D, Yoo HH, Schwartz GK. The in vivo effect of bryostatin-1 on paclitaxel-induced tumor growth, mitotic entry, and blood flow. Clin Cancer Res. 2000;6:1498–1507. [PubMed] [Google Scholar]
- 16.Galbraith SM, Maxwell RJ, Lodge MA, Tozer GM, Wilson J, Taylor NJ, Stirling JJ, Sena L, Padhani AR, Rustin GJS. Combretastatin A4 phosphate has tumor antivascular activity in rat and man as demonstrated by dynamic magnetic resonance imaging. J Clin Oncol. 2003;21:2831–2842. doi: 10.1200/JCO.2003.05.187. [DOI] [PubMed] [Google Scholar]
- 17.Siemann DW, Rojiani AM. Enhancement of radiation therapy by the novel vascular targeting agent ZD6126. Int J Radiat Oncol Biol Phys. 2002;53:164–171. doi: 10.1016/s0360-3016(02)02742-6. [DOI] [PubMed] [Google Scholar]
- 18.Prise VE, Honess DJ, Stratford MR, Wilson J, Tozer GM. The vascular response of tumor and normal tissues in the rat to the vascular targeting agent, combretastatin A-4-phosphate, at clinically relevant doses. Int J Oncol. 2002;21:717–726. [PubMed] [Google Scholar]
- 19.Siemann DW, Rojiani AM. The novel vascular-targeting agent ZD6126 shows enhanced anti-tumour efficacy in large, bulky tumours. Eur J Cancer. 2002;38(Suppl 7):40. [Google Scholar]
- 20.Landuyt W, Verdoes O, Darius DO, Drijkoningen M, Nuyts S, Theys J, Stockx L, Wynendaele W, Fowler JF, Maleux G, Van den Bogaert W, Anne J, van Oosterom A, Lambin P. Vascular targeting of solid tumours: a major “inverse” volume-response relationship following combretastatin A-4 phosphate treatment of rat rhabdomyosarcomas. Eur J Cancer. 2000;36:1833–1843. doi: 10.1016/s0959-8049(00)00173-8. [DOI] [PubMed] [Google Scholar]
- 21.Leach MO, Brindle KM, Evelhoch JL, Griffiths JR, Horseman M, Jackson A, Jayson G, Judson IR, Knopp MV, Maxwell RJ, McIntyre DJ, Padhani A, Price P, Rathbone R, Rustin G, Tofts P, Tozer GM, Vennart W, Waterton JC, Williams SR, Workman P. Assessment of anti-angiogenic and anti-vascular therapeutics using magnetic resonance imaging: recommendations for appropriate methodology for clinical trials. Proc AACR. 2003;44:504. doi: 10.1259/bjr/15917261. [DOI] [PubMed] [Google Scholar]


