

Abstract
Objective
To determine the rate of progression of white matter lesions and hemorrhages in a cohort with cerebral amyloid angiopathy (CAA).
Methods
We analyzed data from 26 patients with possible (3) or probable (23) CAA, diagnosed by the Boston Criteria. Brain maps of white matter hyperintensities, normalized to head size (nWMH), were created by blinded computer-assisted segmentation of MRI images obtained at baseline and after a median follow-up interval of 1.1 years.
Results
There was a substantial nWMH volume increase over the interscan interval (median 0.5 mL/yr, interquartile range 0.1–2.8, p<0.001). The median yearly increase, expressed as a percentage of the baseline WMH volume, was 18%. The characteristic most strongly associated with nWMH volume increase was the baseline nWMH volume (r=0.57, p=0.002). The volume of nWMH progression was also associated with history of cognitive impairment (median 5.0 mL/yr in cognitively impaired subjects vs 0.3 mL/yr in cognitively unimpaired, p=0.02) but not age or hypertension. This association remained present in an analysis stratified by baseline WMH volume. New hemorrhages, including asymptomatic microbleeds, were seen in 46% of subjects. The number of new MRI-hemorrhages correlated strongly with baseline nWMH (r=0.53, p=0.005) but not with nWMH progression (r=0.22, p=0.28).
Conclusions
There is a progressive increase in white matter lesions in subjects with cererbral amyloid angiopathy. The association of white matter lesions with incident lobar hemorrhages suggests that white matter damage may reflect a progressive microangiopathy due to cerebral amyloid angiopathy.
INTRODUCTION
White matter lesions visualized on MRI are commonly present in the elderly. They are likely caused by subacute ischemia due to arterial pathologies,1 and have been associated with hypertension,2 atherosclerosis,3, 4 CADASIL5 and cerebral amyloid angiopathy (CAA).6 Evidence is accumulating that white matter lesion volume increases over time7–10 and is linked to worsening cognitive impairment,10–12 gait impairment13 and depression.14 Identified risk factors for lesion progression include age, smoking, hypertension and increased plasma C-reactive protein (CRP) and intercellular adhesion molecule (ICAM) levels;7, 11, 15, 16 however the strongest risk factor is the baseline lesion volume.7
CAA is caused by the deposition of amyloid within the media and adventitia of small- to medium-sized cerebral arteries, which may lead to vessel fragility and rupture with resulting lobar intracerebral hemorrhage (ICH).17 There is a high prevalence of white matter lesions on CT and MRI in patients with lobar ICH and probable CAA,6 suggesting that vascular amyloid deposition may alter white matter perfusion by causing stenosis or vascular dysfunction.18 A link between CAA and white matter disease is further suggested by the observations of extensive white matter lesions in families with rare hereditary forms of CAA due to point mutations within the amyloid precursor protein.19, 20
Because CAA has been associated with white matter lesions, we sought to determine the rate of white matter lesion volume increase in sporadic CAA and its relationship to lobar hemorrhages.
METHODS
Subject recruitment and follow up
The study subjects were recruited from an ongoing single-center prospective longitudinal cohort study of CAA.21 Potentially eligible subjects were consecutive patients age ≥55 years who presented to the Massachusetts General Hospital between April 1994 and April 2002 with symptomatic lobar ICH. Those with other potential causes of hemorrhage, such as cavernous angioma or other vascular malformations, or hemorrhages in locations more typical of hypertensive ICH, such as the basal ganglia and thalamus, were excluded. From this cohort a subset of 26 consenting subjects returned for approximately annual MRI (≥9 months apart), with digitized copies, as part of a longitudinal study of CAA-related microbleeds.22 CAA was diagnosed according to the previously validated Boston Criteria;23 there were 23 subjects (88%) with probable CAA and 3 subjects with possible CAA. Pathological material was available from three subjects (two underwent surgical hematoma resection and one died and underwent autopsy), all of whom had histopathological evidence of moderate or severe CAA.
Baseline clinical and demographic information were collected blinded to genetic and radiologic information. Cognitive impairment was defined as the presence of deficits in memory or other cognitive areas sufficient to interfere with tasks of daily living, and was assessed with the aid of a standardized questionnaire that included items related to memory, praxis, calculation and reasoning.24 All subjects donated blood for APOE genotype determination.25 Patients were followed by telephone interview every six months as described.6, 21 Information collected included the appearance of new neurological symptoms, recurrent ICH, and incident cognitive impairment.
MRI Acquisition and Analysis
MR images were acquired on 1.5 Tesla Signa scanners (GE Medical Systems, Wilwaukee, WI) as previously described.26
Using MRIcro software (University of Nottingham School of Psychology, Nottingham, UK, www.mricro.com), a region-of-interest map of supratentorial white matter hyperintensities (WMH) was created by signal intensity thresholding followed by manual editing as necessary (Figure 1).26 Pairs of FLAIR sequences were preferentially used to create the WMH maps (17/26, 65%); when FLAIR sequences were unavailable pairs of T2-weighted sequences were used. There was a high correlation between the WMH volume measured in blinded readings of 10 subjects with both T2-weighted and FLAIR sequences (intra-class correlation coefficient 0.99), supporting the comparability of data obtained with these two types of sequences. In order to normalize WMH volumes for head size we used the sagittal midline cross-sectional intracranial area (ICA) as a surrogate measure of the intracranial volume, according to a previously validated method.27 The intracranial cavity was manually outlined on the most midline sagittal T1-weighted slice using MRIcro software. We have previously shown a high inter-rater reliability for ICA measurements (intra-class correlation coefficient 0.92).26
Figure 1.
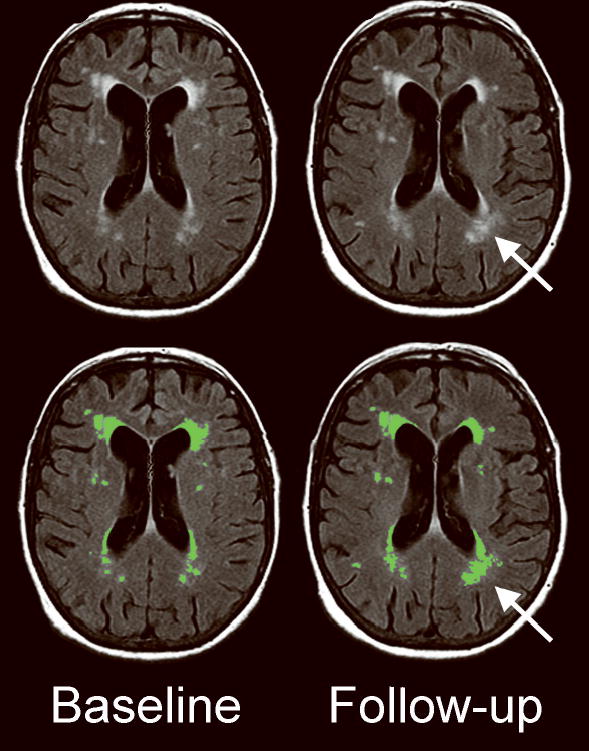
Example of WMH progression. WMH are seen on the baseline (left) and follow-up (right) MRI FLAIR sequences in a 75 year woman with a history of remote left temporal hemorrhage and multiple asymptomatic lobar microbleeds. The results of WMH segmentation (green-colored regions-of-interest) are shown in the bottom panels. During the scan interval of 9 months, WMH increased from 17.8 mL to 23.1 mL (including an increase in WMH around the left occipital horn of the lateral ventricle, arrow). WMH, white matter hyperintensity.
Manual editing of the WMH maps was performed by the consensus of two experienced readers who simultaneously viewed both the baseline and follow-up scans, in order to minimize scan-rescan and intra-observer variability. Editing was perfomed in the native space, without spatial co-registration, because of the potential for mis-registration bias due to global atrophy or hemorrhage-related focal atrophy. Areas of peri-hemorrhage gliosis were not considered WMH and the corresponding brain regions were masked on both the baseline and follow-up scans. The readers were blinded to the scan dates and the scans were presented in random order. Subjects who had baseline and follow-up GRE sequences were separately analyzed for the number of MRI-hemorrhages, including asymptomatic microbleeds, by consensus of two raters. Grading of the GRE sequences was performed without access to the FLAIR or T2 sequences, and vice versa. The readers also did not have access to the clinical and genetic data while performing MRI analysis. We have previously shown a high inter-rater reliability for determination of nWMH volume (intra-class correlation coefficient 0.98)26 and the number of MRI-hemorrhages (intra-class correlation coefficient 0.97).28
Statistical analysis
WMH volume normalized to head size (nWMH) was calculated by dividing the subject’s WMH volume by the ratio of the subject’s ICA (the average of the two ICAs measured on the baseline and follow-up scan) to the mean ICA of the study population. nWMH progression was analyzed as the annualized difference in nWMH between follow-up and baseline scans. The number of baseline and incident MRI hemorrhages were divided into categories based on previously established cut-points.22 Because the distribution of nWMH progression was right-skewed, the Wilcoxon signed-rank test was used to test for the presence of nWMH progression. Spearman’s correlations were used for comparisons of nWMH progression with continuous variables and Wilcoxon rank sum tests were used for comparisons with dichotomous variables. A stratified non-parametric test, van Elteren’s test, was used to test the association of baseline cognitive impairment with nWMH progression, stratified by baseline nWMH dichotomized at the median.
RESULTS
Baseline characteristics of the cohort are shown in Table 1. There was a readily detectable increase in nWMH volume of median 0.5 mL/year (interquartile range 0.1–2.8, p<0.001) during the median scan interval of 1.1 years. When expressed as a percentage of the baseline WMH volume, the median yearly increase was 18%.
Table 1.
Study cohort characteristics
| Characteristic | Value | |
|---|---|---|
| Age (yrs, mean ± SD) | 69.1 ± 6.5 | |
| Female gender | 13 (50%) | |
| History of cognitive impairment | 6 (23%) | |
| Hypertension | 12 (46%) | |
| Diabetes | 1 (4%) | |
| History of stroke | 2 (8%) | |
| History of coronary artery disease | 6 (23%) | |
| ≥1 APOE ɛ2 allele | 9 (35%) | |
| ≥1 APOE ɛ4 allele | 10 (38%) | |
| Scan interval (yrs) | 1.1 (1.0, 2.0) | |
| nWMH volume (mL) | Scan 1 | 4.1 (2.1, 25.1) |
| Scan 2 | 9.7 (1.7, 30.2) | |
| nWMH progression (mL/yr) | 0.5 (0.1, 2.8) | |
| MRI GRE-hemorrhages | Scan 1 | 3 (2, 9) |
| Scan 2 | 4 (2, 14) | |
| New MRI GRE-hemorrhages | 0 (0, 3) |
ICH, intracerebral hemorrhage; APOE, apolipoprotein E; nWMH, MRI white matter hyperintensity volume normalized for head size; GRE, gradient-recalled echo sequence. Continuous variables are median (interquartile range) unless otherwise noted.
Baseline nWMH was strongly associated with the amount of nWMH progression (Table 2, p=0.002). Subjects in the lowest tertile of baseline nWMH did not show evidence of nWMH progression (p=0.11) while those in each of the other tertiles did (p<0.01 for each tertile, Figure 2). The presence of cognitive impairment at baseline was the only other characteristic associated with nWMH progression. The median nWMH volume increase was greater in the six subjects with baseline cognitive impairment (median 5.0 mL/yr, interquartile range 2.6–14.1 mL/yr) than the twenty subjects with no cognitive impairment (median 0.3 mL/yr, interquartile range 0.1–2.3, p=0.02). The association of baseline cognitive impairment with nWMH progression remained significant when stratified by baseline nWMH (p=0.03). Likewise, the association of baseline nWMH with nWMH progression was significant when stratified for the presence of cognitive impairment (p=0.01). Characteristics not associated with nWMH progression were age, gender, hypertension, diabetes mellitus, ischemic stroke, smoking and APOE genotype (p>0.50 for all comparisons).
Table 2.
Correlations with nWMH progression.
| Characteristic | Spearman correlation coefficient | P value |
|---|---|---|
| Age | 0.07 | 0.72 |
| Baseline nWMH | 0.54 | 0.002 |
| Baseline MRI GRE-hemorrhages | 0.14 | 0.50 |
| Incident MRI GRE-hemorrhages | 0.22 | 0.28 |
nWMH, MRI white matter hyperintensity volume normalized for head size; GRE, gradient-recalled echo sequence.
Figure 2.

Association of nWMH volume progression with baseline nWMH tertile, by box and whisker plot (the box borders are at the 25th and 75th percentiles, the middle bar is at the median, the whiskers extend to 1.5 interquartile ranges, and other values are represented by points). Statistical testing is by Spearman correlation coefficient. nWMH, white matter hyperintensity volume normalized to subject head size.
There were 12 subjects (46%) who showed evidence of ≥1 new MRI-hemorrhages, all microbleeds, on the follow-up GRE image. The number of new MRI-hemorrhages was correlated with higher baseline nWMH (r=0.53, p=0.005, Figure 3) and a greater number of baseline MRI-hemorrhages (r=0.48, p=0.01), but not with nWMH progression (r=0.22, p=0.28).
Figure 3.
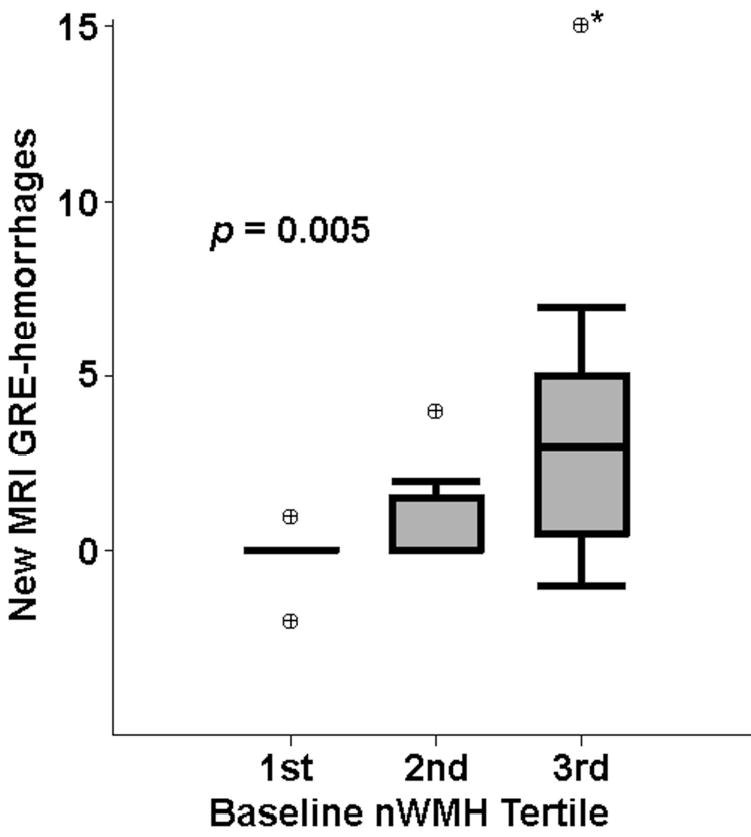
Association of baseline nWMH with new hemorrhages on MRI, by box and whisker plot (see legend to Figure 2). GRE, gradient-recalled echo MRI sequence; nWMH, white matter hyperintensity volume normalized to subject head size. *Value for number of new hemorrhages was off the scale of the graph (one subject with 78 new hemorrhages).
All of the above analyses were repeated in the subset of 23 subjects with probable CAA according to the Boston Criteria (excluding the 3 subjects with possible CAA) with no substantial changes in the results.
DISCUSSION
We found clear evidence of increasing white matter lesion volume in a cohort with advanced CAA, despite a relatively short time interval between scans. Lesion volumes were determined by raters blinded to the scan order and the inter-scan time interval, suggesting that the significant lesion volume increase was not due to observer bias. This finding offers further evidence that CAA is associated with white matter damage.6, 26, 29 We have previously hypothesized that deposition of β-amyloid in the media and adventitia of perforating arteries may lead to vascular insufficiency by producing either vessel stenosis or, perhaps more likely, impairment of vascular reactivity.18 Another possibility is that soluble β-amyloid may contribute to reduced white matter perfusion by impairing arterial vascular reactivity, as suggested by experimental models.30, 31
In our CAA cohort with mean age 69.1 years, we found that the median baseline WMH volume was 4.1 mL with a median increase of 0.5 mL/year. Previous studies suggest that larger WMH volume increase over time is correlated with larger baseline WMH volume, which is in turn correlated with increasing age. In the Austrian Stroke Prevention Study population, with mean age 60.0 years, the median baseline WMH volume was 0.3 mL3 and the median white matter lesion volume change over three years was only 0.1 mL.7 By comparison, a study of 80-year olds found that the median baseline WMH volume was 4.7 mL and the median yearly WMH volume increase was 0.6 mL/year.10 Therefore, the volume of white matter lesion increase seen in our CAA cohort was similar to that of a cohort more than ten years older, suggesting that CAA may be associated with an aggressive white matter disease. This hypothesis requires confirmation in studies including a healthy elderly comparison group.
In this cohort, nWMH progression was strongly associated with baseline nWMH volume and was not associated with age, hypertension or smoking history. Similarly, in the Austrian Stroke Prevention Study the baseline lesion volume was the strongest predictor of the change in volume.7 High baseline lesion volumes could theoretically result from either an earlier onset of white matter disease or a faster rate of progression compared to subjects with low baseline lesion volumes. Our data, showing that subjects with a higher baseline lesion volume continue to progress at a more rapid rate, support a hypothesis that the variability in white matter lesion volume is at least partly explained by differences in the rate of lesion progression.
Baseline cognitive impairment was associated with increased progression of nWMH in univariate analysis and in a stratified analysis controlling for baseline nWMH volume. The mechanism of this association is unclear. The most straightforward explanation is that cognitive impairment, previously shown to correlate with white matter lesion burden in a cross-sectional analysis,6 is a marker for the ongoing microvascular process leading to WMH progression. In the current study we were unable to demonstrate a relationship between nWMH progression and incident cognitive impairment, however, most likely because of the paucity of subjects with incident cognitive impairment. Larger studies will therefore be needed to investigate the relationship between baseline cognitive impairment, incident cognitive impairment and nWMH progression, ideally incorporating neuropsychological assessments which were not part of our study design.
The in vivo hallmark of CAA is the presence of frequent recurrent symptomatic and asymptomatic lobar hemorrhages,22 which have been proposed as a marker of worsening CAA.28 We found that the baseline nWMH volume was correlated with a greater number of new microbleeds at follow-up. The correlation of nWMH with the number of new microbleeds (Fig. 3) was nearly as strong as that with nWMH volume progression (Figure 2). This observation suggests that white matter lesions and CAA-related vascular rupture result from a similar pathological process, and is concordant with our prior finding, in a larger cohort, that baseline white matter damage predicted new symptomatic hemorrhage.6
Our study has limitations. The sample size was relatively small and subjects were recruited from a single center. Therefore there was limited power to assess the clinical consequences of nWMH volume increase. Some differences in WMH volume between baseline and follow-up scan are expected because of measurement error. We note, however, that our analysis was blinded to scan order and detected a significant WMH volume increase over time, a finding that cannot be explained on the basis of random measurement error.
These data indicate that lobar ICH due to CAA is accompanied by a high burden of white matter damage that increases over time. The lack of association with “traditional” risk factors such as hypertension, as well as the relationship between baseline white matter lesion volume and new lobar microbleeds, suggests that white matter disease in this cohort was caused by CAA. It is possible that the progression of white matter lesions may serve as a marker of CAA disease activity, in addition to incident lobar hemorrhages. Further studies will investigate the relationship between nWMH progression and incident cognitive impairment and symptomatic lobar ICH.
Acknowledgments
This work was supported by a grant from the National Institute of Neurological Disorders and Stroke (K23 NS-046327, principal investigator Dr. Eric Smith).
References
- 1.Pantoni L, Garcia JH. Pathogenesis of leukoaraiosis: a review. Stroke. 1997;28:652–659. doi: 10.1161/01.str.28.3.652. [DOI] [PubMed] [Google Scholar]
- 2.Longstreth WT, Jr, Manolio TA, Arnold A, et al. Clinical correlates of white matter findings on cranial magnetic resonance imaging of 3301 elderly people. The Cardiovascular Health Study Stroke. 1996;27:1274–1282. doi: 10.1161/01.str.27.8.1274. [DOI] [PubMed] [Google Scholar]
- 3.Manolio TA, Burke GL, O’Leary DH, et al. Relationships of cerebral MRI findings to ultrasonographic carotid atherosclerosis in older adults : the Cardiovascular Health Study. CHS Collaborative Research Group Arteriosclerosis Thrombosis & Vascular Biology. 1999;19:356–365. doi: 10.1161/01.atv.19.2.356. [DOI] [PubMed] [Google Scholar]
- 4.de Leeuw FE, de Groot JC, Bots ML, et al. Carotid atherosclerosis and cerebral white matter lesions in a population based magnetic resonance imaging study. Journal of Neurology. 2000;247:291–296. doi: 10.1007/s004150050586. [DOI] [PubMed] [Google Scholar]
- 5.Chabriat H, Levy C, Taillia H, et al. Patterns of MRI lesions in CADASIL. Neurology. 1998;51:452–457. doi: 10.1212/wnl.51.2.452. [DOI] [PubMed] [Google Scholar]
- 6.Smith EE, Gurol ME, Eng JA, et al. White matter lesions, cognition, and recurrent hemorrhage in lobar intracerebral hemorrhage. Neurology. 2004;63:1606–1612. doi: 10.1212/01.wnl.0000142966.22886.20. [DOI] [PubMed] [Google Scholar]
- 7.Schmidt R, Enzinger C, Ropele S, Schmidt H, Fazekas F. Progression of cerebral white matter lesions: 6-year results of the Austrian Stroke Prevention Study. Lancet. 2003;361:2046–2048. doi: 10.1016/s0140-6736(03)13616-1. [DOI] [PubMed] [Google Scholar]
- 8.Prins ND, van Straaten EC, van Dijk EJ, et al. Measuring progression of cerebral white matter lesions on MRI: visual rating and volumetrics. Neurology. 2004;62:1533–1539. doi: 10.1212/01.wnl.0000123264.40498.b6. [DOI] [PubMed] [Google Scholar]
- 9.Cook IA, Leuchter AF, Morgan ML, et al. Longitudinal progression of subclinical structural brain disease in normal aging. American Journal of Geriatric Psychiatry. 2004;12:190–200. [PubMed] [Google Scholar]
- 10.Garde E, Lykke Mortensen E, Rostrup E, Paulson OB. Decline in intelligence is associated with progression in white matter hyperintensity volume. J Neurol Neurosurg Psychiatry. 2005;76:1289–1291. doi: 10.1136/jnnp.2004.055905. [DOI] [PMC free article] [PubMed] [Google Scholar]
- 11.Longstreth WT, Jr, Arnold AM, Beauchamp NJ, Jr, et al. Incidence, manifestations, and predictors of worsening white matter on serial cranial magnetic resonance imaging in the elderly. the Cardiovascular Health Study Stroke. 2005;36:56–61. doi: 10.1161/01.STR.0000149625.99732.69. [DOI] [PubMed] [Google Scholar]
- 12.Schmidt R, Ropele S, Enzinger C, et al. White matter lesion progression, brain atrophy, and cognitive decline: the Austrian stroke prevention study. Ann Neurol. 2005;58:610–616. doi: 10.1002/ana.20630. [DOI] [PubMed] [Google Scholar]
- 13.Wolfson L, Wei X, Hall CB, et al. Accrual of MRI white matter abnormalities in elderly with normal and impaired mobility. J Neurol Sci. 2005;232:23–27. doi: 10.1016/j.jns.2004.12.017. [DOI] [PubMed] [Google Scholar]
- 14.Taylor WD, Steffens DC, MacFall JR, et al. White matter hyperintensity progression and late-life depression outcomes. Arch Gen Psychiatry. 2003;60:1090–1096. doi: 10.1001/archpsyc.60.11.1090. [DOI] [PubMed] [Google Scholar]
- 15.Markus HS, Hunt B, Palmer K, Enzinger C, Schmidt H, Schmidt R. Markers of endothelial and hemostatic activation and progression of cerebral white matter hyperintensities: longitudinal results of the Austrian Stroke Prevention Study. Stroke. 2005;36:1410–1414. doi: 10.1161/01.STR.0000169924.60783.d4. [DOI] [PubMed] [Google Scholar]
- 16.van Dijk EJ, Prins ND, Vermeer SE, et al. C-reactive protein and cerebral small-vessel disease: the Rotterdam Scan Study. Circulation. 2005;112:900–905. doi: 10.1161/CIRCULATIONAHA.104.506337. [DOI] [PubMed] [Google Scholar]
- 17.Vinters HV. Cerebral amyloid angiopathy. A critical review Stroke. 1987;18:311–324. doi: 10.1161/01.str.18.2.311. [DOI] [PubMed] [Google Scholar]
- 18.Greenberg SM. Cerebral amyloid angiopathy and vessel dysfunction. Cerebrovascular Diseases. 2002;13:42–47. doi: 10.1159/000049149. [DOI] [PubMed] [Google Scholar]
- 19.Haan J, Algra PR, Roos RA. Hereditary cerebral hemorrhage with amyloidosis-Dutch type. Clinical and computed tomographic analysis of 24 cases. Archives of Neurology. 1990;47:649–653. doi: 10.1001/archneur.1990.00530060059018. [DOI] [PubMed] [Google Scholar]
- 20.Grabowski TJ, Cho HS, Vonsattel JP, Rebeck GW, Greenberg SM. Novel amyloid precursor protein mutation in an Iowa family with dementia and severe cerebral amyloid angiopathy. Annals of Neurology. 2001;49:697–705. doi: 10.1002/ana.1009. [DOI] [PubMed] [Google Scholar]
- 21.O’Donnell HC, Rosand J, Knudsen KA, et al. Apolipoprotein E genotype and the risk of recurrent lobar intracerebral hemorrhage. N Engl J Med. 2000;342:240–245. doi: 10.1056/NEJM200001273420403. [DOI] [PubMed] [Google Scholar]
- 22.Greenberg SM, Eng JA, Ning M, Smith EE, Rosand J. Hemorrhage burden predicts recurrent intracerebral hemorrhage after lobar hemorrhage. Stroke. 2004;35:1415–1420. doi: 10.1161/01.STR.0000126807.69758.0e. [DOI] [PubMed] [Google Scholar]
- 23.Knudsen KA, Rosand J, Karluk D, Greenberg SM. Clinical diagnosis of cerebral amyloid angiopathy: validation of the Boston criteria. Neurology. 2001;56:537–539. doi: 10.1212/wnl.56.4.537. [DOI] [PubMed] [Google Scholar]
- 24.Jorm AF. A short form of the Informant Questionnaire on Cognitive Decline in the Elderly (IQCODE): development and cross-validation. Psychol Med. 1994;24:145–153. doi: 10.1017/s003329170002691x. [DOI] [PubMed] [Google Scholar]
- 25.Greenberg SM, Rebeck GW, Vonsattel JP, Gomez-Isla T, Hyman BT. Apolipoprotein E epsilon 4 and cerebral hemorrhage associated with amyloid angiopathy. Annals of Neurology. 1995;38:254–259. doi: 10.1002/ana.410380219. [DOI] [PubMed] [Google Scholar]
- 26.Gurol ME, Irizarry MC, Smith EE, et al. Plasma beta-amyloid and white matter lesions in AD, MCI, and cerebral amyloid angiopathy. Neurology. 2006;66:23–29. doi: 10.1212/01.wnl.0000191403.95453.6a. [DOI] [PubMed] [Google Scholar]
- 27.Ferguson KJ, Wardlaw JM, Edmond CL, Deary IJ, MacLullich AMJ. Intracranial Area: A Validated Method for Estimating Intracranial Volume. J Neuroimaging. 2005;15:76–78. doi: 10.1177/1051228404270243. [DOI] [PubMed] [Google Scholar]
- 28.Greenberg SM, O’Donnell HC, Schaefer PW, Kraft E. MRI detection of new hemorrhages: potential marker of progression in cerebral amyloid angiopathy. Neurology. 1999;53:1135–1138. doi: 10.1212/wnl.53.5.1135. [DOI] [PubMed] [Google Scholar]
- 29.Greenberg SM, Gurol ME, Rosand J, Smith EE. Amyloid angiopathy-related vascular cognitive impairment. Stroke. 2004;35:2616–2619. doi: 10.1161/01.STR.0000143224.36527.44. [DOI] [PubMed] [Google Scholar]
- 30.Niwa K, Carlson GA, Iadecola C. Exogenous A beta1-40 reproduces cerebrovascular alterations resulting from amyloid precursor protein overexpression in mice. Journal of Cerebral Blood Flow & Metabolism. 2000;20:1659–1668. doi: 10.1097/00004647-200012000-00005. [DOI] [PubMed] [Google Scholar]
- 31.Park L, Anrather J, Forster C, Kazama K, Carlson GA, Iadecola C. Abeta-induced vascular oxidative stress and attenuation of functional hyperemia in mouse somatosensory cortex. J Cereb Blood Flow Metab. 2004;24:334–342. doi: 10.1097/01.WCB.0000105800.49957.1E. [DOI] [PubMed] [Google Scholar]