Abstract
We used the standard comet assay successfully to generate in vitro dose-response curves under oxic and hypoxic conditions. We then made mixtures of cells that had been irradiated with 3 and 9 Gy of X-rays to simulate two subpopulations in a tumor, but efforts to accurately detect and quantify the subpopulations using the standard comet assay were unsuccessful. Therefore, we investigated a modified comet assay to determine whether it could be used for measuring hypoxia in our model systems. U251 MG cells were grown as subcutaneous tumors in athymic mice; U251 MG and U87 MG cells were grown as intracerebral (i.c.) tumors in athymic rats. Animals were injected with RSU 1069, irradiated, and euthanized. Tumors and normal brains were removed, and the cells were analyzed using a modified comet assay. Differences in comet tail moment distributions between tumor and contralateral normal brain, using tail moments at either the 25th or 50th percentile in each distribution, were taken as measures of the degree of tumor hypoxia. For U251 MG tumors, there was a positive relationship between tumor size and the degree of hypoxia, whereas preliminary data from U87 MG i.c. tumors showed less hypoxia and no apparent relationship between tumor size and hypoxia.
Keywords: hypoxia, comet assay, brain tumor cells, oxygen enhancement ratio, human tumor xenografts
Introduction
There is considerable evidence for the existence of hypoxic cells in many kinds of solid tumors including human brain tumors [1,2], which include extremely hypoxic cells displaying pO2 values <0.5 mm Hg and intermediately hypoxic cells with pO2 values between 0.5 and 20 mm Hg. It has been known for decades that hypoxic cells are more resistant to ionizing radiation than their well-oxygenated counterparts [3]. The radiation dose required to kill hypoxic cells divided by the radiation dose required to kill the same fraction of oxic cells defines the oxygen enhancement ratio (OER), which is typically ∼3 for extremely hypoxic cells. Cells at intermediate pO2 have intermediate radiosensitivities, with OERs between 1 and 3 [4]. In addition to being an obstacle to attempts to cure brain tumors with radiation, hypoxia can produce other unwanted effects. Recent clinical studies of patients with solid tumors elsewhere in the body show a correlation between tumor hypoxia and metastases [5] and between hypoxia and tumor progression [6]. Tumor hypoxia, however, can be exploited for selective cancer treatment, such as hypoxia-selective cytotoxins and hypoxia-inducible specific gene therapy [7].
Several methods have been developed for measuring tumor hypoxia, each of which has its advantages and disadvantages. These were reviewed by Horsman [8] and included a paired cell survival assay, polarographic electrode techniques, hypoxic markers that bind to or are metabolized by hypoxic cells, and several comet assays.
The comet assay, used in conjunction with ionizing radiation, permits the detection of hypoxia in solid tumors [9,10]. This assay measures DNA strand breaks in individual cells, and ionizing radiation produces about three times more DNA strand breaks in aerobic cells as compared to hypoxic cells. A methodology standardized by Dr. Peggy Olive and colleagues at the University of British Columbia Cancer Research Center (Vancouver, Canada) has been used by many investigators [11–14]. Irradiated cells are embedded in agarose, lysed in an alkaline solution, electrophoresed for a short time, and then stained with the fluorescent DNA dye, propidium iodide (PI). During electrophoresis, broken DNA migrates more readily into the comet “tail” than does intact DNA. The comet tail moment (TM) is calculated from the percentage of total DNA in the tail and the length of the tail, and is typically used to estimate the amount of DNA damage in individual cells. Hypoxic fraction is calculated by fitting the histogram of TMs to two normal distributions with means separated by a factor of 2 to 3 (the OER or anticipated damage differential due to oxygen). The fraction of measurements in the peak formed by the smaller TMs is defined as the hypoxic fraction. We have experienced several problems with this analysis in our brain tumor models. The assay is not sufficiently sensitive to define a small population of hypoxic cells. The TM distributions from tumor cells are not always fit well by two normal distributions and, in most tumors, the two peaks are not easy to distinguish due to the presence of cells under intermediate oxygen levels in the tumor.
A modified comet assay for measuring hypoxia also has been developed by Olive [15]. In addition to using radiation to distinguish between oxic and hypoxic cells, this method uses the bioreductive drug RSU 1069 [1(2-nitro-1-imidazolyl)-3-aziridino-2-propanol], which produces DNA crosslinks in hypoxic cells and DNA strand breaks in oxic cells. DNA crosslinking in the hypoxic cells prevents broken DNA from migrating during electrophoresis; this, coupled with the additional strand breaks produced in oxic cells, makes differences in the comets from oxic and hypoxic cells more pronounced.
Here, we report our attempts to measure tumor hypoxia in human brain tumor models using the standard comet assay and the modified comet assay. We used the normal brain as an oxic control for calculating the degree of tumor hypoxia for intracerebral (i.c.) tumors.
Materials and Methods
Cell Lines and Tumor Models
U251 MG and U87 MG human brain tumor cells were provided by the Neurological Surgery Tissue Bank at the University of California, San Francisco. These cells were originally obtained from patients with glioblastoma multiforme. Cells were grown as monolayers in Eagle's minimal essential medium with 10% calf fetal serum in a 37°C incubator. Three xenograft models were used for this study: U251 MG cells grown as subcutaneous (s.c.) tumors in the flanks of athymic mice (U251 s.c. tumor); U251 MG cells grown as i.c. tumors in athymic rats (U251 i.c. tumor), and U87 MG cells grown as i.c. tumors in athymic rats (U87 i.c. tumor). The published protocols for generating s.c. and i.c. tumors were used. Briefly, 5x10⁶ cells in 0.1 ml of medium were injected into the right flanks of athymic mice to produce U251 s.c. tumors. Intracerebral tumors were generated by injecting 10 µl of cell suspension containing 2x10⁶ U251 MG cells or 5x10⁶ U87 MG cells into the right hemispheres of athymic rat brains [17].
Induction of Hypoxia In Vitro
To achieve hypoxic conditions in vitro, cells were grown in glass Petri dishes. Prior to radiation, the dishes were placed into gas-tight aluminum gassing jigs. The jigs were subjected to five rounds of evacuation and flushing with either 95% air and 5% CO2 (oxic conditions) or 95% N2 and 5% CO2 (hypoxic conditions) on a shaking platform. After the last round of evacuation and flushing, the cells were irradiated inside the jig. This procedure routinely produces an OER of ∼3 when cell survival is the experimental endpoint.
Irradiation and Drug Administration Procedures
For the in vitro studies, log-phase U87 MG cells were detached from flasks by trypsinization, and single cell suspensions were irradiated on ice at a dose rate of 1.26 Gy/min using a Philips X-ray machine. For cells irradiated inside the gassing jigs, the single cell suspension was made immediately after irradiation.
RSU 1069 was kindly supplied by Drs. I. Stratford and M. Jaffar at the MRC Radiology Unit (Chilton, UK) and by Dr. J.S. Sebolt-Leopold at Park Davis Pharmaceutical Research (Ann Arbor, MI). The drug was dissolved in phosphate-buffered saline (PBS) immediately before use. Mice and rats received intraperitoneal (i.p.) injections of RSU 1069 at a dose of 100 mg/kg. According to the published pharmacokinetics [18], after injection, this drug peaks in flank tumor at about 1 hour and in brain at about 1.5 hours. Therefore, animals were irradiated whole body with 10 Gy at these times after i.p. injection of RSU 1069. Immediately after irradiation, animals were euthanized, the tumor and normal brain tissues were removed, and they were placed in cold PBS. Single cell suspensions were prepared by mincing the tissues in cold PBS and filtering through a 40-µm nylon mesh. For rats bearing i.c. tumors, brain tissues in the contralateral hemispheres were removed, placed in cold PBS, minced, filtered, and used as normal brain controls.
For the standard comet assay, animals received 15 Gy of whole body irradiation. Immediately after irradiation, tumors and normal brain tissues were removed, placed in cold PBS, and processed as above.
Alkaline Comet Assays
Cells were diluted in PBS to a concentration of 4x10⁴ cells/ml, and 0.5 ml of single cell suspension was mixed with 1.5 ml of 1% agarose solution and poured onto a clean microscope slide. Three slides were made for each sample. The slides were carefully submersed for 1 hour in the dark in an alkaline lysis solution containing 0.1% sarkosyl, 1M NaCl, and 0.03 M NaOH. Slides were washed in 0.03 M NaOH and 2 mM EDTA for 1 hour with two or three changes of wash solution during the hour. Electrophoresis was carried out at 0.5 V/cm for 24 minutes in wash solution, slides were neutralized in water for 20 minutes, and then they were stained for 10 minutes in 2.5 µg/ml PI.
Comets were viewed using a fluorescent microscope (Carl Zeiss, Oberkochen, Germany) and images were captured with aCCDcamera (Xillix Technologies, Vancouver, BC, Canada). Images were analyzed by a SunSPARCstation 5 (Sun Microsystems, Mt. View, CA) using Scilimage software (TNO Institute of Applied Physics, Delft, The Netherlands). Comets from three slides of each tumor sample were analyzed.
We compared results from the standard comet assay with those from the modified comet assay using the U251 s.c. tumor model. We assumed that the majority of the cells from normal brain were oxic, and that any shift in the TM distribution towards smaller TMs in the tumor sample was due to hypoxic cells. The shift in TM was determined at the 25th percentile (TM25) and the 50th percentile (TM50) levels for each distribution.
For the i.c. models, normal brain in the contralateral hemisphere (i.e., the nontumor-bearing side of the rat brain) served as a normal brain control for each animal. Differences in TM50 or TM25 between tumor and normal brain were taken as measures of the degree of tumor hypoxia.
Results
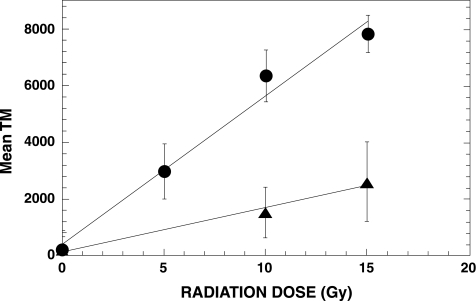
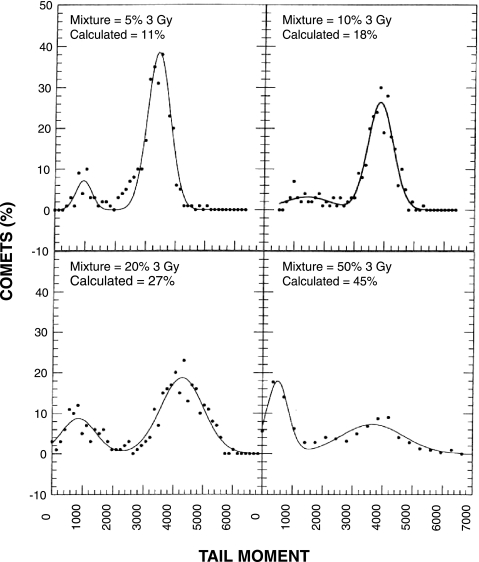
To measure the OER of irradiated U87 MG cells, cells were subjected to different doses of radiation under oxic or hypoxic conditions. Following irradiation, the standard comet assay was performed. The results shown in Figure 1 revealed a linear relationship between radiation dose and mean TM for both oxic and hypoxic cells. The ratio of the slopes of these two curves is ∼3 and provides an estimate of the OER. To test the accuracy of the comet assay in detecting a subpopulation of cells with small TMs in a mixed population of cells that also contained large TMs, we conducted an in vitro experiment using various mixtures of U87 MGcells that had been irradiated with either 3 or 9 Gy. These doses were selected because they produce a three-fold difference in DNA damage, and should simulate the threefold difference in radiation-induced DNA damage between oxic and hypoxic cells. Following irradiation, the standard comet assay was performed. All slides were coded with a designation that was unknown to the observer, and comets were scored for each mixture. TM distributions for each mixture were fit with two normal distributions, and the area under each peak was calculated. This area represents the percentage of comets in each population (Figure 2). The calculated percentages for the smaller 3-Gy peak deviated approximately two-fold from the actual percentages for the mixtures that contained 5% and 10% of 3-Gy irradiated cells. In contrast, the fold difference between the calculated and actual mixtures was much less for the mixtures that contained 20% and 50% of 3-Gy irradiated cells. We also fit these TM distributions with a Poisson distribution to the TM peak arising from the 3-Gy dose and a normal distribution to the peak arising from the 9-Gy dose (data not shown). The results were similar to those shown in Figure 2; considerable error was associated with the data obtained from the mixtures that contained small percentages of 3-Gy irradiated cells, whereas less relative error was observed for mixtures that contained larger percentages of these cells.
Figure 1.
Radiation dose response of comet tail moments in U87 MG cells irradiated under oxic conditions (circles) or hypoxic conditions (triangles). Each data point represents the mean and standard deviation obtained from about 200 comets.
Figure 2.
TM distributions of known mixtures of U87 MG cells irradiated with 3 and 9 Gy of X-rays. Comets were prepared from different mixtures of the two cell populations and 300 or more comets were analyzed from each mixture. TM distributions were fit with two normal distributions. The relative area under the small TM peak was calculated as the percentage of 3-Gy irradiated cells in the mixture.
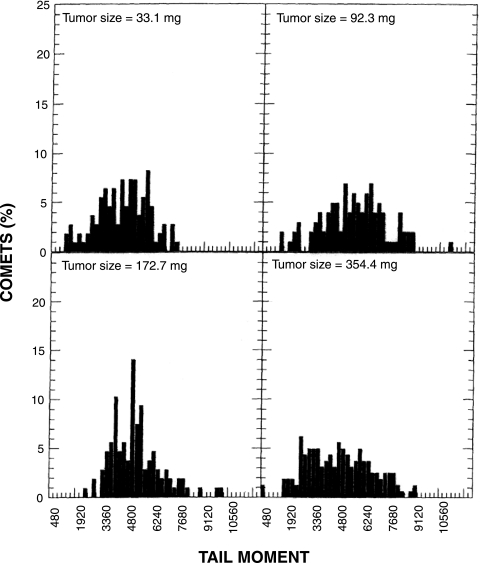
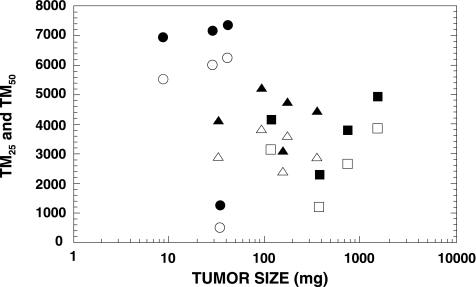
We then carried out experiments using U251 s.c. tumors, comparing results obtained using the standard comet assay with those obtained using the modified comet assay. Figure 3 shows examples of the TM profiles obtained from various sizes of tumors using the standard comet assay. Although the TM distributions were broad, none of the profiles revealed two obvious peaks that would indicate oxic and hypoxic cells. Wheneither the TM25 or TM50 from 13 tumors was plotted as a function of tumor size, large variations were obtained among tumors with similar sizes (Figure 4). Regression analysis performed on the log tumor size revealed an apparent decrease in TM50 as a function of tumor size, but the large estimated variability resulted in a nonsignificant association between TM50 and tumor size (P=.2). Analysis of the TM25 data produced similar results. Therefore, we were unable to demonstrate a correlation between either TM25 or TM50 and tumor size using the standard comet assay.
Figure 3.
TM size distributions of U251 s.c. tumors using the standard comet assay. Comets were prepared immediately after 15 Gy of whole body irradiation. Three hundred comets were scored from three slides for each tumor sample.
Figure 4.
TM25 (open symbols) and TM50 (closed symbols) for U251 s.c. tumors assayed using the standard comet assay. Each symbol shape represents an individual tumor; the same symbol means that these tumors were assayed in the same experiment.
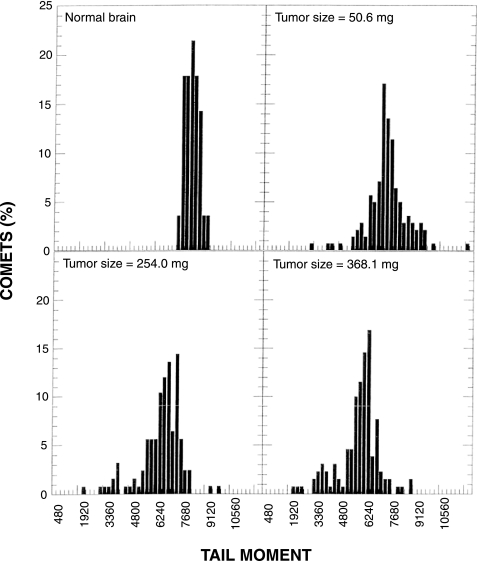
We repeated the measurements of hypoxia in the U251 s.c. tumor model using the modified comet assay. TM distributions for normal brain and for various-sized tumors from one experiment are shown in Figure 5. The TMs from normal brain cells were much more uniform than those from tumor cells, and we assumed that the majority of cells in the normal brain were oxic. Therefore, the broad TM distributions observed in tumors presumably reflected the presence of hypoxic cells with smaller TMs. Eleven tumors of various sizes were studied. When the data were plotted as either TM25 or TM50 (Figure 6), we obtained reasonably consistent results. The estimated variability in these data, determined from regression analysis, was three-fold to four-fold less than observed for the data derived using the standard comet assay (Figure 4). Thus, although both sets of data revealed similar estimates for the decrease in TM50 or TM25 as a function of tumor size, this apparent relationship was significant (P=.03 for the TM50 data) only for the data derived using the modified comet assay (Figure 6).
Figure 5.
TM distributions of U251 s.c. tumors using the modified comet assay. Mice received an i.p. injection of 100 mg/kg RSU 1069 1 hour before whole body irradiation with 10 Gy. Comets were prepared immediately after irradiation. Three slides were prepared from each sample; 150 comets were scored for the normal brain and 300 comets were scored for each tumor sample.
Figure 6.
TM25 (open symbols) and TM50 (closed symbols) for comets obtained from various sizes of U251 s.c. tumors using the modified comet assay. The same symbol shape means that these tumors were assayed in the same experiment.
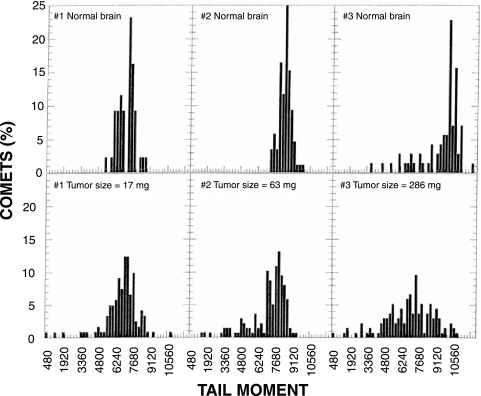
We also measured hypoxia in the two i.c. tumor models using the modified comet assay. TM distributions for U251 i.c. tumors and contralateral normal brains are shown in Figure 7. When tumor size was small, the contralateral normal brain displayed a tight TM distribution in which the majority of cells had relatively large TMs. Again, we assumed that these TMs represented oxic cells in the tumor. Animals with larger tumors (e.g., animal 3) exhibited broader TM distributions for contralateral normal brain. The smaller TMs in these profiles suggest the presence of hypoxic cells in the normal brain, which might have been caused by compression of the brain by the large tumors. The TM distributions for tumors were broader than the corresponding distributions for normal brain and included smaller TMs, which presumably were due to hypoxic cells. We determined the TM25 and TM50 for each tumor and for its associated normal brain and plotted the differences between these measurements versus tumor size (Figure 8). These differences were considered to be an index of the amount of hypoxia in the tumor. Differences between TM25 values for tumor and its associated normal brain were similar to differences between TM50 values for tumor and its associated normal brain. Thus, the sensitivity of the analysis was similar when either TM25 or TM50 was used for the calculation. Regression analysis of the TM50 data revealed a positive correlation between tumor size and amount of hypoxia in U251 i.c. tumors (P=.01). We also used the same method to measure the degree of hypoxia in four U87 i.c. tumors; the TM50 data for these tumors are shown along with the TM50 data for U251 i.c. tumors (from Figure 8) in Figure 9. There was no association between tumor size and hypoxia for U87 i.c. tumors (P=.89). Although the statistical testing for differences between the two cell lines is limited by the few observations for U87 i.c. tumors, the test for difference between the two slopes approached statistical significance (P=.08).
Figure 7.
TM distributions of U251 i.c. tumors using the modified comet assay. Tumor-bearing rats received i.p. injections of 100 mg/kg RSU 1069 1.5 hours before whole body irradiation with 10 Gy. Comets were prepared immediately after irradiation. Three slides were prepared from each sample; 300 comets were scored for each tumor sample and 150 comets were scored for the contralateral normal brain.
Figure 8.
Tumor hypoxia as calculated by the differences between normal brain and tumor in TM25 (open symbols) or TM50 (closed symbols) as a function of tumor size. The modified comet assay was used in the U251 i.c. tumor model. Each symbol represents an individual tumor.
Figure 9.
Comparison of tumor hypoxia in U87 i.c. tumors (open symbols) and U251 i.c. tumors (closed symbols replotted from Figure 8) as a function of tumor size. Tumor hypoxia was calculated as the difference between the TM50 of normal brain and tumor.
Discussion
Our laboratory is attempting to develop a hypoxia-specific therapy for treating human brain tumors. Therefore, we need an assay that will enable us to monitor changes in hypoxia in our various brain tumor models. One of the unique features of the comet assay is its ability to detect DNA damage in individual cells, which permits the detection of subpopulations in a tumor. Thus, we have investigated the standard alkaline lysis version of the comet assay using two human brain tumor cells, U87 MG and U251 MG. In vitro studies revealed a linear relationship between radiation dose and TM, and we obtained the expected OER of ∼3 (Figure 1). Therefore, the standard comet assay appeared promising for our purposes, but a subsequent in vitro experiment showed that this method was insufficiently sensitive to detect a small subpopulation of hypoxic cells in a mixed cell population (Figure 2). Moreover, our in vivo data using the standard comet assay to detect hypoxia in U251 s.c. tumors failed to exhibit two peaks representing oxic and hypoxic cells (Figure 3), and they showed large tumor-to-tumor variations (Figure 4). This result was not entirely unexpected because cells in solid tumors range from being anoxic to slightly hypoxic [4]. Therefore, it became obvious that we would need to employ an analytical method that was not dependent upon obtaining two peaks in the TM profiles.
Because the modified comet assay had been reported to amplify the difference between hypoxic cells and oxic cells [15], we investigated whether it might be suitable for detecting hypoxia in our model systems. We obtained more consistent results in U251 s.c. tumors, as compared with results obtained using the standard assay. The TM distributions from normal brain were tight, and TM distributions from tumors had greater spread, mostly towards the smaller TMs that were presumably due to hypoxic cells. We found that expressing the TM data as percentiles allowed us to compare the amount of hypoxia among tumors, and we found that the TM25 and TM50 provided equally sensitive measurements of hypoxia. Except for very small tumors, a good correlation between increasing tumor size and increasing hypoxia was obtained using either index in U251 s.c. tumors (Figure 6). This relationship is consistent with our earlier observations that the amount of necrosis in U251 s.c. and i.c. tumors increased with tumor size [16,17], because necrosis in solid tumors is due to oxygen (and other nutrient) deprivation.
It was interesting to note that hypoxic cells were detected in contralateral normal brain tissue when animals had large i.c. tumors. This may be due to increased intracranial pressure produced by the tumor. We calculated differences in TM between normal brain and tumor from the same animal. This results in a good correlation between tumor size and the degree of tumor hypoxia (Figure 8), similar to what was observed in U251 s.c. tumors (Figure 6).
The limited data obtained using U87 i.c. tumors indicate that these tumors have less hypoxia than U251 i.c. tumors at similar size (Figure 9). Moreover, there does not appear to be any relationship between hypoxia and tumor size. These findings corroborate our earlier observations that U87 MG tumors exhibit less necrosis than correspondingly sized U251 MG tumors. There are several possible explanations for these findings. Our in vitro cell survival data show that U87 MG cells are less tolerant to hypoxic conditions than U251 MG cells; approximately 50% of U87 MG cells are killed within 16 hours when kept under anoxic conditions, whereas no U251 MG cells were killed under the same conditions (data not shown). Thus, one might expect to see relatively few hypoxic cells in U87 tumors at any given time during their growth. Schultz-Hector et al. [19] measured the distance of tumor cells from the nearest blood vessel and found higher vascularity in U87 MG tumors as compared to other tumor models. These authors also reported that the distance between tumor cells and blood vessels remained constant as U87 MG tumors increased in size. This finding indicates that vessel growth in U87 MG tumors is relatively rapid, and also may explain the lack of correlation between tumor size and the degree of tumor hypoxia.
In summary, the modified comet assay worked better in our model systems than the standard comet assay. We were able to detect and compare hypoxia levels in the U251 s.c., U251 i.c., and U87 i.c. brain tumor models, and the degree of tumor hypoxia was well represented by differences in either TM25 or TM50 measurements. Using normal brain as an oxic control, we found that the degree of tumor hypoxia increased with increasing tumor size in both U251 s.c. and i.c. tumors. However, less hypoxia was found in large U87 i.c. tumors as compared to large U251 i.c. tumors. Our data suggest that the modified comet assay, when quantified by TM25 or TM50, is a suitable method for detecting tumor hypoxia in these model systems.
Acknowledgements
We thank I. Stratford and M. Jaffar at the MRC Radiology Unit and J.S. Sebolt-Leopold at Park Davis Pharmaceutical Research for providing RSU 1069. We thank Peggy Olive at the University of British Columbia for helpful discussions.
Abbreviations
- RSU 1069
1(2-nitro-1-imidazolyl)-3-aziridino-2-propanol
- s.c.
subcutaneous
- i.c.
intracerebral
- TM
comet tail moment
- PBS
phosphate-buffered saline
- OER
oxygen enhancement ratio
- PI
propidium iodide
- i.p.
intraperitoneal
Footnotes
This work was supported by NS47927 and CA85356.
References
- 1.Collingridge DR, Piepmeier JM, Rockwell S, Knisely JP. Polarographic measurements of oxygen tension in human glioma and surrounding peritumoural brain tissue. Radiother Oncol. 1999;53:127–131. doi: 10.1016/s0167-8140(99)00121-8. [DOI] [PubMed] [Google Scholar]
- 2.Rampling R, Cruickshank G, Lewis AD, Fitzsimmons SA, Workman P. Direct measurement of pO2 distribution and bioreductive enzymes in human malignant brain tumors. Int J Radiat Oncol Biol Phys. 1994;29:427–431. doi: 10.1016/0360-3016(94)90432-4. [DOI] [PubMed] [Google Scholar]
- 3.Gray LH, Conger AD, Ebert M, Hornsey S, Scott OCA. Concentration of oxygen dissolved in tissues at time of irradiation as a factor in radiotherapy. Br J Radiol. 1953;26:638–648. doi: 10.1259/0007-1285-26-312-638. [DOI] [PubMed] [Google Scholar]
- 4.Wouters BG, Brown JM. Cells at intermediate oxygen levels can be more important than the “hypoxic fraction” in determining tumor response to fractionated radiotherapy. Radiat Res. 1997;147:541–550. [PubMed] [Google Scholar]
- 5.Brizel DM, Scully SP, Harrelson JM, Layfield LJ, Bean JM, Prosnitz LR, Dewhirst MW. Tumor oxygenation predicts for the likelihood of distant metastases in human soft tissue sarcoma. Cancer Res. 1996;56:941–943. [PubMed] [Google Scholar]
- 6.Sutherland RM. Tumor hypoxia and gene expression—implications for malignant progression and therapy. Acta Oncol. 1998;37:567–574. doi: 10.1080/028418698430278. [DOI] [PubMed] [Google Scholar]
- 7.Brown JM, Giaccia AJ. The unique physiology of solid tumors: opportunities (and problems) for cancer therapy. Cancer Res. 1998;58:1408–1416. [PubMed] [Google Scholar]
- 8.Horsman MR. Measurement of tumor oxygenation. Int J Radiat Oncol Biol Phys. 1998;42:701–704. doi: 10.1016/s0360-3016(98)00332-0. [DOI] [PubMed] [Google Scholar]
- 9.Olive PL, Durand RE. Detection of hypoxic cells in a murine tumor with the use of the comet assay. J Natl Cancer Inst. 1992;84:707–711. doi: 10.1093/jnci/84.9.707. [DOI] [PubMed] [Google Scholar]
- 10.Ostling O, Johanson KJ. Microelectrophoretic study of radiation-induced DNA damages in individual mammalian cells. Biochem Biophys Res Commun. 1984;123:291–298. doi: 10.1016/0006-291x(84)90411-x. [DOI] [PubMed] [Google Scholar]
- 11.Olive PL, Durand RE, Le Riche J, Olivotto IA, Jackson SM. Gel electrophoresis of individual cells to quantify hypoxic fraction in human breast cancers. Cancer Res. 1993;53:733–736. [PubMed] [Google Scholar]
- 12.Olive PL, Horsman MR, Grau C, Overgaard J. Detection of hypoxic cells in a C3H mouse mammary carcinoma using the comet assay. Br J Cancer. 1997;76:694–699. doi: 10.1038/bjc.1997.448. [DOI] [PMC free article] [PubMed] [Google Scholar]
- 13.Hu Q, Kavanagh MC, Newcombe D, Hill RP. Detection of hypoxic fractions in murine tumors by comet assay: comparison with other techniques. Radiat Res. 1995;144:266–275. [PubMed] [Google Scholar]
- 14.Fairbairn DW, Olive PL, O'Neill KL. The comet assay: a comprehensive review. Mutat Res. 1995;339:37–59. doi: 10.1016/0165-1110(94)00013-3. [DOI] [PubMed] [Google Scholar]
- 15.Olive PL. Detection of hypoxia by measurement of DNA damage in individual cells from spheroids and murine tumours exposed to bioreductive drugs: II. RSU 1069. Br J Cancer. 1995;71:537–542. doi: 10.1038/bjc.1995.106. [DOI] [PMC free article] [PubMed] [Google Scholar]
- 16.Ozawa T, Wang J, Hu LJ, Lamborn KR, Bollen AW, Deen DF. Characterization of human glioblastoma xenograft growth in athymic mice. In Vivo. 1998;12:369–374. [PubMed] [Google Scholar]
- 17.Ozawa T, Wang J, Hu L, Bollen AW, Lamborn KR, Deen DF. Growth of human glioblastomas as xenografts in the brains of athymic rats. In Vivo. 2002;16:55–60. [PubMed] [Google Scholar]
- 18.Walton MI, Workman P. Pharmacokinetics and metabolism of the mixed-function hypoxic cell sensitizer prototype RSU 1069 in mice. Cancer Chemother Pharmacol. 1988;22:275–281. doi: 10.1007/BF00254231. [DOI] [PubMed] [Google Scholar]
- 19.Schultz-Hector S, Kummermehr J, Suit HD. Vascular architecture of experimental tumours—influence of tumour volume and transplantation site. Int J Radiat Biol. 1991;60:101–107. doi: 10.1080/09553009114551631. [DOI] [PubMed] [Google Scholar]


