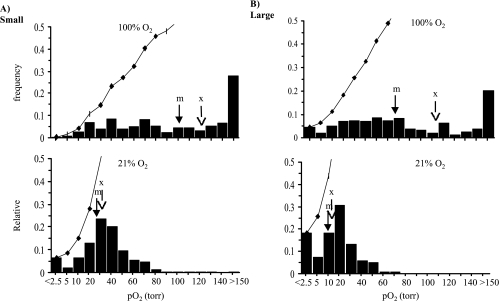
Figure 2.
Histograms of tumor oxygenation pooled for the H tumors. Data from six small (219 voxels) and six large (159 voxels) H tumors obtained using FREDOM show distinct heterogeneity. The small tumors (A) were significantly better oxygenated (mean=31 ± 2 Torr, median =27 Torr) than the large tumors (B) (mean= 14 ± 1 Torr, median = 12 Torr; P<.001). In response to respiratory challenge with oxygen, both mean and median pO2 in each group increased significantly (P<.001). Arrows indicate mean (x) and median (m) pO2, respectively. The bin numbers show the maximum pO2 for each category. Cumulative frequencies are shown by curves.

