Abstract
High density oligonucleotide array technology is widely used in many areas of biomedical research for quantitative and highly parallel measurements of gene expression. Affymetrix GeneChip arrays are the most popular. In this technology each gene is typically represented by a set of 11–20 pairs of probes. In order to obtain expression measures it is necessary to summarize the probe level data. Using two extensive spike-in studies and a dilution study, we developed a set of tools for assessing the effectiveness of expression measures. We found that the performance of the current version of the default expression measure provided by Affymetrix Microarray Suite can be significantly improved by the use of probe level summaries derived from empirically motivated statistical models. In particular, improvements in the ability to detect differentially expressed genes are demonstrated.
INTRODUCTION
Affymetrix GeneChip arrays (1) are used by thousands of researchers worldwide. The number of publications in scientific journals based on data produced using this technology is proof of its success. To probe genes, oligonucleotides of length 25 bp are used (2). Typically, a mRNA molecule of interest (usually related to a gene) is represented by a probe set composed of 11–20 probe pairs of these oligonucleotides. Each probe pair is composed of a perfect match (PM) probe, a section of the mRNA molecule of interest, and a mismatch (MM) probe that is created by changing the middle (13th) base of the PM with the intention of measuring non-specific binding. For simplicity, in this paper we will refer to the probed DNA molecules of interest as genes. After scanning the arrays hybridized to labeled RNA samples, intensity values PMij and MMij are recorded for arrays i = 1,…, I and probe pairs j = 1,…, J, for any given probe set.
To define a measure of expression representing the amount of the corresponding mRNA species it is necessary to summarize probe intensities for each probe set. Several model-based approaches to this problem have been proposed. We have developed an effective expression measure motivated by a log scale linear additive model. This summary statistic is referred to as the log scale robust multi-array analysis (RMA).
Using carefully prepared test data we can define tasks where we have an expectation of correct results. We used data from spike-in and dilution experiments to conduct various assessments on the RMA expression measure and two widely used competitors. Specifically, we compared the measures of expression according to three criteria of special interest to biomedical researchers. Any complete analysis of an expression measure should include at least assessments of the measure’s precision, consistency of fold change, and specificity and sensitivity of the measure’s ability to detect differential expression. We performed these assessments and demonstrated the substantial benefits of using the RMA measure to users of the GeneChip technology.
MATERIALS AND METHODS
The first version of Affymetrix’s analysis software (3) used an average over probe pairs of the differences PMij – MMij, j = 1,…, J, for each array i. A robust average was used to protect against outlier probes. Summary statistics, such as this average difference (AD), are motivated by underlying statistical models. A model for AD is PMij – MMij = θi + εij, j = 1,…, J. The expression quantity on array i is represented with the parameter θi. AD is an appropriate estimate of θi if the error term εij has equal variance for j = 1,…, J. However, the equal variance assumption does not hold for GeneChip probe level data, since probes with larger mean intensities have larger variances (4). In the latest version of their software (5), Affymetrix uses a log transformation that is successful at reducing the dependence of the variance on the mean. Specifically, the MAS 5.0 signal is defined as the anti-log of a robust average (Tukey biweight) of the values log(PMij – CTij), j = 1,…, J. To avoid taking the log of negative numbers, CT is defined as a quantity equal to MM when MM < PM, but adjusted to be less than PM when MM ≥ PM, which in general occurs for about one-third of all probes (4,6). A model for MAS 5.0 is log(PMij – CTij) = log(θi) + εij, j = 1,…, J.
A recent paper (7) reported that variation of a specific probe across multiple arrays could be considerably smaller than the variance across probes within a probe set. In the log2 scale, the between-array standard deviation (SD) is in general five times smaller than the within-probe set SD (4,7). To account for this strong probe affinity effect, a multiplicative model, PMij – MMij = θiφj + εij, i = 1,…, I, j = 1,…, J, was proposed (7). The probe affinity effect is represented by φj. For analyses where multiple arrays are available a model-based expression index is defined as the maximum likelihood estimate (under the assumption that the errors follow a normal distribution) of the expression parameters θi. This estimate will depend on the probe affinity effects φj, which we can estimate if we have enough arrays. The software package dChip (http://www.biostat.harvard.edu/complab/dchip/) can be used to fit this model and obtain what we refer to as the dChip expression measure. Outlier probe intensities are removed as part of the estimation procedure (7).
Using data from a spike-in experiment (described in more detail below) we found that appropriately removing background and normalizing probe level data across arrays results in an improved expression measure motivated by a log scale linear additive model. The model can be written as T(PMij) = ei + aj + εij, i = 1,…, I, j = 1,…, J, where T represents the transformation that background corrects, normalizes, and logs the PM intensities, ei represents the log2 scale expression value found on arrays i = 1,…, I, aj represents the log scale affinity effects for probes j = 1,…, J, and εij represents error as above. Notice that this is an additive model for the log transform of (background corrected, normalized) PM intensities. It is quite different from the additive model in PM – MM that was found unsatisfactory in Li and Wong (7), most likely because of the very strong mean variance dependence that would be present in such an additive model. A robust linear fitting procedure, such as median polish (8), was used to estimate the log scale expression values ei. The resulting summary statistic is referred to as RMA. The normalization and background correction procedures used are reported elsewhere (4,9). Recent results (4,10) suggest that subtracting MM as a way of correcting for non-specific binding is not always appropriate. It is possible that information about non-specific binding is contained in the MM values, but empirical results demonstrate that mathematical subtraction does not translate to biological subtraction. We have found that, until a better solution is proposed, simply ignoring these values is preferable.
There is no gold standard to compare and test summaries of probe level data. For this reason, data from spike-in experiments have been used to assess the technology and to motivate normalization procedures (1,11,12). In a recent paper (13) a dilution/mixture experiment was used to compare existing expression measures. In a similar way, we used data from spike-in and dilution experiments to conduct various assessments on the MAS 5.0, dChip and RMA expression measures. Specifically, we compare the measures of expression according to three criteria: (i) the precision of the measures of expression, as estimated by standard deviations across replicate chips; (ii) the consistency of fold change estimates based on widely differing concentrations of target mRNA hybridized to the chip; (iii) the specificity and sensitivity of the measures’ ability to detect differential expression, presented in terms of receiver operating characteristic (ROC) curves.
For the dilution study (http://qolotus02.genelogic.com/datasets.nsf/), two sources of cRNA, human liver tissue and a central nervous system cell line (CNS), were hybridized to human arrays (HG-U95A) in a range of dilutions and proportions (4). We studied data from six groups of arrays that had hybridized liver and CNS cRNA at concentrations of 1.25, 2.5, 5.0, 7.5, 10.0 and 20.0 µg total cRNA. Five replicate arrays were available for each generated cRNA (n = 60 total).
For the spike-in studies, different cRNA fragments were added to the hybridization mixture of the arrays at different pM concentrations. The cRNAs were spiked-in at a different concentration on each array (apart from replicates) arranged in a cyclic Latin square design with each concentration appearing once in each row and column. All arrays had a common background cRNA. We used data from two different studies, one from Affymetrix (http://www.affymetrix.com/analysis/download_center2.affx) where 14 human genes were spiked-in at concentrations ranging from 0 to 1024 pM and one from GeneLogic (http://qolotus02.genelogic.com/datasets.nsf/) where 11 control cRNA fragments were spiked-in at concentrations ranging from 0 to 100 pM.
The GeneLogic spike-in experiment consists of a number of arrays each hybridized to samples with suitable concentrations of 11 different cRNA fragments added to a hybridization mixture consisting of cRNA from the same AML tissue. The 11 control cRNAs were BioB-5, BioB-M, BioB-3, BioC-5, BioC-3 and BioDn-5 (all Escherichia coli), CreX-5 and CreX-3 (phage P1), and DapX-5, DapX-M and DapX-3 (a Bacillus subtilis gene) (11,14,15). The cRNA were chosen to match the target sequence for each of the Affymetrix control probe sets. For example, for DapX (a B.subtilis gene), the 5′, middle and 3′ target sequences (identified by DapX-5, DapX-M and DapX-3) were each synthesized separately and spiked-in at a specific concentration. Thus, for example, DapX-3 target sequence may be added to the total hybridization solution of 200 µl to give a final concentration of 0.5 pM. The 11 control cRNAs were spiked-in at a different concentration on each array (apart from replicates). The 12 concentrations used were 0.5, 1, 1.5, 2, 3, 5, 12.5, 25, 37.5, 50, 75 and 100 pM, and these were arranged in a 12 × 12 cyclic Latin square, with each concentration appearing once in each row and column. The 12 combinations of concentrations used on the arrays were taken from the first 11 entries of the 12 rows of this Latin square. Three replicated hybridizations were carried out for each combination of concentrations of the spiked-in material.
The Affymetrix spike-in experiment was done in a similar fashion. It consists of a series of human genes spiked-in at known concentrations. They represent a subset of the data used to develop and validate the MAS 5.0 algorithm. The Latin square consists of 14 spiked-in gene groups in 14 array groups. The concentration of the 14 groups in the first array group are 0, 0.25, 0.5, 1, 2, 4, 8, 16, 32, 64, 128, 256, 512 and 1024 pM. Each subsequent array group rotates the spike-in concentrations by one group, i.e. array group 2 begins with 0.25 pM and ends at 0 pM, on up to array group 14, which begins with 1024 pM and ends with 512 pM. There were three replicates for each concentration combination, except for two combinations for which 12 replicates were formed.
The results presented in the figures and tables were ob tained using the R environment (16), which can be freely downloaded from http://www.r-project.org/. All the data (cel files) containing the probe level intensities are available on the World Wide Web as stated above. To obtain the MAS 5.0 expression measures these files were processed with MAS 5.0 software. The software package dChip (http://www.biostat.harvard.edu/complab/dchip/) was used to obtain the dChip measures. The default PM-only model version was used. The RMA measures were computed using the Methods for Affymetrix Oligonucleotide Arrays R package (17), which is freely available on the World Wide Web (http://www.bioconductor.org).
RESULTS
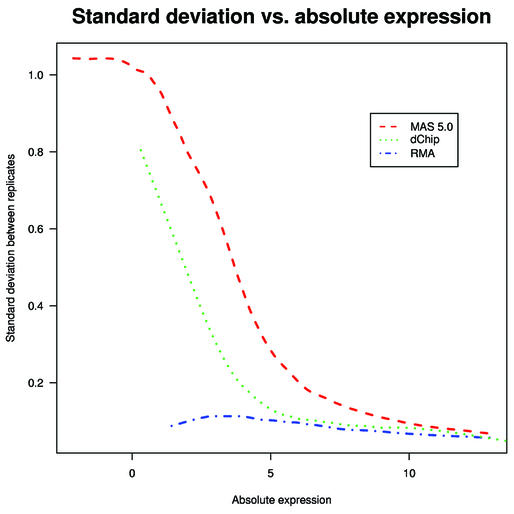
A common measure of precision used in the literature to compare replicate arrays is the squared correlation coefficient (R2). For the dilution data we computed average R2 over all 120 pairs of replicates (two tissues × six concentrations × 10 different pairs in each group of five replicates). We found that RMA outperformed dChip, which in turn outperformed MAS 5.0, with their average R2 values being 0.995, 0.993 and 0.990, respectively. The differences between the R2 averages are statistically significant. However, because of the strong probe affinity effect, GeneChip arrays will in general have R2 values close to 1, even for non-replicate arrays. The gene-specific log expression SD across replicates is a more informative assessment. We computed the SD of the expression values (log2 scale) across the five replicates in each of the six concentration groups. Smooth curves were then fitted to scatter plots of these SD values versus average expression value (log2 scale) (Fig. 1). This plot showed that RMA had a smaller SD at all levels of expression, with the SD for RMA being one-tenth that of the SD for MAS 5.0 and one-fifth of that for dChip at very low levels of average expression (1–2 on the log2 scale). To ensure that signal detection was not sacrificed for the gains in noise reduction, we examined the ability of the expression measures to detect the increase in cRNA across the concentration groups. As a summary of signal detection we computed the average, over all genes, of the expression versus concentration lines on the log–log scale (second and third rows in Table 1). Since every fold increase in concentration of the target sample should give rise to the same fold increase in an expression measure, a line fitted on the log–log scale should have slope 1. For reasons we don’t understand, all three measures lead to slopes well below 1, but on this criterion, RMA and MAS 5.0 performed similarly. dChip had a slightly smaller signal. This assessment demonstrated that RMA has similar accuracy but better precision than the other two summaries.
Figure 1.
The smooth curves shown were fitted to the scatter plots of SD versus average of log (base 2) expression for each gene using MAS 5.0, dChip and RMA on the dilution data. All genes for all six concentrations in liver and CNS groups were used.
Table 1. Summary statistics from dilution experiment (details described in the text).
| Assessment | MAS 5.0 | dChip | RMA |
|---|---|---|---|
| Average R2 over 120 pairs of replicates | 0.990 | 0.993 | 0.995 |
| Average slope over all genes across dilution concentrations (liver) | 0.65 | 0.59 | 0.67 |
| Average slope over all genes across dilution concentrations (CNS) | 0.63 | 0.58 | 0.67 |
| Correlation of fold change estimates from different concentrations | 0.85 | 0.95 | 0.97 |
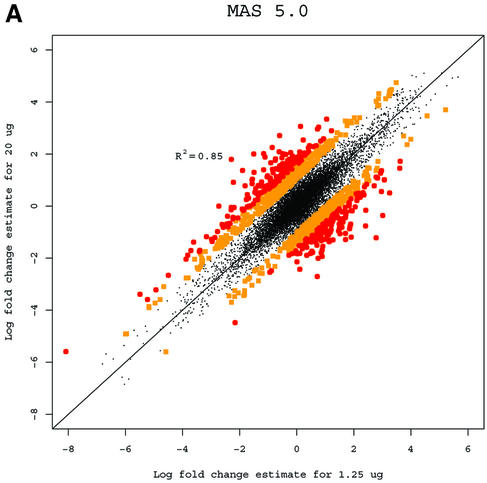
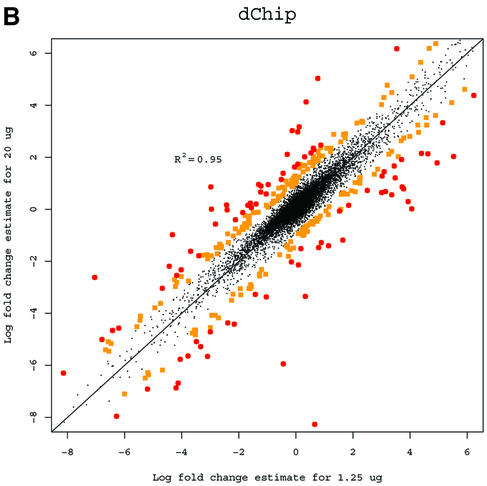
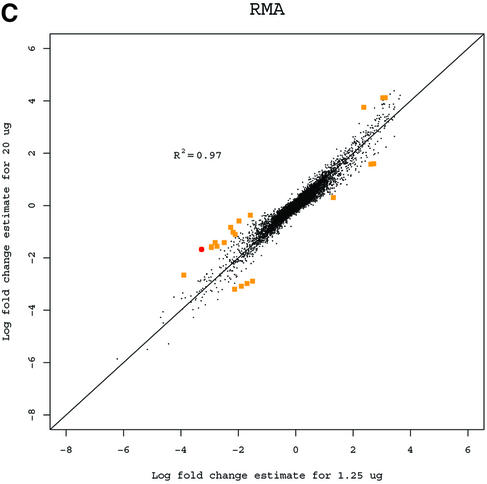
A basic application of the GeneChip technology is to study differences in gene expression between different RNA samples. Observed fold change in expression measures is used to assess differential expression (3). While the Affymetrix protocol calls for 15 µg of RNA, in practice the amount of target mRNA available for the hybridization reactions can differ greatly depending on the cells or tissue type under study. In some cases the available RNA will be amplified, and in others the hybridization will be carried out with <15 µg. It is desirable to have estimated fold changes in expression largely independent of the amount of target mRNA used. For an extreme example, suppose that one series of experiments is done with 20 µg of RNA in each hybridization, and another series is identical, but uses just 1.25 µg of RNA. Ideally, the answers should be very similar. For each gene we computed fold change estimates between the liver and CNS samples using the 10 arrays in the 1.25 µg concentration group for each of the three expression measures. We then computed estimates using the arrays in the 20 µg concentration group. Because fold change is a relative measure, estimates should be independent of the amount of RNA that is hybridized to the arrays. Log (base 2) fold change estimates of gene expression between liver and CNS samples computed from arrays hybridized to 1.25 µg of cRNA were plotted against the same estimates obtained from arrays hybridized to 20 µg for all three measures (Fig. 2). The correlation of fold change estimates from the different concentrations (Table 1) demonstrated that RMA and dChip provided more consistent estimates than MAS 5.0. RMA was slightly better than dChip. Using MAS 5.0 (Fig. 2A), 1223 genes had at least a 2-fold discrepancy (shown with larger dots) between the two fold change estimates. For dChip there were 302 (Fig. 2B) and for RMA (Fig. 2C) there were only 22. This assessment demonstrated that RMA provides more consistent estimates of fold change.
Figure 2.
(A) Log (base 2) fold change estimates of gene expression between liver and CNS samples computed from arrays hybridized to 1.25 µg of cRNA using MAS 5.0 plotted against the same estimates obtained from arrays hybridized to 20 µg. Genes demonstrating 2- to 3-fold inconsistencies are shown with squares. Genes demonstrating inconsistencies larger than 3-fold are shown with circles. (B) As (A) but using dChip. (C) As (A) but using RMA.
A typical application of GeneChip technology is finding genes that are differentially expressed in different tissues. Successful fold change analysis will detect all and only genes that are differently expressed due to biological variation. Because in the spike-in experiments arrays were hybridized to the same background, successful differential expression analyses should identify only the spiked-in genes as being differentially expressed. The absence of a batch mode in MAS 5.0 and dChip made running comparisons for all pairs prohibitive due to time. We therefore chose 10 pairs of arrays at random from both Affymetrix and GeneLogic spike-in studies. For each of these pairs we computed estimates of fold change using the three expression measures. Then, for a large range of cut-off values we computed the number of false positives (non-spiked-in genes with fold change estimates larger than the cut-off) and the number of true positives (spiked-in genes with fold change estimates larger than the same cut-off). ROC curves were created by plotting the true positive rates (sensitivity) versus false positive rates (1 – specificity). The true positive rates were estimated for the filtering operation, Observed Fold Change > cut-off, for a large range of cut-off values, by calculating the proportion of genes spiked-in at different concentrations that satisfy the filtering criterion. False positive rates were calculated in a similar way by computing the proportion of non-spiked-in genes that satisfy the filtering criteria. Areas under ROC curves can be used to compare specificity and sensitivity of competing tests. The fact that the RMA curves dominated the dChip and MAS 5.0 curves demonstrated that the differential expression calls obtained with RMA have higher sensitivity and specificity than those obtained with the other two measures (Fig. 3A and B). The true fold changes resulting from our random choice of pairs ranged from 3/2 to 1024. The task of detecting fold changes much larger than 2 might be considered less important than that of reliably detecting changes 2-fold or less, so we chose 10 pairs where the true fold changes were exactly 2 and repeated the analysis. The superiority of RMA appears even greater in this assessment (Fig. 3C). For comparisons of two arrays, Affymetrix software provides an alternative to fold change analysis based on the P value of a non-parametric test statistic (5). Test statistics can be created for RMA and dChip based on estimates of standard error obtained from probe level data (4,7). We repeated the above analysis for the test statistic and found the Affymetrix’s P value approach to work as well as the test statistic based on RMA and better than dChip’s version (Fig. 3D and E). However, Affymetrix’s P value analysis can only be used when comparing two arrays. We performed fold change analyses on two sets of 12 arrays with the same spiked-in concentrations and found RMA to have almost perfect sensitivity and specificity (Fig. 3F). In this comparison, dChip performed almost as well as RMA and significantly better than MAS 5.0. This assessment demonstrated that using RMA provides higher specificity and sensitivity when using fold change analysis to detect differential expression.
Figure 3.
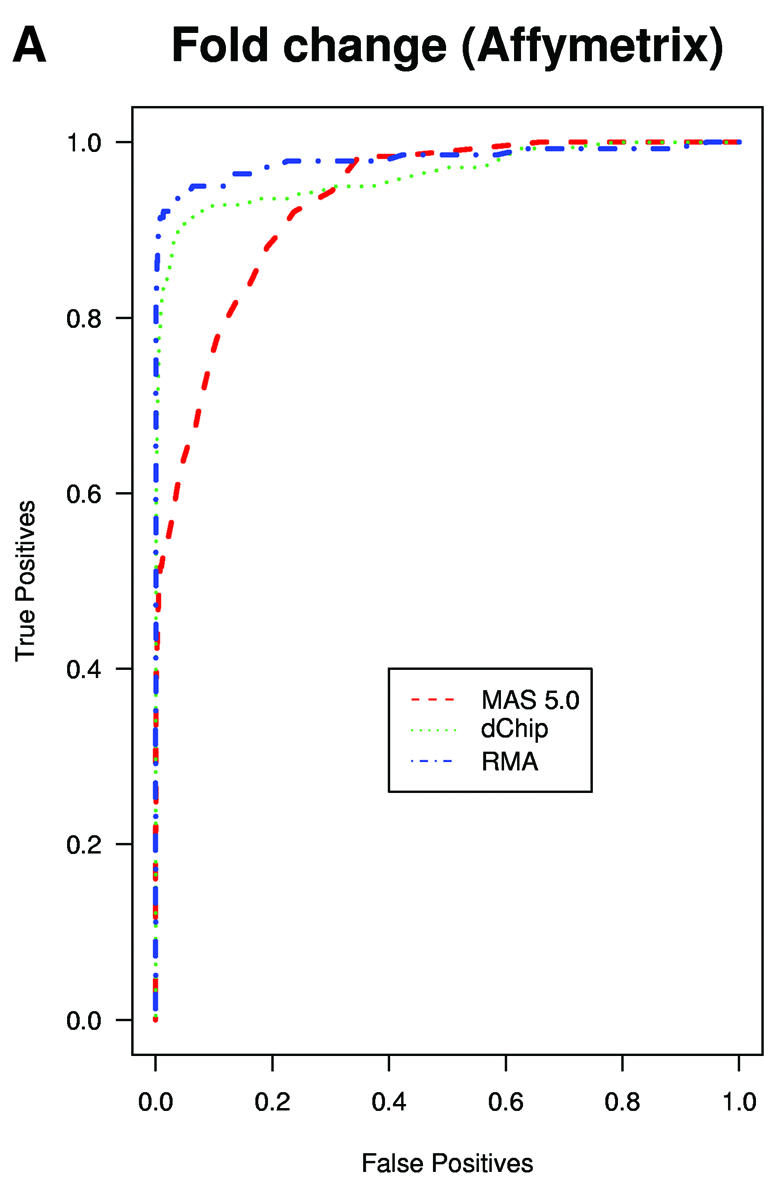
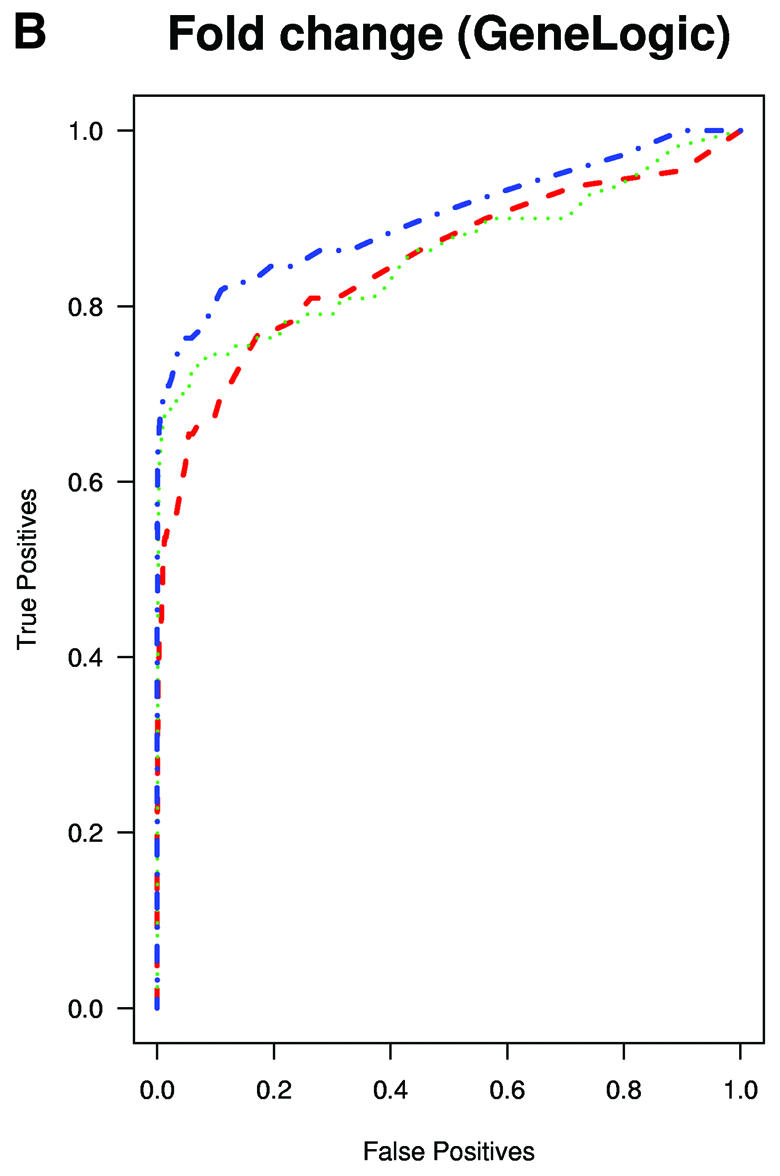
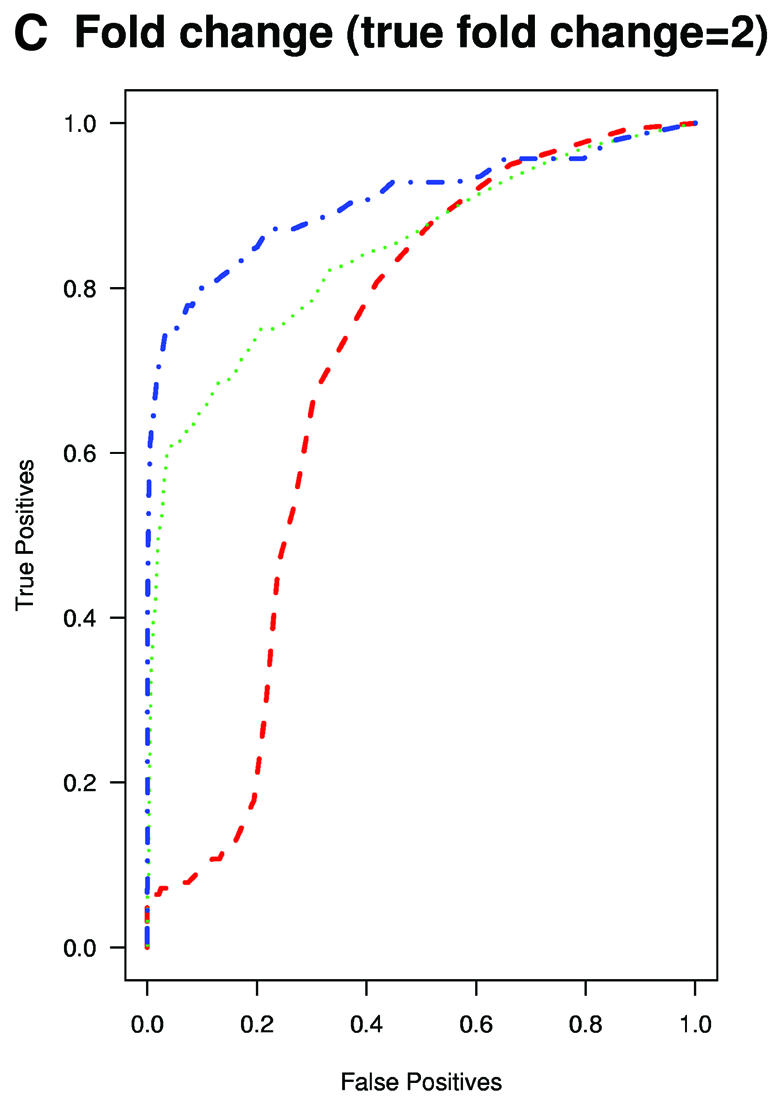
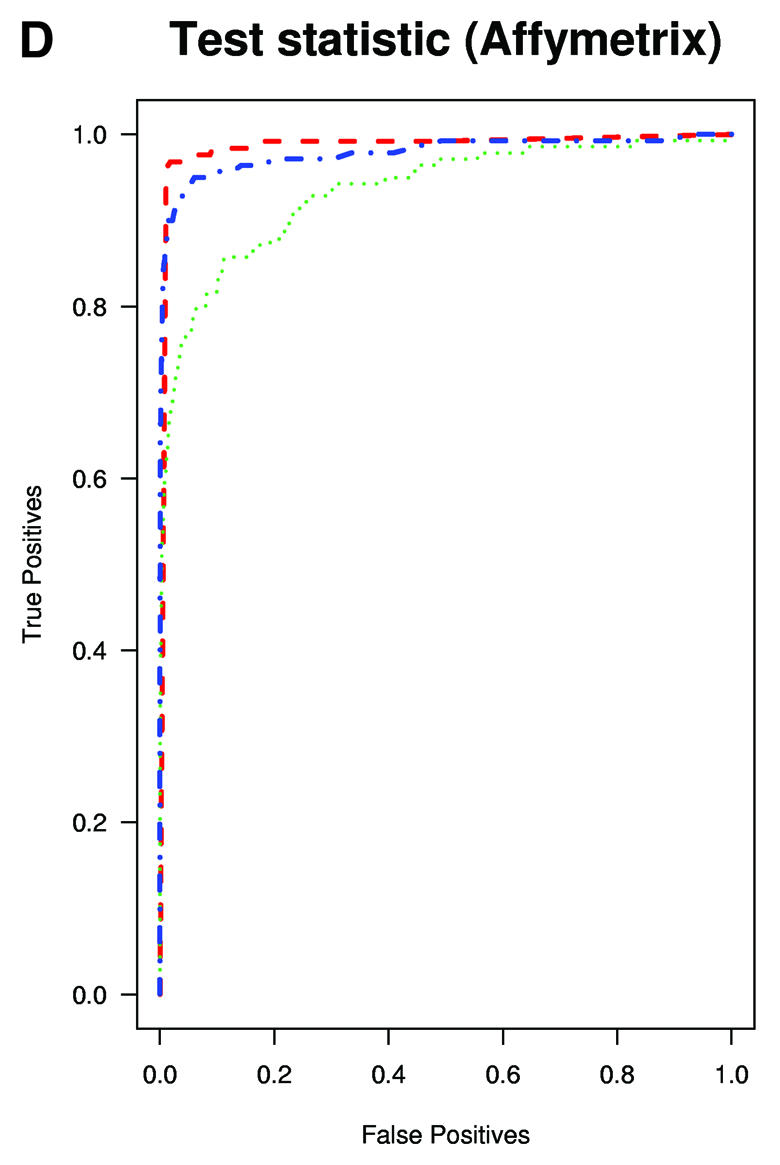
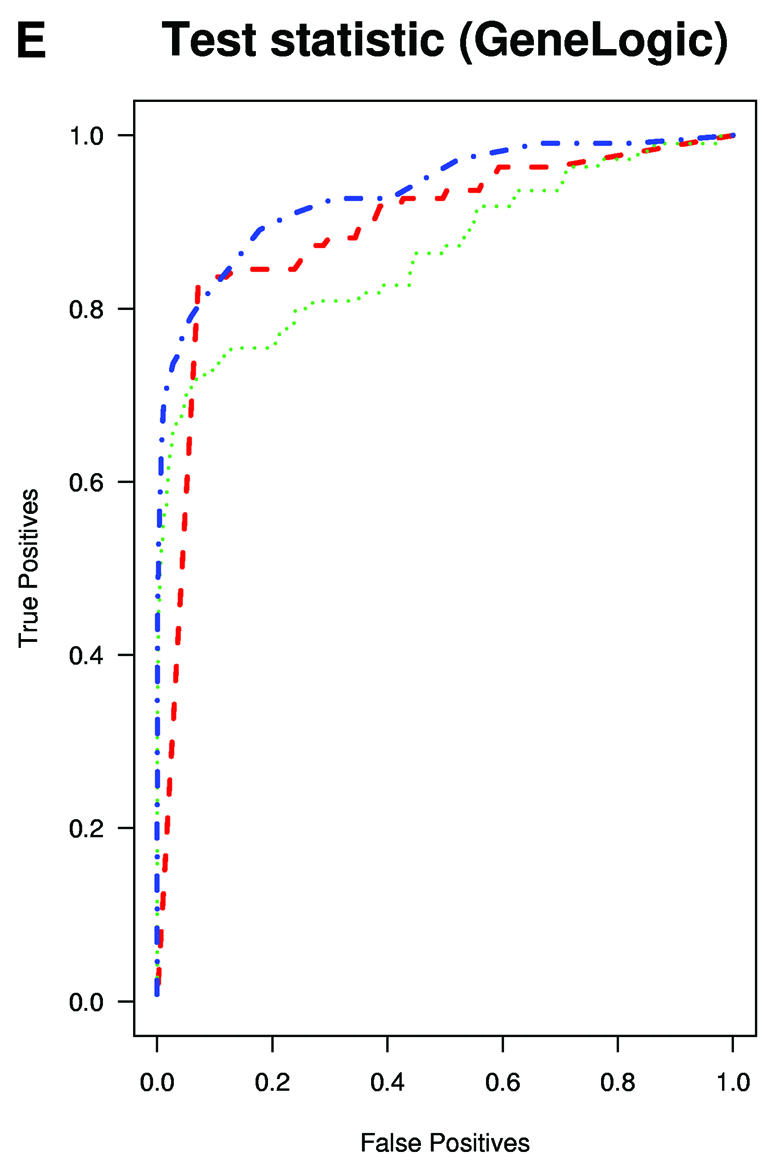
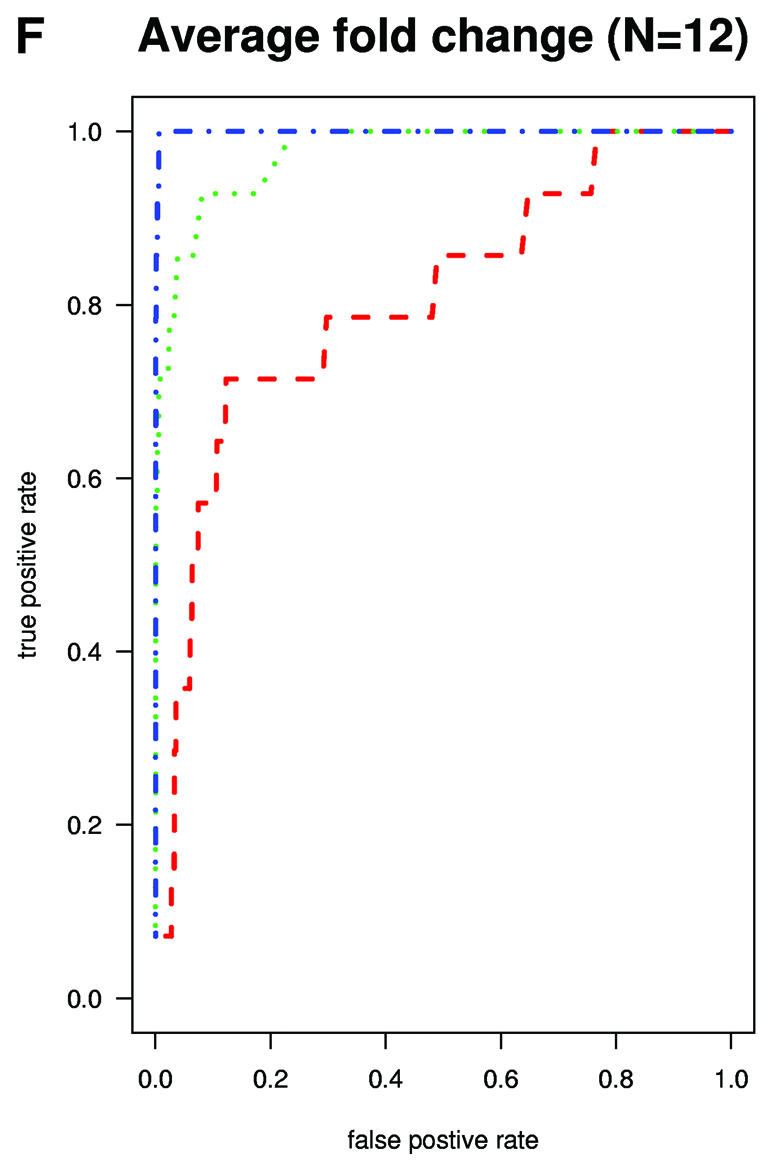
(Previous page and above) ROC curves for spike-in experiments. (A) For 10 pairs of arrays, chosen at random from the Affymetrix spike-in experiment, true positive rates (sensitivity) are estimated for the filtering operation, Observed Fold Change > cut-off, for a large range of cut-off values, by calculating the proportion of genes spiked-in at different concentrations that satisfy the filtering criterion. False positive rates (1 – specificity) are calculated in a similar way by computing the proportion of non-spiked-in genes, which satisfy the filtering criteria. (B) As (A) but using the GeneLogic spike-in experiment. (C) As (A) but selecting 10 comparisons for which the fold changes of spike-in concentrations are 2. (D) As (A) but using the filtering operation test statistic > cut-off. We used the software default test statistics for MAS 5.0 and dChip. (E) As (D) but using the GeneLogic spike-in experiment. (F) As (A) but comparing the average fold changes obtained from two sets of 12 replicate arrays.
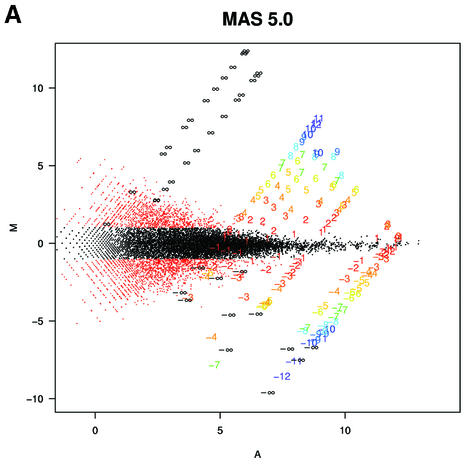
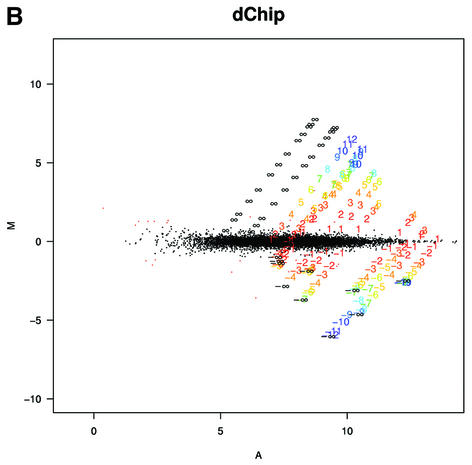
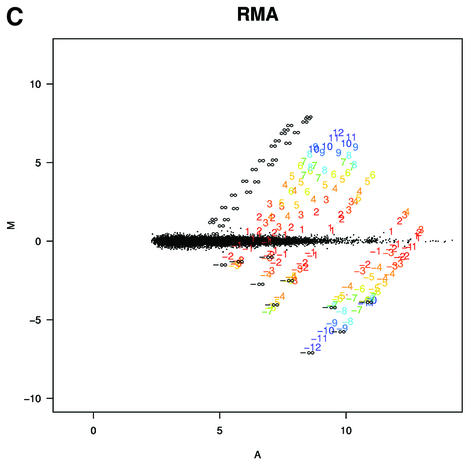
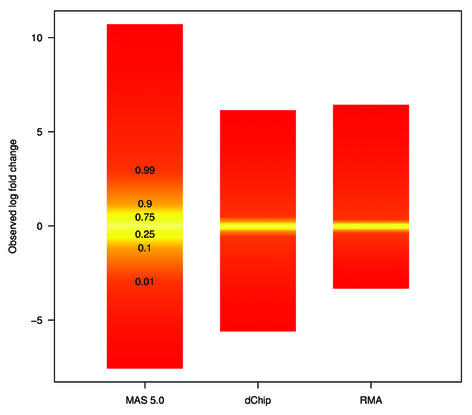
To understand why fold change analysis using RMA has better sensitivity and specificity we looked at Mg = log2(Yg/Xg) versus Ag = log2√XgYg = (logXg + logYg)/2, (MvA) plots for expressions Xg and Yg from two arrays being compared for all genes, g = 1,…, G. Log scale scatter plots of Yg versus Xg are commonly seen in the literature. MvA plots are 45° rotations of these scatter plots (18). We found MvA plots useful because log fold change (the quantity of most interest) is represented on the y-axis and average absolute log expression (another quantity of interest) on the x-axis. We selected one array from one of the Affymetrix spike-in experiments to use as a reference and then computed Mg and Ag for the comparisons of that array with all other arrays in the experiment using MAS 5.0 (Fig. 4A), dChip (Fig. 4B) and RMA (Fig. 4C). In these plots, the colored numbers represent the log (base 2) fold change in concentrations of all 14 spiked-in genes. Each distinct fold change is represented with a different color as a visual aid. The -∞ and ∞ represent fold changes with a zero in the numerator or denominator, respectively. The red points represent non-spiked-in genes with a fold change larger than 2. Except for the colored numbers, including ∞, genes should have log fold changes of 0. The fact that using RMA resulted in plots with fewer red points demonstrated that its smaller variance, especially for genes with lower absolute expression (Fig. 4A–C) resulted in better detection capability of genes spiked-in at different concentrations in the different arrays. Most of the genes having log fold changes of 2 when 0 was expected (red points in Fig. 4A) for MAS 5.0 were due to this large variance at the low end. Color box plots (Fig. 5) of fold change estimates demonstrated that RMA produces fold changes closer to 1 for genes that are not changing than those for MAS 5.0, with those for dChip being in between. In particular, the interquartile ranges of log2 fold change for equivalently expressed genes were 0.92, 0.22 and 0.19 for MAS 5.0, dChip and RMA, respectively.
Figure 4.
MvA plots (described in the text) for Affymetrix’s spike-in experiment. (A) For MAS 5.0, observed log (base 2) fold change (M) is plotted against average log (base 2) expression (A) for all genes from spike-in experiment array pairs. A reference array was selected from one of the replicate spike-in experiments and compared to all other arrays in that replicate experiment. The colored numbers represent the log (base 2) fold change in concentrations of all 14 spiked-in genes. Each distinct fold change is represented with a different color as a visual aid. The –∞ and ∞ represent fold changes with a zero in the numerator or denominator, respectively. The red points represent non-spiked-in genes with a fold change larger than 2. (B) As (A) but using dChip. (C) As (A) but using RMA.
Figure 5.
Box plots showing the distribution of observed fold changes for non-spiked in genes. The different colors represent the different quantiles. The relationship of color and quantile is demonstrated in the first box from the left.
Figures 2 and 4 also show that RMA compressed fold change estimates by 10–20% when compared to MAS 5.0. However, we believe that this modest loss of accuracy is well worth the substantial gains in precision achieved by RMA in relation to MAS 5.0. Our ongoing research is aimed at incorporating the MM intensities in such a way as to improve accuracy without sacrificing precision.
DISCUSSION
We have developed a summary of Affymetrix GeneChip probe level data, RMA, which serves as a measure of gene expression and compared it to other standard measures. Through the analyses of dilution and spike-in data sets we have shown that our measure performs better than MAS 5.0 and dChip. Specifically we found that: (i) RMA has better precision; in particular, for lower expression values we found that RMA provides a greater than 5-fold reduction of the within-replicate variance as compared to dChip and MAS 5.0; (ii) RMA provided more consistent estimates of fold change; (iii) RMA provided higher specificity and sensitivity when using fold change analysis to detect differential expression. For example, Figure 3C shows that for a false positive rate of 5%, the true positive rates were as different as 5, 60 and 75% for MAS 5.0, dChip and RMA, respectively, when performing fold change analysis. This greater sensitivity and specificity of RMA in detection of differential expression provides a useful improvement for researchers using the Affymetrix GeneChip technology.
Acknowledgments
ACKNOWLEDGEMENTS
We would like to thank GeneLogic and Affymetrix for the data, in particular, Uwe Scherf, Yasmin D. Beazer-Barclay and Kristen J. Antonellis (GeneLogic). We would also like to thank the R core, Bioconductor and Laurent Gautier (Technical University of Denmark) for writing great code and Ron Brookmeyer, Thomas Cappola, Sabra Klein, Scott Zeger (Johns Hopkins University), Ken Simpson, Sam Wormald (Walter and Eliza Hall Institute), Cheng Li (Harvard University) and Earl Hubbell (Affymetrix) for their insightful comments. The work of R.I. is supported by the PGA U01 HL66583.
REFERENCES
- 1.Lockhart D., Dong,H., Byrne,M., Follettie,M., Gallo,M., Chee M., Mittmann,M., Wang,C., Kobayashi,M., Horton,H. et al. (1996) Expression monitoring by hybridization to high-density oligonucleotide arrays. Nat. Biotechnol., 14, 1675–1680. [DOI] [PubMed] [Google Scholar]
- 2.Lipshutz R., Fodor,S., Gingeras,T. and Lockhart D. (1999) High density synthetic oligonucleotide arrays. Nature Genet., Suppl. 21, 20–24. [DOI] [PubMed] [Google Scholar]
- 3.Affymetrix (1999) Microarray Suite User Guide, Version 4. Affymetrix, http://www.affymetrix.com/support/technical/manuals.affx.
- 4.Irizarry R., Hobbs,B., Collin,F., Beazer-Barclay,Y., Antonellis,K., Scherf,U. and Speed,T. (2003) Exploration, normalization, and summaries of high density oligonucleotide array probe level data. Biostatistics, in press. [DOI] [PubMed] [Google Scholar]
- 5.Affymetrix (2001) Microarray Suite User Guide, Version 5. Affymetrix, http://www.affymetrix.com/support/technical/manuals.affx.
- 6.Naef F., Lim,D.A., Patil,N. and Magnasco,M. (2002) DNA hybridization to mismatched templates: a chip study. Phys. Rev. E Stat. Nonlin. Soft Matter Phys., 65, 040902. [DOI] [PubMed] [Google Scholar]
- 7.Li C. and Wong,W. (2001) Model-based analysis of oligonucleotide arrays: expression index computation and outlier detection. Proc. Natl Acad. Sci. USA, 98, 31–36. [DOI] [PMC free article] [PubMed] [Google Scholar]
- 8.Tukey J. (1977) Exploratory Data Analysis. Addison-Wesley, Reading, MA.
- 9.Bolstad B., Irizarry,R., Åstrand,M. and Speed,T. (2003) A comparison of normalization methods for high density oligonucleotide array data based on variance and bias. Bioinformatics, in press. [DOI] [PubMed] [Google Scholar]
- 10.Naef F., Hacker,C., Patil N. and Magnasco,M. (2002) Empirical characterization of the expression ratio noise structure in high-density oligonucleotide arrays. Genome Biol., 3, RESEARCH0018. [DOI] [PMC free article] [PubMed] [Google Scholar]
- 11.Hill A., Brown,E., Whitley,M., Tucker-Kellogg,G., Hunter G. and Slonim,D. (2001) Evaluation of normalization procedures for oligonucleotide array data based on spiked cRNA controls. Genome Biol., 2, RESEARCH0055. [DOI] [PMC free article] [PubMed] [Google Scholar]
- 12.Chudin E., Walker,R., Kosaka,A., Wu,S., Rabert,D., Chang,T. and Kreder,D. (2001) Assessment of the relationship between signal intensities and transcript concentration for Affymetrix GeneChip® arrays. Genome Biol., 3, RESEARCH0005. [DOI] [PMC free article] [PubMed] [Google Scholar]
- 13.Lemon W., Palatini,J., Krahe,R. and Wright,F. (2002) Theoretical and experimental comparisons of gene expression indices for oligonucleotide arrays. Bioinformatics, 18, 1470–1476. [DOI] [PubMed] [Google Scholar]
- 14.Hill A., Hunter,C., Tsung,B., Tucker-Kellogg,G. and Brown,E. (2000) Genomic analysis of gene expression in C. elegans. Science, 290, 809–812. [DOI] [PubMed] [Google Scholar]
- 15.Baugh L., Hill,A., Brown,E. and Hunter C. (2001) Quantitative analysis of mRNA amplification by in vitro transcription. Nucleic Acids Res., 29, 1–9. [DOI] [PMC free article] [PubMed] [Google Scholar]
- 16.Ihaka R. and Gentleman,R. (1996) R: a language for data analysis and graphics. J. Comput. Graph. Stat., 5, 299–314. [Google Scholar]
- 17.Irizarry R., Gautier,L. and Cope,L. (2003) An R package for analyses of Affymetrix oligonucleotide arrays. In Parmigiani,G., Garrett,E.S., Irizarry,R.A. and Zeger,S.L. (eds), The Analysis of Gene Expression Data: Methods and Software. Springer, in press.
- 18.Dudoit S., Yang,Y., Luu,P., Lin,D., Peng,V., Ngai,J. and Speed,T. (2002) Normalization for cDNA microarray data: a robust composite method addressing single and multiple slide systematic variation. Nucleic Acids Res., 30, e15. [DOI] [PMC free article] [PubMed] [Google Scholar]


