

Abstract
Microarray analysis is a critically important technology for genome-enabled biology, therefore it is essential that the data obtained be reliable. Current software and normalization techniques for microarray analysis rely on the assumption that fluorescent background within spots is essentially the same throughout the glass slide and can be measured by fluorescence surrounding the spots. This assumption is not valid if background fluorescence is spot-localized. Inaccurate estimates of background fluorescence under the spot create a source of error, especially for low expressed genes. We have identified spot-localized, contaminating fluorescence in the Cy3 channel on several commercial and in-house printed microarray slides. We determined through mock hybridizations (without labeled target) that pre-hybridization scans could not be used to predict the contribution of this contaminating fluorescence after hybridization because the change in spot-to-spot fluorescence after hybridization was too variable. Two solutions to this problem were identified. First, allowing 4 h of exposure to air prior to printing on to Corning UltraGAPS slides significantly reduced contaminating fluorescence intensities to approximately the value of the surrounding glass. Alternatively, application of a novel, hyperspectral imaging scanner and multivariate curve resolution algorithms, allowed the spectral contributions of Cy3 signal, glass, and contaminating fluorescence to be distinguished and quantified after hybridization.
INTRODUCTION
The complexity of the microarray process enhances the potential for variability. In a typical DNA microarray experiment, the relative expression levels of all protein-encoding genes are compared between two states of a cell (1,2). cDNA, derived from mRNA from the two states, is often differentially labeled with two fluorescent molecules such as Cy3 and Cy5. The labeled cDNAs are combined and hybridized to the DNA printed on the microarray slide using extremely small volumes (10–100 µl). The microarray is washed, dried, and scanned with green and red lasers to excite the Cy3 and Cy5 fluorophores, respectively. Using computer software, the intensity of the emission peaks of both Cy3- and Cy5-labeled targets in each gene spot are visualized as green and red, respectively, and quantified. To determine the background value, the local area around the spot is often used. This background value is subtracted from the Cy3 or Cy5 signal. Finally, the log2 of the ratio of the adjusted intensities is calculated for each gene-expression value to indicate its relative expression in the test versus the control cellular state (3).
Poor reproducibility in microarray analysis has been attributed to a variety of factors including cell harvesting conditions, biological variation, mRNA quality, printed spot quality, hybridization and differential incorporation of fluorescent nucleotides (4–9). Solutions to these problems include performing replicates of cell harvesting and microarray hybridizations. ‘Reverse labeling’ or ‘label switching’ on a set of two replicates is also used to ensure that results are not biased as a result of gene-specific preferential incorporation of the dyes (10).
Researchers typically adjust or normalize the data to correct for two common experimental biases: (i) fluorescent background, or fluorescence that is not due to fluorescent cDNA hybridization; and (ii) fluorophore-specific differences. Typically, background bias is removed by subtracting fluorescence outside the spot from fluorescence inside the spot, assuming that background is homogeneous across the local area. To adjust for bias due to fluorophore-specific differences, the simplest normalization method is to set the mean total intensities of Cy3 and Cy5 signals of one microarray to be equivalent, assuming that the expression patterns of most genes do not change between cellular states (3). This and other normalization methods will work only if all fluorescent background is subtracted from the data. If background is present predominantly within the spot (spot-localized), it cannot be accurately subtracted because current microarray scanner technology cannot distinguish between background fluorescent species and the studied hybridized fluorescent species in the same spot. Therefore, spot-localized background, if present, will continue to bias the data through any normalization method. There are no reports in the literature that discuss spot-localized background and its effects on microarray data.
We have found variable, spot-localized background, on several different pre-printed commercial microarrays as well as in-house printed arrays. For this paper, we use the term ‘contaminating fluorescence’ to describe the spot-localized background because it is detected in the green but not red channels of the Axon 4000B scanner and is indistinguishable from Cy3 (green) or other fluorophores detected in this channel. Several different methods for dealing with this type of contaminating fluorescence were tested and two different solutions to this problem were identified. First, allowing Corning GAPS I or UltraGAPS slides to ‘age’ for at least 4 h after removal from their packaging prior to printing was successful for removal of the spot-localized background before hybridization. Second, application of hyperspectral imaging and multivariate curve resolution (MCR) allowed spectra from Cy3-labeled cDNA to be distinguished from other fluorescent species and contaminating fluorescence after hybridization.
MATERIALS AND METHODS
Array printing
All slides printed in our laboratory were generated on a custom built arrayer (http://cmgm.stanford.edu/pbrown/mguide/) using SMP4 pins (TeleChem). To avoid carryover, pins were treated for two cycles with a 4 s wash and a 5 s dry between print loads. Printing solutions tested were DEPC–H2O, 3× SSC, 10 mM Tris (pH 7), ArrayIt Micro Spotting Solution (TeleChem) with or without oligonucleotides (40 µM). Oligonucleotides were either custom-designed 5′ amine modified 70mers for Neurospora crassa or the 70mer, genomic oligonucleotide set for Saccharomyces cerevisiae (Operon). Printing was performed in 50–52% humidity at 21°C.
Slide treatments
After printing, slides were UV-crosslinked at 90 mJ in a UV-Stratalinker 1800 (Stratagene) and baked at 80°C for 2 h. Except where mentioned, slides were given a post-printing treatment that included a 10 min wash in 0.1% SDS, 2 min wash in 2× SSC, 3 min in boiling water and 5 min in ice cold 100% ethanol, as recommended by the TeleChem ArrayIt protocol for ‘pre-hybridization’.
For sodium borohydride treatment Corning Microarray Technology (CMT) arrays were submersed in a fresh, bubbling, solution of 50 ml 0.25% sodium borohydride, 0.75× phosphate buffered saline and 25% ethanol at room temperature (RT) for 5 min, rinsed three times in 50 ml 0.2% SDS and then rinsed once in 50 ml double distilled water for 1 min. Slides were dried with 20–30 psi N2 gas. Mock-sodium borohydride treatment was identical to the above treatment except sodium borohydride was omitted.
Pre-hybridization and hybridization protocol
CMT S288C yeast v. 1.32 arrays (Corning), OpArray yeast arrays (Operon) and our printed slides were pre-hybridized in a 50 ml Coplin jar for 45 min to 1 h in 25% formamide, 5× SSC and 0.1% SDS at 42°C. Hybridization buffer was made up of pre-hybridization buffer plus 1 mM dithiothreitol and 100 µg/ml sonicated salmon sperm DNA and filter sterilized. Forty-five microliters of hybridization buffer was heated to 95°C for 5 min, centrifuged for 30 s at 16 000 g, and applied under a 22 × 30 mm Lifterslip (Erie Scientific) from the top right corner. Slides were sealed in CMT chambers (Corning) and incubated in a 42°C water bath overnight (15–20 h) (see also 3). ‘Mock-hybridization’ was identical to the hybridization protocol (based on CMT Yeast gene array protocol 9/00), including pre-hybridization, hybridization and wash steps, except labeled target was omitted. After hybridization, slides were washed as follows: (i) 1 min in 50 ml 2× SSC, 0.1% SDS at 42°C; (ii) 5 min in 250 ml 2× SSC, 0.1% SDS at 42°C; (iii) 10 min in 250 ml 2× SSC, 0.1% SDS at RT; (iv) 250 ml 0.1× SSC for 15 s at RT; (v) 2 min in 800 ml 0.1× SSC at RT; (vi) 2 min in 800 ml 0.1× SSC at RT; (vii) 1 min in 800 ml 0.1× SSC at RT; and (viii) 15 s in 250 ml of 0.01× SSC at RT. For wash step (i), each slide was washed in individual glass containers. For wash step (ii), up to four slides were combined in a container and agitated on a tabletop rocker. All 50 ml washes were performed in Coplin jars, 250 ml washes were performed in Wheaton glass staining dishes, and 800 ml washes were performed in 1770 ml Kimax crystallization dishes.
Detection of printed DNA probe
Hybridization with Panomer-9 Alexa 647 random oligonucleotides (Molecular Probes) was performed according to manufacturer’s protocol except that hybridization was performed for 10 min and washes were performed for 5 min with agitation. Slides were dried under 15–30 psi N2 gas and scanned.
Cy3- and Cy5-labeled cDNA target was made using 20 µg S.cerevisiae total RNA according to the CMT Yeast array 9/00 protocol (Corning). Hybridization for Figure 6E was performed as described above, except hybridization solution contained 5% dextran sulfate and 50% formamide and slides were set on an orbital platform in a 42°C oven. Slides were dried under 15–30 psi N2 gas and scanned.
Figure 6.

Increased time of slide exposure to atmosphere decreases retention of contaminating fluorescence but not hybridizable DNA after post-printing treatment. The S.cerevisiae genome 70mers set (Operon) in ArrayIt Micro Spotting Solution (TeleChem) was printed in-house on UltraGaps amino-silane (Corning) slides. A representative section spanning two pin groups (bracketed) is shown for each scan. Scans were done at PMT settings of 600, 600 for the red and green channels, respectively, unless noted. (A) Slide scanned immediately after printing. (B) Slide scanned after post-printing treatment. (C) Same slide as in (B) hybridized with random 9mers (Panomer Alexa 647, Molecular Probes) (PMT = 800, 550). (D) Slide ‘aged’ 4 h before print and then post-print treated. (E) Same slide as (D) hybridized with Cy3- and Cy5-labeled target reverse transcribed from 20 µg yeast total RNA (PMT = 570, 470). (F) Box-plot (see Fig. 2) of quantified spot intensities of scan shown in (D). (G) Box-plot of quantified spot intensities of a scan (PMT = 600, 600) of slide shown in (E).
Scanning and data analysis
Hyperspectral imaging data were collected on one Corning preprinted DNA microarray that had been hybridized with Cy3- and Cy5-labeled cDNA synthesized from 20 µg of yeast RNA. The hybridized slide was scanned using an Axon 4000B scanner and the hyperspectral imaging scanner, both at 10 µm spatial resolution at photo multiplier tube (PMT) settings indicated in the Figure 6 legend.
For detecting the contaminating fluorescence on all slides, except where indicated, scans were performed with 100% laser power and a PMT setting of 600–650 for both red and green lasers of an Axon 4000B scanner. PMT settings of 500–900 provide the maximum signal-to-noise ratio (http://www.axon.com/MR_Axobits.html) and are optimal for detecting and analyzing typical microarray experiments performed in our laboratory (unpublished data). Analysis was performed in GenePix Pro 3.0 (Axon). Grids used to define spot circumference were aligned manually, and the spot diameter for the grid was adjusted to be approximately the same diameter as the spots on the slide (180–240 µm).
Spot intensity, referred to throughout this paper, is the median pixel intensity after background subtraction in the green channel (median F532 – median B532). The percent loss of contaminating fluorescence was calculated for each spot as [1 – (spot intensity after treatment/spot intensity before treatment)] × 100%.
Images for microarray figures, except for Figure 7, were screen images from GenePix 3.0 (both red and green channels shown) pasted into Paint (Microsoft Windows2000), cropped, copied and pasted into Adobe Illustrator 9.0 without color correction. Images produced were visually identical in color and contrast to the original GenePix images.
Figure 7.
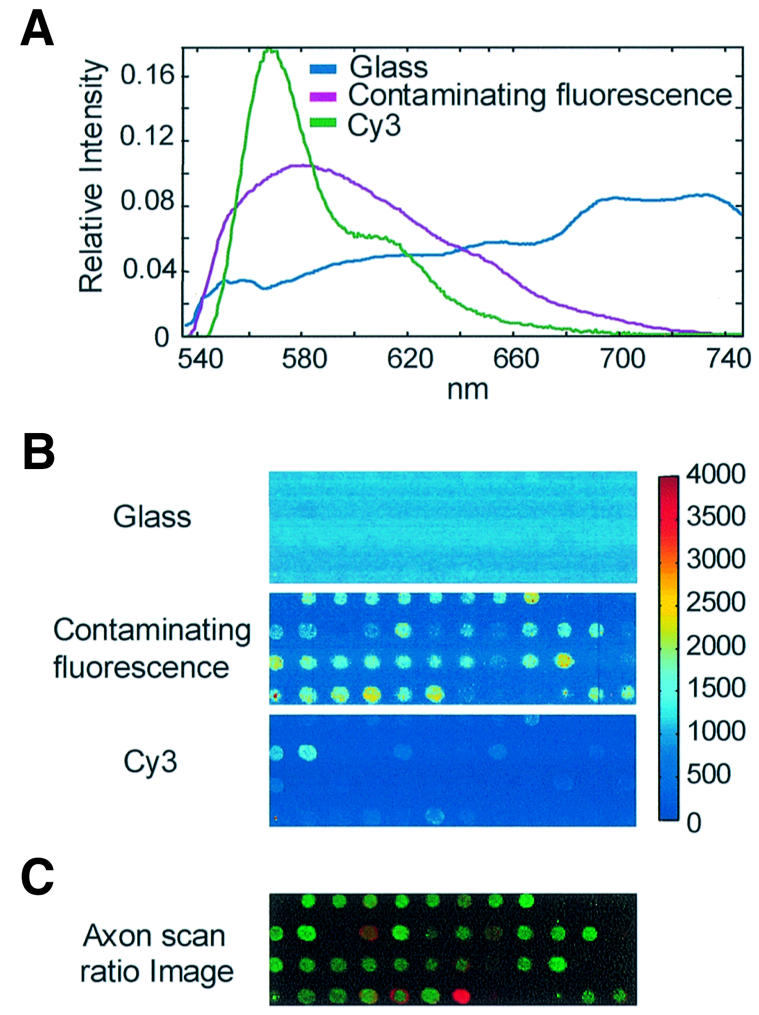
Hyperspectral scan results of a hybridized Corning preprinted array showing contaminating fluorescence in the presence of Cy3. Regions of a Cy3- and Cy5-cDNA hybridized Corning preprinted DNA microarray were scanned with both the hyperspectral imaging and the Axon 4000B scanners at 10 µm spatial resolution. The spectra and concentration maps were generated from multivariate image analysis of hyperspectral images containing 46800 spectra from a 3.9 × 2.3 mm area. Each image is scaled proportional to the total intensity of the Axon 4000B ratio image for visual comparison. The appropriate scale factors were calculated by multiplying each spectrum times its concentration map and applying a filter function similar to the optical filter used on the commercial scanner (Axon). (A) Emission spectra of fluorescent species, normalized to unit length. These fluorescent emissions would all be confounded in the green channel of commercial microarray scanners. (B) Corresponding concentration maps of fluorescent species. (C) Ratio image of same area of the same slide collected on an Axon 4000B scanner and visualized with GenePix Pro.
Hyperspectral imaging scanner and multivariate curve resolution
A hyperspectral-imaging scanner was developed at Sandia National Laboratories (M.B.Sinclair, J.A.Timlin, D.M.Haaland and M.Werner-Washburne, manuscript in preparation) similar to the scanner described by Schultz et al. (11). Identical regions of the same Cy3- and Cy5-cDNA hybridized Corning preprinted DNA microarray were scanned with the Axon 4000B and then the hyperspectral imaging system at 10 µm spatial resolution. Both scanners use a 532 nm laser to excite the slide, while the hyperspectral-imaging scanner uses a lower power density.
RESULTS
A variety of microarray reagents were found to exhibit persistent, variable, spot-localized, contaminating fluorescence in the Cy3 channel
Spot-localized background or contaminating fluorescence was detected in the green channel (Axon 4000B), in the absence of added Cy3, from two different manufacturers’ preprinted commercial slides, CMT Yeast S288C v. 1.32 and Operon Yeast OpArray as well as from in-house printed oligonucleotide arrays using Corning GAPS I and TeleChem superamine glass slides (Fig. 1). Contaminating fluorescence was not detected in the red (Cy5) channel on any of these slides. Although this entire study was performed with the Axon4000B scanner, contaminating fluorescence was also detected with the ScanArray 5000XL (GSI Lumonics) in the blue (488 nm) and green (514 nm and 543.5 nm) channels (not shown). The contaminating fluorescence signal observed with the ScanArray was even brighter in the 488 and 514 nm channels but dimmer in the 543.5 nm channel relative to the 532 nm channel of the Axon scanner.
Figure 1.

Spot-localized, contaminating fluorescence, detected only in the green channel, is present on both commercial and in-house printed microarrays. (A) Corning preprinted array (CMT12015426 yeast S288C v. 1.32, lot 28300001), and (B) OpArray YC2A35 (Operon) were scanned immediately after opening their original packaging. (C) Corning GAPS I aminosilane coated glass slides and (D) ArrayIt superamine coated glass slides (TeleChem) were spotted with water, 3× SSC, 10 mM Tris, or Micro Spotting Solution (MSS) with or without 70mer oligonucleotides (oligo) resuspended to 40 µM. No spot-localized fluorescence was detected in the red channel.
CMT preprinted yeast microarrays exhibited a distinct and highly variable pattern of spot-localized, contaminating fluorescence (Fig. 1A). Three CMT slides from the same lot (28300001), scanned immediately after removal from the manufacturer’s packaging, had an average spot intensity of 840 ± 689 (n = 6912 spots × three slides). Two other lots of Corning slides, printed about the same time, exhibited similar levels of contaminating fluorescence in the green channel (Camilo Canel, personal communication). Although there was no significant difference in average spot intensities between lots of untreated CMT slides, the maximum spot intensities, 6111, 5936 and 18500, were very different for each of three CMT slides (lot 28300001).
Contaminating fluorescence was also detected on pre-printed yeast array slides from a second commercial supplier (OpArray from Operon). The average spot intensity from the OpArray slide (Fig. 1B) was 628 ± 382 (n = 1141) with a maximum value of 2418. Thus, the contaminating fluorescence in spots on OpArray slides was similar in intensity to that observed on CMT slides, but spot-to-spot fluorescence was less variable. Similar spot-localized, variable, contaminating fluorescence was also detected from slides sold by a third supplier (not shown), suggesting this may be a recurring and apparently overlooked source of error in microarray data.
Spot-localized, contaminating fluorescence was also present on slides printed in-house using a combination of ArrayIt Micro Spotting Solution (TeleChem), Operon S.cerevisiae 70mer oligonucleotides, and Corning GAPS I and UltraGAPS slides. To investigate the source of the contamination, several common spotting solutions, in the presence or absence of N.crassa 70mer oligonucleotides, were printed on Corning GAPS I (amino-silane) (Fig. 1C), TeleChem (superamine) (Fig. 1D), Clontech type II (amine) slides and poly-lysine-coated slides (not shown). In the absence of added oligonucleotides, ArrayIt Micro Spotting Solution exhibited the highest fluorescence in the green channel on all five types of slides. The average spot intensity of contaminating fluorescence for Micro Spotting Solution with oligonucleotides on GAPS I slides (3116 ± 1405, n = 48 on two slides) was greater than that observed on Corning preprinted CMT yeast arrays.
Great care was taken to rule out the possibility that the contaminating fluorescence originated from our laboratory, especially for in-house printed arrays. To demonstrate that the fluorescence did not originate from reagent or pin contamination, non-fluorescing solutions, such as water or 3× SSC, were printed prior to printing the ArrayIt Micro Spotting Solution (Fig. 1C and D). These experiments were repeated with a second, previously unopened bottle of ArrayIt Micro Spotting Solution and produced the same results (not shown).
Post-hybridization, spot-localized background persists through hybridization and cannot be predicted from pre-hybridization scans
Two types of commercial yeast arrays, CMT (Corning) and OpArray (Operon), were scanned before and after a mock hybridization (Fig. 2). Spot-localized, contaminating fluorescence persisted on both types of commercially printed slides and the spot-to-spot intensities were highly variable.
Figure 2.
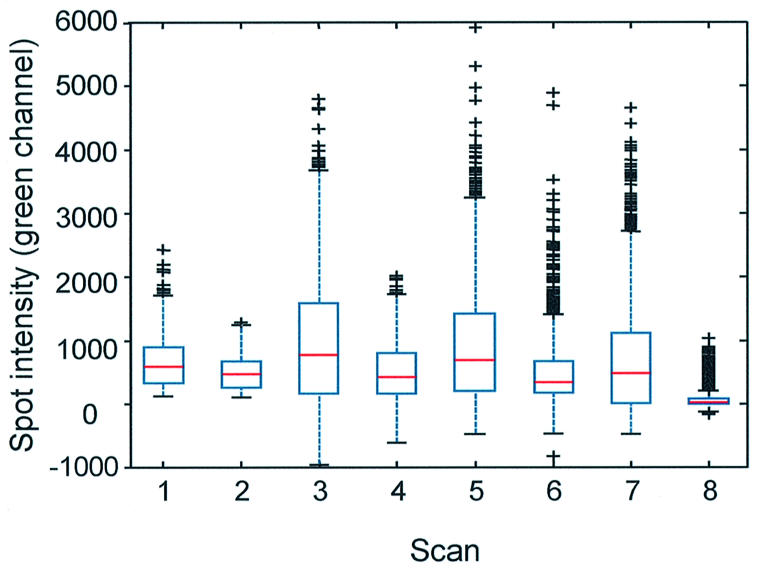
Spot-localized, contaminating fluorescence in the green channel on commercially printed arrays is highly variable and incompletely removed after mock-hybridization. Shown are box-plots of contaminating fluorescence intensities after background subtraction. One OpArray slide (Operon) (with 450 spots) was scanned before (scan 1) and after (scan 2) mock- hybridization. Two slides (Corning) (with 6174 spots, from lot 28300001) were analyzed before (scans 3 and 5) and after mock-hybridization (scans 4 and 6). One slide (Corning) from lot 27600002 was scanned before (scan 7) and after (scan 8) mock-hybridization. The upper and lower lines of one box indicate the 25th and 75th percentile, respectively, of the sample of spot intensities for one slide scan. The red line within the box indicates the sample median. The extent of the lines above and below the box indicate the upper and lower limits of the sample except for outliers, which are indicated by crosses. A spot intensity is considered an outlier if it has a value of 1.5 times the interquartile range (distance between top and bottom of the box) away from the top or bottom of the box.
Next, we determined whether the intensity of persistent spot-localized, contaminating fluorescence after hybridization could be predicted from scanning microarray slides prior to hybridization. Only those spots with intensity units >500 after background subtraction and before treatment were included in the analysis (n >3000). For every spot on one mock-hybridized Corning array, the percent loss of contaminating fluorescence versus its initial intensity before treatment was plotted (Fig. 3). A dramatic variation in the percent loss of spot-localized fluorescence over the array was observed. We concluded from these results that it was not possible to predict the level of post-hybridization, spot-localized, contaminating fluorescence based on levels detected before hybridization.
Figure 3.
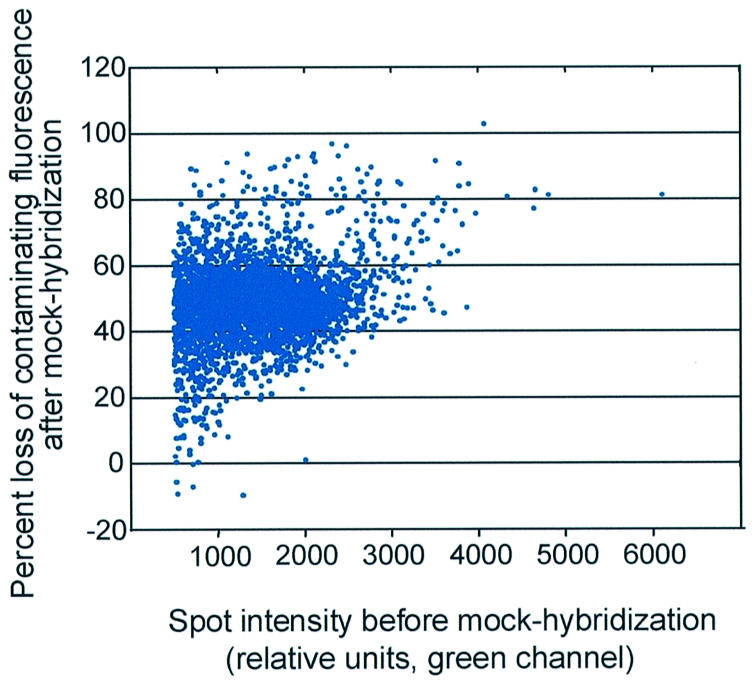
Contaminating fluorescence after hybridization cannot be accurately predicted by pre-hybridization scans. Spots from a commercial microarray slide (CMT12015426, lot 28300001, Corning) were quantified before and after mock-hybridization. Spot intensity was calculated as (median pixel intensity – median background pixel intensity) for the green channel (532 nm). Percent loss of contaminating fluorescence was calculated as [1 – (spot intensity after treatment/spot intensity before treatment)] × 100%. The spot intensity before treatment was graphed relative to the % loss of contaminating fluorescence. Only those spots with intensities >500 (after background subtraction), for the green channel before treatment, were included in this graph (n = 3933).
Signal-to-noise ratios cannot be used to identify spots with high contaminating fluorescence
Researchers often use a ‘signal-to-noise’ value of 3 or greater, which is calculated as (signal – background)/(standard deviation of the background) to identify ‘bad’ spots (http://www.axon.com/MR_Axobits.html). However, the ‘background’ that is typically measured is outside the spot, and does not include the background from spot-localized, contaminating fluorescence. In most cases, we observed the spot-localized background values were much higher than the standard deviation of the background.
Our calculations of the contribution of spot-localized, contaminating fluorescence indicates that discarding data from spots with a ‘signal-to-noise’ value below 3 does not necessarily remove the effect of contaminating fluorescence on the dataset. For example, analysis of one mock-hybridized CMT array revealed that signal-to-noise ratios of all 6174 spots in the red channel, in which there is no contaminating fluorescence, were equal to or less than 1. This would cause all red channel background measurements to be correctly filtered out. However, in the green channel, 2831 spots (46%) had spot-localized fluorescence intensities with a signal-to-noise ratio of 3 or more and 1496 (24%) had spot-localized fluorescence intensities with a signal-to-noise ratio of 6 or more (not shown). None of these data points would have been filtered out based on signal-to-noise ratio because they meet the criteria of a valid spot even though nothing was hybridized to them. We conclude from these observations that signal-to-noise ratios cannot be used to filter data in the presence of spot-localized, contaminating fluorescence.
In addition to the effect on signal-to-noise, errors in the green channel can have a serious effect on the Cy5/Cy3 ratio, especially after normalization. For example, if fluorescent intensity in the Cy3 channel includes the contaminating fluorescence and is falsely overestimated by a factor of 2 or more, then the log2 ratio used for analysis will be inaccurate, independent of the method of normalization. Any normalization method will also be in error when variable, spot-localized contaminating fluorescence is present in the green channel since the normalization process requires that all non-dye emissions be removed from the signal before the normalization is applied.
Reduction of spot-localized, contaminating fluorescence on commercially printed microarrays
The persistence of spot-localized contaminating fluorescence led us to try methods to eliminate this fluorescence prior to hybridization. We first tested the reducing agent sodium borohydride (Camilo Canel, personal communication) on Corning preprinted arrays. On these arrays, spot-localized, contaminating fluorescence was reduced by incubation in buffer with or without sodium borohydride. The final, average spot intensity did not differ between sodium borohydride- and mock-treated slides and was still 250 to >500 intensity units above background after both treatments (Fig. 4). We concluded that the reduction in spot intensity was due primarily to rinsing the slides and not the reducing effects of sodium borohydride, and this suggested treatment was not effective for satisfactorily removing the contaminating fluorescence.
Figure 4.
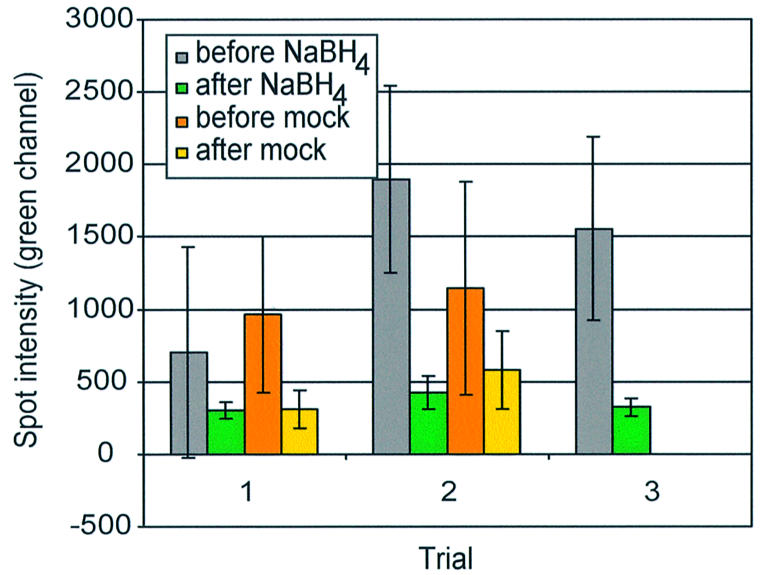
Contaminating fluorescence of commercial slides is partially removed by an aqueous solution in the presence or absence of sodium borohydride. CMT slides were scanned before (gray and orange bars) and after (green and yellow bars) treatment. Sodium borohydride treatment (gray and green bars) and a mock-sodium borohydride treatment (orange and yellow bars) were performed concurrently for each of two trials. A third trial without a mock-treated control is shown.
Preventing spot-localized, contaminating fluorescence on in-house printed microarrays
For preliminary tests, several partial genome slides were printed in-house, in a process that took <4 h. Contaminating fluorescence from in-house printed oligonucleotide arrays was reduced but not eliminated through a post-printing treatment suggested by TeleChem (Materials and Methods). On average, through this treatment, post-hybridization fluorescence intensity was reduced by >1000 units per spot to ∼200 units above background and was variable (Fig. 5). We felt this level and variability of contamination was still problematic.
Figure 5.
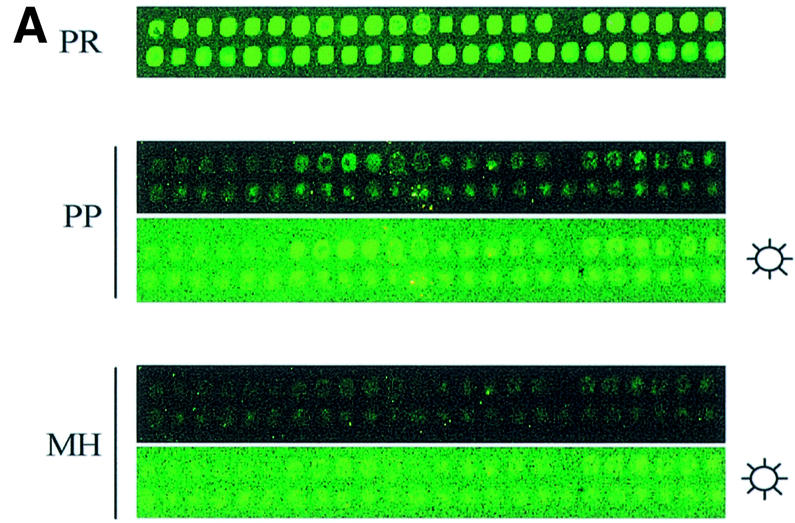
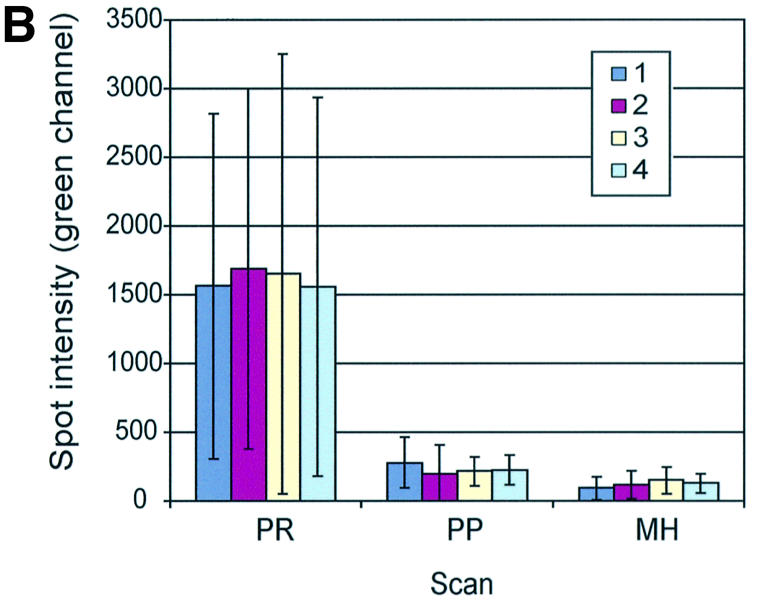
Post-printing treatment removes some but not all spot-localized, contaminating fluorescence of in-house printed arrays. (A) Yeast 70mer oligonucleotides (Operon) were spotted in ArrayIt Micro Spotting Solution (TeleChem) on GAPS I amino-silane slides and given a post-printing treatment as described in Materials and Methods. Contaminating fluorescence was visualized and quantified after print (PR), post-printing treatment (PP) and mock-hybridization (MH). Sun symbol denotes panel where brightness and contrast were adjusted to visualize the spots. (B) Spot intensities (median pixel intensity – median background pixel intensity) for each of four arrays (arrays 1–4) were averaged and graphed with standard deviations (n = 96 per array).
In examining the in-house printed, whole genome arrays, unprocessed arrays exhibited contaminating fluorescence in every spot (Fig. 6A). However, after the post-printing process, only about the first five rows of the print exhibited bright, spot-localized, contaminating fluorescence (Fig. 6B). The spot-localized fluorescence exhibited a gradual decrease and eventually disappeared after approximately the tenth row. We hypothesized that this result was due to the loss of slide surface reactivity over time, and that the binding affinity of the slide surface for the component causing contaminating fluorescence was high immediately after the slides were taken out of the package and decreased as the slides were exposed to the humidified atmosphere.
To test this hypothesis, GAPS I or UltraGAPS slides were exposed to air (50% humidity) for 4 h after removal from the manufacturer’s packaging and prior to printing. In three separate experiments, all spot-localized, contaminating fluorescence was extremely low and uniform in all rows after the post-printing treatment, with a median intensity around –20 intensity units per spot after background subtraction (Fig. 6D and F). We concluded that ‘aging’ the slides prior to printing and carrying out a post-printing treatment was the most successful way to eliminate spot-localized, contaminating fluorescence from in-house printed arrays.
Availability of printed DNA for hybridization
We asked whether the presence of contaminating fluorescence correlated with the amount of hybridizable DNA. Slides were hybridized with random 9mers (Panomer-9 Alexa 647, Molecular Probes) (Fig. 6C). Although the binding of these oligos to the printed 70mers is not uniform due probably to non-random distribution of the 9mer sequences, these results suggested that printed DNA throughout the slide was available for hybridization regardless of the presence or absence of contaminating fluorescence. To determine whether slides aged for 4 h prior to printing and then subjected to our post-printing treatment (see Materials and Methods) also contained sufficient amounts of DNA for hybridization, we hybridized Cy5- and Cy3-cDNA reverse transcribed from S.cerevisiae total RNA (Fig. 6E). From this slide, we observed least 100-fold changes in gene expression with fluorescence intensities up to the limits of the scanner (∼65 000) (Fig. 6F). These results show that after aging and the post-printing treatment, slides still contained significant amounts of hybridizable spotted DNA and could be used to obtain reliable microarray data.
Post-hybridization quantification of contaminating fluorescence
A hyperspectral imaging scanner, developed at Sandia National Laboratories, was used to quantitatively detect contaminating fluorescence in the presence of Cy3. The hyperspectral scanner can be used to collect the entire emission spectrum from 540 to 750 nm from an area (pixel) as small as 1 square µm. This additional spectral information at each pixel coupled with MCR allows multiple, overlapping fluorescence emission species to be identified and separated. In addition, individual, relative concentrations of each fluorescing species are accurately determined at each pixel. The details of the algorithms are discussed elsewhere (12). The MCR analysis generates representations of the spectra of each fluorescing species and corresponding images that map the intensity and location of each fluorescing component.
The analysis generates a relative concentration map of these components. The component spectra identify what fluorescence species are emitting, and the concentrations maps quantify how much of each species is present and where it is located on the slide. We identified three species that emit in the green channel of commercial scanners—Cy3, glass and contaminating fluorescence (Fig. 7). The spectra of these species overlap (Fig. 7A), making it impossible for commercial scanners to detect or quantify this background when most of the emission is spot-localized.
Concentration maps (Fig. 7B), scaled to the Axon ratio image, demonstrate the non-uniformity of the distribution of the spot-localized fluorescent contaminant. The GenePix (Axon) Cy5/Cy3 ratio image of the same region of this array is shown (Fig. 7C) for comparison. The concentration image of background fluorescence from the glass slide is relatively uniform (Fig. 7B), indicating that standard local background subtraction methods could be used for data correction if glassware were the only source of background emission. However, the concentration image of the contaminating fluorescence is spot-localized, and the intensities of this contaminating fluorescence are variable from spot to spot. Cy3 intensities obtained with commercial scanners cannot be corrected using local background subtraction methods when the contaminating fluorescence is present. In addition, the differences between the concentration map of the contaminating fluorescence and Cy3 indicate that the spot-localized fluorescent species does not correlate with the Cy3 hybridization. There are no current normalization protocols that could remove this variable contribution of the contaminating fluorescence to the Cy3 signal and, in fact, normalization would most likely reduce the quality of good data obtained from spots with low contaminating fluorescence.
Finally, comparison of the Axon 4000B ratio image and the Cy3 and contaminating fluorescence concentration images from the hyperspectral scanner reveals that many of the green spots in the ratio image are due primarily to the presence of the contaminating fluorescence and not Cy3-labeled cDNA. In fact, our calculations of the contribution of Cy3 and contaminating fluorescence to this microarray, based on wavelengths detected by the Axon 4000B scanner, indicate the green-channel intensities of 75% of the spots were in error by more than a factor of 2, 50% were in error by more than a factor of 3, and 25% of the spots were in error by more than a factor of 4.5 (Fig. 8). In addition, if one performed a simple normalization by making the mean intensities in the Cy5 and Cy3 channel equal, then the normalization applied to this array would be in error by a factor of 2.2.
Figure 8.

Fluorescence intensities before and after the removal of contaminating fluorescence from Cy3 emission intensity by hyperspectral imaging and MCR. The intensities in the green channel of 36 spots of a hybridized slide (lower three rows as visualized in Fig. 7B and C) were plotted before and after MCR correction.
CONCLUSION
The presence of persistent, spot-localized fluorescence on commercially printed as well as in-house printed microarrays is a very serious problem for microarray analysis for several reasons. First, the presence of contaminating fluorescence occurs with a variety of reagents and appears to be an ongoing, intermittent problem depending on the slide treatment. Second, spot-localized, contaminating fluorescence cannot be detected by current microarray scanners nor can its effect on the microarray data be properly corrected by normalization of the Cy5/Cy3 ratios. Current microarray scanner technologies, which are based on the detection of a single spectral band of emitted light for each fluorophore label, cannot differentiate fluorophores with overlapping emissions and, therefore, cannot quantify spot-localized background if it differs from the background around the spot. In addition, if contaminating fluorescence were present in only the green channel at the levels found in the slides reported in this paper, all current normalization methods would incorrectly adjust the intensities of the red and green fluorophore labels. Finally, the inability to predict residual, post-hybridization, spot-localized, contaminating fluorescence makes it impossible to go back to slide lots and estimate the level of this problem in any dataset. At the present time, the only way to recover or ‘clean up’ data that have already been obtained using arrays with spot-localized, contaminating fluorescence is through use of a hyperspectral imaging scanner, such as used in this study, with the resulting data analyzed with MCR to quantify all emission sources at each pixel in the scanned image.
It is not clear how many published datasets may be affected by this contamination. Contaminating fluorescence could easily contribute to the ‘dye-gene effect’ of a reverse labeling experiment reported in Kerr and Churchill (10). In that study, it was observed ‘spots for a particular sequence emitted higher fluorescent intensity for the green dye on both arrays’. Low intensity signals that were skewed toward the green fluorescence intensity were also identified by Yang et al. (13). Hopefully, with increased awareness of the importance of pre-hybridization scanning and pre-hybridization methods for removal, spot-localized, contaminating fluorescence will be eliminated as a problem in future microarray analysis.
Acknowledgments
ACKNOWLEDGEMENTS
We thank Mary Anne Nelson for providing N.crassa oligonucleotides and Gabriel Quiñones for technical support. We also thank Mark Van Benthem for support in developing the MCR algorithms and software used in this study. We are also grateful to Monica Manginell and the other members of our laboratory for helpful discussions. This work was supported by grants from NSF (MCB-0092374) and NIH (HG02262 and GM67593) to M.W.W., an NSF Minority Post-doctoral fellowship to M.J.M., and USDA (99-38422-8034) to A.D.A. Development of the hyperspectral scanner was funded in part by the WM Keck foundation and a Laboratory Directed Research and Development program from Sandia National Laboratories. Sandia is a multi-program laboratory operated by Sandia Corporation, a Lockheed Martin Company, for the United States Department of Energy under Contract DE-ACO4-94AL85000.
REFERENCES
- 1.Shalon D., Smith,S.J. and Brown,P.O. (1996) A DNA microarray system for analyzing complex DNA samples using two-color fluorescent probe hybridization. Genome Res., 6, 639–645. [DOI] [PubMed] [Google Scholar]
- 2.Schena M., Shalon,D., Davis,R.W. and Brown,P.O. (1995) Quantitative monitoring of gene expression patterns with a complementary DNA microarray. Science, 270, 467–470. [DOI] [PubMed] [Google Scholar]
- 3.Quackenbush J. (2001) Computational analysis of microarray data. Nature Rev. Genet., 2, 418–427. [DOI] [PubMed] [Google Scholar]
- 4.Brenner S., Johnson,M., Bridgham,J., Golda,G., Lloyd,D.H., Johnson,D., Luo,S.J., McCurdy,S., Foy,M., Ewan,M. et al. (2000) Gene expression analysis by massively parallel signature sequencing (MPSS) on microbead arrays. Nat. Biotechnol., 18, 630–634. [DOI] [PubMed] [Google Scholar]
- 5.Li X.M., Gu,W.K., Mohan,S. and Baylink,D.J. (2002) DNA microarrays: their use and misuse. Microcirculation, 9, 13–22. [DOI] [PubMed] [Google Scholar]
- 6.Goryachev A.B., MacGregor,P.F. and Edwards,A.M. (2001) Unfolding of microarray data. J. Comput. Biol., 8, 443–461. [DOI] [PubMed] [Google Scholar]
- 7.Schroeder B.G., Peterson,L.M. and Fleischmann,R.D. (2002) Improved quantitation and reproducibility in Mycobacterium tuberculosis DNA microarrays. J. Mol. Microbiol. Biotechnol., 4, 123–126. [PubMed] [Google Scholar]
- 8.Wildsmith S.E., Archer,G.E., Winkley,A.J., Lane,P.W. and Bugelski,P.J. (2001) Maximization of signal derived from cDNA microarrays. Biotechniques, 30, 202–208. [DOI] [PubMed] [Google Scholar]
- 9.Hegde P., Qi,R., Abernathy,K., Gay,C., Dharap,S., Gaspard,R., Hughes,J.E., Snesrud,E., Lee,N. and Quackenbush,J. (2000) A concise guide to cDNA microarray analysis. Biotechniques, 29, 548–562. [DOI] [PubMed] [Google Scholar]
- 10.Kerr K.M. and Churchill,G.A. (2001) Experimental design for gene expression microarrays. Biostatistics, 2, 183–201. [DOI] [PubMed] [Google Scholar]
- 11.Schultz R.A., Nielsen,T., Zavaleta,J.R., Ruch,R., Wyatt,R. and Garner,H.R. (2001) Hyperspectral imaging: a novel approach for microscopic analysis. Cytometry, 43, 239–247. [DOI] [PubMed] [Google Scholar]
- 12.Van Benthem M.H., Keenan,M.R. and Haaland,D.M. (2002) Application of equality constraints on variables during alternating least squares procedures. J. Chemometrics, 16, 613–622. [Google Scholar]
- 13.Yang Y.H., Dudoit,S., Luu,P., Lin,D.M., Peng,V., Ngai,J. and Speed,T.P. (2002) Normalization for cDNA microarray data: a robust composite method addressing single and multiple slide systematic variation. Nucleic Acids Res., 30, e15. [DOI] [PMC free article] [PubMed] [Google Scholar]