

Abstract
High-resolution structures of macromolecular complexes offer unparalleled insight into the workings of biological systems and hence the interplay of these systems in health and disease. We have adopted a multifaceted approach to understanding the pathogenically important structure of P-pili, the class I adhesion pili from pyelonephritic Escherichia coli. Our approach combines electron cryomicroscopy, site-directed mutagenesis, homology modeling, and energy calculations, resulting in a high-resolution model of PapA, the major structural element of these pili. Fitting of the modeled PapA subunit into the electron cryomicroscopy data provides a detailed view of these pilins within the supramolecular architecture of the pilus filament. A structural hinge in the N-terminal region of the subunit is located at the site of a newly resolved electron density that protrudes from the P-pilus surface. The structural flexibility provided by this hinge is necessary for assembly of P-pili, illustrating one solution to construction of large macromolecular complexes from small repeating units. These data support our hypothesis that domain-swapped pilin subunits transit the outer cell membrane vertically and rotate about the hinge for final positioning into the pilus filament. Our data confirm and supply a structural basis for much previous genetic, biochemical, and structural data. This model of the P-pilus filament provides an insight into the mechanism of assembly of a macromolecular complex essential for initiation of kidney infection by these bacteria.
Keywords: electron cryomicroscopy, fimbriae, macromolecular assembly, domain swapping, helical reconstruction
Bacterial adhesion is a key initiating step in the infection process, which is frequently correlated with the ability of pathogenic bacteria to colonize host tissue (1, 2). P-pili are necessary and sufficient for binding of pyelonephritic Escherichia coli to their human host (3), so detailed insight into the assembly process and 3D structure of these pili provides valuable information for the design of therapeutics that prevent or eliminate infection by interfering with this binding.
Our understanding of cellular solutions to mechanical problems is aided greatly by investigating macromolecular complexes on the scale of P-pili. Here we elucidate how a bacterium builds an extracellular structure larger than the channel through which it must pass. Transport of the proteins of uropathogenic pilins occurs via the general secretory pathway, by which pilins cross the inner cell membrane and are then chaperoned across the periplasm. At the outer membrane the pilins are translocated through a pore-forming usher and assembled into the pilus by proximal addition to the growing helical filament. The pore is large enough to accommodate a single pilin subunit in its native conformation but cannot accommodate the assembled helical filament (Fig. 1; for a review of pilus assembly, see ref. 4).
Fig. 1.

Schematic view of P-pili. P-pili are helical fibers extending from the outer membrane of pyelonephritic E. coli. The adhesin, PapG, binds to uroepithelial cells on its human host and is the most distal protein of the pilus fiber. PapG is followed by an adaptor protein, PapF, multiple copies of a fibrillar protein, PapE, an adaptor protein, PapK, and ≈1,000 copies of the major structural pilin, PapA. The pilus is anchored into the membrane by PapH (data not shown). All of the pilin subunits exit the cell during pilus assembly by passing through the usher, PapC, which is inserted in the outer membrane (OM) (see review in ref. 4). This figure was adapted from ref. 25.
Class 1 pili, including P-pili, type 1 pili, and Hib pili, are all helical structures 7–8 nm in diameter, with an axial hole 2–2.5 nm in diameter, and comprising 3.0–3.5 subunits per turn of the helix (5–7). From their genetic sequence similarity (8–12) and the known atomic structures of three minor pilins (13–15) the subunits of these pili are all predicted to be primarily β-strand. Donation of the N-terminal strand to the adjacent subunit produces a very stable fiber (Fig. 2c). Such intersubunit donation of a protein domain to an adjacent subunit has been more generally termed “domain swapping” as in the formation of amyloid-like fibrils, for example. In RNase A (16), as in P-pili, a β-strand donated from one subunit to the adjacent subunit provides a mechanism for continued growth of a fibrillar structure.
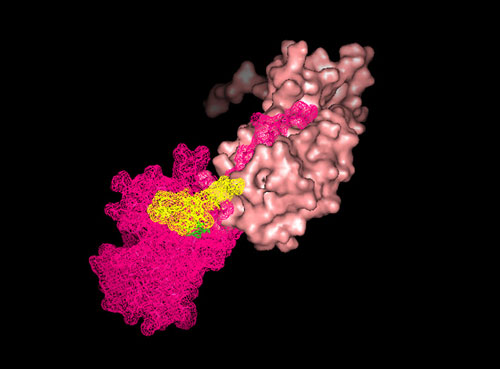
Fig. 2.

Modeling the major structural P-pilin, PapA. Homology modeling of PapA (magenta) from the known crystal structure of PapK (yellow; Protein Data Bank ID code 1PDK) shows that the secondary structure is retained (a), including adjacent β-strands that form a hydrophobic groove for N-terminal domain swapping. The arrow and arrowhead correspond to PapA residues 36–41 and 64–69, respectively, where significant differences between PapA and PapK can be seen. A “groove curve” (yellow) was defined to fit the N-terminal tail of the n + 1st PapA subunit into the nth PapA subunit (b). The N-terminal tail is shown to fit into the groove (c), with a hinge between adjacent subunits (d, white arrows). The hinge of the N-terminal tail extends into the protrusion (d, white arrows) in the electron density map (d, white mesh). Each PapA subunit is colored individually, and the P-pilus filament is seen perpendicular to the helical axis (d Left) and in cross section (d Right). Molecular graphics were made by using pymol (www.pymol.org).
Clear depictions of the assembly and architecture of macromolecular complexes have been achieved by the integration of 3D reconstructions derived from electron cryomicroscopy (cryoEM) with atomic resolution subunit models derived from x-ray crystallography and NMR (e.g. ref. 17). We have used electron microscopy, image processing, genetic mutation, and computational modeling to elucidate the assembly and structure of P-pili.
Results
3D Reconstruction of P-Pili by cryoEM.
We have determined the structure of P-pili preserved in vitreous ice using iterative helical real space reconstruction (IHRSR) (18), modified as described. By using 87% overlap between boxed segments of filaments, there were 31,698 initial “particles.” A sample of particles before and after alignment is shown (Fig. 3a and b, respectively), and the best 25,052 particles were included in the final reconstruction. A reduced particle size was used in the final reconstruction to minimize edge effects, resulting in a box overlap of 85.6%. Thus, this reconstruction corresponds to averaging ≈40,000 subunits. The solution converged within 50 cycles (Fig. 3c), and aligned particles covered the full range of projection angles, precluding the possibility of systematic errors in the alignment procedure (Fig. 7a, which is published as supporting information on the PNAS web site). Using a conservative 0.5 cutoff for the Fourier shell coefficient, the resolution of the reconstruction is 9.8 Å (Fig. 7b).
Fig. 3.

CryoEM P-pili data. (a and b) In the IHRSR method of helical reconstruction (18), short segments of the pili are treated as single particles (a), rotationally aligned (b), and iteratively aligned along the vertical axis (data not shown), with new reference models computed in each cycle. (Scale bar: 100 Å.) (c) Convergence of the helical symmetry occurs within 50 cycles (iterations), determining the number of subunits per turn of the helix (squares) and the rotation angle between adjacent subunits (diamonds).
The resultant 3D reconstruction (Fig. 4) has a maximum filament diameter of 82 Å. An axial channel 25 Å in diameter runs straight up the center of the helix axis with fenestrations that extend to the filament surface. P-pilus filaments contain 3.28 subunits per turn of the helix, with a 7.54-Å rise per subunit and a pitch of 24.7 Å. A newly visible region of electron density extends 7 Å from the filament surface, with a height of 17 Å (Fig. 4, arrow).
Fig. 4.

3D helical reconstruction of P-pili. The 3D reconstruction of P-pili from cryoEM data shows a helical filament 82 Å in diameter, with surface protrusions that extend 7 Å from the filament surface, for 17 Å along the helical axis (white arrow). A partially transparent view of eight subunits (two of the eight are not seen because they are exclusively on the back side of the filament) shows that PapA subunits sit 13° from horizontal (black arrow). The 3D reconstruction was visualized by using web software (32), and the PapA subunits were visualized by using pymol software. (Scale bar: 25 Å.)
Site-Directed Mutagenesis.
We have mutated Gly-15 to Cys-15 in PapA. The expression of G15C PapA results in assembly of thin fibrillar filaments ≈2 nm in diameter and produces no (expression system DH5α) or very few (expression system XL-Blue MR) mature helical fibers (Fig. 5a and b). A mutation of PapA Gly-7 to Ile-7 resulted in unpiliated bacteria, as did mutation of Gly-15 to Trp-15, or deletion of residues 3–9 (data not shown). The wild-type PapA plasmid yielded bacteria with hundreds of helical 8-nm-diameter pili (Fig. 5c).
Fig. 5.

Mutagenesis of PapA. Expression of P-pili with the site-directed mutation Gly-15 to Cys-15 in PapA typically yields bacteria with thin fibrillar filaments (2 nm in diameter) rather than mature helical filaments (8 nm in diameter). (a and b) When expressed in DH5α cells, only fibrillar filaments are seen (a), whereas, when expressed in XL1 Blue MR cells, most bacteria have no visible filaments, and those that do extend P-pili possess long fibrillar regions in tandem with regions of helical filament (b). (c) Transformation of XL1 Blue MR cells with wild-type PapA yields bacteria that all express hundreds of native-looking helical filaments. (Scale bar: 500 Å.)
Modeling Monomeric PapA.
A homology-based model of PapA, including residues 17–163, was constructed by using modeller software (19). The known structure of the minor P-pilin, PapK (Protein Data Bank ID code 1PDK) (14), was used as a target model based on its 26% sequence identity with PapA. PapA retains the secondary fold structure of its homologs, PapK and PapE (Fig. 2a and Fig. 8, which is published as supporting information on the PNAS web site). Thus, PapA retained the β-strand motifs, including a hydrophobic groove expected to accept the N-terminal extension of the adjacent pilin subunit during domain swapping. In the model of PapA the depth of this groove is variable, as is seen in the structure of PapE complexed with the N terminus of PapK (Protein Data Bank ID code 1N12) (15). Significant differences between the amino acid sequences of PapA and the minor pilins are illustrated clearly by residues 23–31 and 48–53 of PapA, corresponding to residues 32–40 and 57–63, respectively, of PapK (Fig. 2a, white arrow and arrowhead, respectively). Therefore, to improve the model, the structure of PapA was refined by using cns energy minimization (20), allowing side chain movement without further modification of the backbone.
The hydrophobic groove on the surface of PapA has been investigated in detail. We suggest a “groove curve” to describe the groove. It can be simply represented by a helix with a radius of 8.6 Å and a twist of 2.5° per 1.0-Å rise (Fig. 2b, yellow). The extended conformation of the tail, comprising residues 1–20, was obtained in a search procedure, resulting in the Cα backbone of the tail lying close to the groove curve, as shown in Fig. 9, which is published as supporting information on the PNAS web site. The interaction between the tail and the groove was reasonable, as determined by energy calculations that included both van der Waals and hydrophobic energy.
The P-Pilus Filament Model.
The pilus model was determined in two steps. First, to obtain the approximate positions and orientations of PapA molecules in the P-pilus fiber we fitted a rigid PapA “monomer” into the observed cryoEM map such that there was no overlap between neighboring residues (see Methods). The monomer was defined as a rigid complex of the nth subunit body, residues 21–163, and the n + 1st subunit tail, residues 1–20, sitting in the nth groove.
In the second step the rigidity of the monomer was partially released, such that C-terminal residues 1–20 and N-terminal residues 159–163 (groove residues) were all flexible, and the tail was allowed to shift along the groove curve. The best fit of the tail into the body and the monomer into the filament was that in which 14 tail residues were positioned along the groove curve (Nr = 14). This model had both the highest correlation with the EM map and a low, negative intermolecular energy. After refinement of the model using energy minimization, nine tail residues reside in the hydrophobic groove of PapA, and nine residues form a loop structure. Thus, the domain-swapped N-terminal donated by the adjacent PapA molecule contains residues 1–9 seated in the hydrophobic groove, and residues 12–20 form a loop structure that we propose is an intrasubunit hinge (Fig.10, which is published as supporting information on the PNAS web site). The position of this hinge corresponds to the newly visualized protrusion in the cryoEM map (white arrows in Figs. 2d and Fig. 4; see Movie 1, which is published as supporting information on the PNAS web site).
The PapA monomer is positioned in the pilus approximately horizontally, with the subunits oriented approximately perpendicular to the helix axis. The subunit sits 13° from horizontal with respect to the helical axis (Figs. 2d and 4), similar to previous results from model filaments created using PapK subunits (14).
Our data provide a structural basis for previous biochemical, immunological, and genetic mutation observations. First, residue 68 was shown to be capable of accepting a 58-aa insert (21). This residue is now seen located on the fully accessible outer surface of the P-pilus filament, adjacent to the newly visible protrusion of density. Second, residues 65–75 are all located on the outer surface of P-pili adjacent to the protrusion, suggesting its antigenic role for the immunogenicity of a peptide made from these residues (21). Similarly, residues 5–12, 7–12, 22–61, and 62–153 each have significant surface-exposed regions, consistent with the known antigenicity and immunogenicity of these regions (11, 21, 22). Specifically, of these residues, 10–26, 64–94, and 138–153 are externally surface-exposed. Exposed on the internal surface (in the central channel) are residues 43–57, 119, 120, 125, 126, 130, and 132. Third, residue 150 is positioned at the interface between the n and n + 3rd subunits, just at the edge of the hydrophobic groove. Its location can account for the assembly of pili with more variability in the number of subunits per turn of the helix, which is observed in the mutation G150A (23), because an alteration of this residue would affect helix formation. A less conservative mutation, G150T, is not capable of forming the helix at all (23, 24). Fourth, mutation of residues that we propose are in the hinge region, F13A, G15M, or V17A, did not produce pili that could be precipitated with MgCl2 but did yield PapA when coeluted with PapG (24). We observe that bacteria expressing G15C PapA produce primarily 2-nm-diameter fibrillar filaments and occasional short lengths of 8-nm-diameter helical fibers. The addition of a bulkier side chain, G15W, abrogates production of any fibrillar structure, as does the deletion of PapA residues 3–9 or the mutation G7I. Fifth, mutation of residue Q31 also precluded pilus assembly (24), which our model suggests is because of its interaction with residue 1 of the n + 1st subunit; disruption of the tail/body interaction could disrupt helix formation. Sixth, mutation of residues 106–109 was shown to alter helix formation (25). These residues are positioned at the subunit–subunit interface between the n and n + 3rd subunits, providing a structural explanation for the extended fibrillar structures and hyperflexible pili seen in P-pili containing this mutation (25).
Discussion
Our 3D reconstruction from frozen-hydrated cryoEM data describes several important refinements over the previous reconstruction derived from negative stain. The maximum filament diameter is 82 Å, as compared with 68 Å from negatively stained samples (6). This difference is not due to previous artifactual shrinkage or flattening, but to the ability to resolve a new feature on the pilus surface with the frozen-hydrated EM data. The axial channel, 25 Å in diameter running straight up the center of the helix axis (Fig. 2d), indicates that there was incomplete stain penetration in the negatively stained sample, because the channel is now shown to be axial rather than the smaller 20-Å-by-15-Å ellipse winding about the center that was seen previously (6). Still present are fenestrations that extend from the filament surface into the central channel and electron density in which the PapA monomer is best fit approximately horizontally, 13° from perpendicular to the helix axis. A new region of electron density extends 7 Å farther from the filament, with a height of 17 Å (Fig. 4d, white arrow). Without this feature, the filament diameter is 69 Å, well within experimental error of the 68-Å result from negatively stained samples.
Pili with genetic mutations in residue 13, 15, or 17 of PapA are not precipitated with MgCl2 (24). Although a mature pilus is not formed in these mutants, some PapA is added to the structure, as indicated by coelution of PapA with PapG. Similarly, overexpressed PapE, which form thin fibrillae, have been precipitated with ammonium sulfate rather than MgCl2 (26). This finding suggests that thin nonhelical fibers are not precipitable with MgCl2 and may explain the inability of the mutant pili to precipitate. Direct visualization of the thin fibers assembled in bacteria expressing G15C PapA provides support for this hypothesis; in one expression system (XL Blue MR cells) the ability of mutant PapA to form any oligomeric structure is severely compromised. In the other expression system (DH5α) a large majority of the bacteria were capable of assembling only thin fibrillar structures. These genetic data also support our interpretation of a hinge structure that includes G15 of PapA. The structure of this hinge, required for rotation of the subunits into their final position in the P-pilus helix, is not required for linear assembly of consecutive PapA subunits.
Initial modeling of PapA used PapK as the target structure. After refinement of the model using all possible rotamer conformations for both the tail residues and residues that line the groove, the resultant groove structure more closely resembles the PapE body/PapK tail crystal structure rather than the initial PapK groove (Fig. 8. This result is not surprising, because there is a conformational change between the unoccupied and occupied groove regions seen in crystal structures of PapE, and our model is of an occupied groove. Moreover, these data confirm the robustness of our modeling, because a starting model of PapK did not prevent the final model of PapA from refining to a structure quite similar to PapE in the groove region.
Results from modeling of PapA into the P-pilus filament, seen in Movie 1, provide evidence that the protrusion in the cryoEM map corresponds to the region of PapA where the n + 1st N-terminal domain (the donor strand) joins the nth subunit. In our model a loop is formed by the n + 1st N terminus just after exiting the groove of the nth subunit, corresponding to the 7-Å protrusion visualized on the surface of the pilus filament. We propose that this loop forms the pivot region for rotation of subunits during pilus assembly and pilus damage. That is, the PapA subunit exits the pore of the PapC usher approximately vertically and rotates into a horizontal position by rotation of this hinge (Fig. 6). Mutations in the hinge region can prevent this rotation and therefore preclude helix formation, as shown by Soto et al. (24) and our current data.
Fig. 6.

Subunits exit the cell vertically and rotate about an intrasubunit hinge to their horizontal position in the P-pilus helix. Schematic diagrams show that the hinge region provides a pivot point for rotation of the PapA subunit after exiting the PapC usher. (Left) Subunits travel in a linear arrangement through the usher in the direction of the arrow; the usher is shown as a cutaway view, with the cut surfaces marked with cross-hatching. The lightest-colored pilin subunit has already exited the pore and rotated about the hinge to its helical position; for clarity, its N-terminal “tail” is not shown. (Right) After rotation, the PapA subunits sit approximately perpendicular to the helical axis, shown in the assembled pilus looking down the helical axis; for clarity the usher has been removed from this diagram.
The primary sequence of PapA begins with eight residues not found in any of the minor pilins. These residues are followed by a highly conserved region homologous to the N termini of PapK and PapE, minor pilins that were crystallized successfully as monomers using residues 1–9 for donor strand complementation (14, 15). It has therefore been assumed, but not proven, that residues 11–17 (14) or residues 9–15 (15) of PapA provide the domain swap and sit in the hydrophobic groove. We propose that these residues will not be fruitful for use as the donor strand complement to produce monomeric PapA, because residues 12–20 form the hinge region of PapA. Our data do not, however, address the PapA–PapK interaction. Fitting of the N terminus of PapA into the groove of PapK does not require subunit rotation leading to formation of a helical filament, and it may be that residues 9–15 of PapA sit in the hydrophobic groove of the adaptor protein PapK. This hypothesis may explain our observation that, whereas G15C PapA expresses thin fibrillar filaments, the bulkier G15W PapA does not produce any visible external filaments.
Based on our current data, we propose that the N terminus of PapA provides protection of the hydrophobic groove of the adjacent PapA monomer via domain swapping, which results in a very stable and strong fiber. A hinge in the PapA subunit is used to position subunits horizontally into the assembled P-pilus filament after exiting the cell vertically via the PapC usher.
Methods
Sample Preparation.
Wild-type P-pili for cryoEM were prepared by using methods modified slightly from those used previously (27): pili were separated from the bacteria by using heat extraction at 65°C for 30 min. Purification then proceeded as previously, with three cycles of MgCl2 precipitation. P-pili at 0.1 mg/ml were placed on Quantifoil holey carbon grids (3–5 μl) in a humidity-controlled chamber, blotted, and plunged into liquid ethane. Photomicrographs were taken on Kodak SO163 film at 200 kV on an FEI TF20 electron microscope under low electron dose conditions (≈5–10e−/Å2).
Site-directed mutagenesis of PapA on the pFJ29 plasmid (gift of Scott Hultgren, Washington University, St. Louis) was performed and the genes were sequenced by Molecular Cloning Labs (South San Francisco, CA). The plasmids G15C, C15W, and G7I and deletion of residues 3–9 were transformed into XL1 Blue MR cells (Stratagene) and DH5α cells (gift of Ildiko Akey, Boston University School of Medicine), grown to OD600 0.5–0.7, and induced with 0.5 mM isopropyl β-d-thiogalactoside for 3–4 h. Bacteria were washed in TBS, negatively stained, and imaged at 100 kV in a Philips CM12 electron microscope. These negatives were digitized at 1,000 dpi on a Nikon 9000 scanner, corresponding to 5.6 or 14.9 Å per pixel.
IHRSR.
CryoEM negatives were digitized on a CreoScitex scanner at 440 dots per millimeter, corresponding to 0.91 Å per pixel. Data were binned to 1.82 Å per pixel before use, boxed at 168 × 168 pixel2, and later reboxed at 153 × 153 pixel2 for the final reconstruction to remove edge effects from rotation of filaments in the boxed images. In the IHRSR method (18) segments of pili boxed into individual overlapping images are treated initially as individual particles (e.g., Fig. 3a; 306 Å box cf. 347 Å repeat of the P-pilus helix). Seventy-seven micrographs with defocus values −1.32 μm to −3.52 μm were each phase-corrected for the contrast transfer function, and 375 filaments were selected. A 1D Fourier transform was calculated by using the rigid-body PapA fiber model. These data were used to normalize the electron density in each box. Data in the frequency range of 0.00723–0.260 Å−1 were normalized. Forty thousand subunits were included in the final reconstruction: 25,052 particles × (1 − 0.856 overlap) × (153 pixels per particle)/(1.82 Å per pixel)/7.54-Å rise per subunit = 40,221 subunits.
Additional details of the IHRSR procedures we used are included in Supporting Methods, which is published as supporting information on the PNAS web site.
Investigation of the Groove on the PapA Surface.
After homology modeling residues 17–163 of PapA using modeller software (19), an initial configuration of the PapA tail, residues 1–20, was built with standard bond lengths, bond angles, and arbitrarily chosen dihedral angles from the backbone-dependent rotamer library (28). Constraints during the search procedure included closeness of the tail to the body and a distance of >47 Å between residues 1 and 20. The scoring function for the search was the summation of van der Waals energy and hydrophobic energy. The former was calculated and minimized by using x-plor software (http://asdp.bio.bnl.gov/asda/LSD/manual/xplor_man/htmlman.html). The latter came from reduction of the accessible surface area due to formation of the tail+body complex. Accessible surface areas of the tail, body, and complex (tail+body) were calculated by using nsc software based on the double cubic lattice method (29) and converted to hydrophobic energy. The adjustable parameters in the search for the best tail conformation were the dihedral angles of residues 1–20. Acceptable conformations of residues were taken from the rotamer library (28). The conformations with the highest probability were used for each of the first 20 aa in the PapA sequence such that the number of conformations for each amino acid is 2n (see Supporting Methods and also Table 1, which is published as supporting information on the PNAS web site), as the genetic algorithm program requires. The total number of possible conformations was 2159 = 7 × 1047. The parallel genetic algorithm software library pgapack (http://www-fp.mcs.anl.gov/ccst/research/reports_pre1998/comp_bio/stalk/pgapack.html) was used for the search (see Supporting Methods for a description of genetic algorithm methodology). The N-terminal region (residues 1–20) in the resultant energy-minimized monomer was in an extended, linear conformation and was well inserted into the groove of the PapA molecule surface.
Molecular Position and Orientation of PapA in the P-Pilus Filament: Step One.
The helical symmetry determined from the cryoEM 3D reconstruction was used to assemble the P-pilus filament from the modeled PapA monomers. A 7D search space was used for the best initial fit of the modeled monomer into the reconstruction, including three parameters for the position of the monomer, three for its orientation in the filament, and one temperature factor parameter.
For both the electron density map and interaction energy calculations, amino acids were represented as a sphere of appropriate radius instead of as individual atoms. The atomic scattering factors were replaced with “globbic” scattering factors (30) for the electron density calculation. This simplified model has been shown to be effective to a resolution of 3–4 Å (30) and reduces computation time significantly, with a concomitant reduction in scatterers: from 1,425 to 326. The calculated electron density map was cross-correlated with the observed electron density from cryoEM data. Calculation of van der Waals energy used geometric and energy parameters taken from Levitt (31). Its inclusion in the fitness function prevented overlap between PapA monomers in the assembled fiber. To cover all intramolecular and intermolecular interactions, nine consecutive monomers were included in the calculation.
Modeling the P-Pilus Filament: Step Two.
The rigid body parameters and the temperature factor obtained in step one above were all refined. In addition to fine adjustment of these parameters, the rigidity of residues 1–20 and 159–163 (the five C-terminal residues) were released completely. Eleven cases were investigated separately, and the number of tail residues sitting in the groove, Nr, varied from 6 to 16. In each case residues 1 to Nr were allowed to shift along the groove curve without any conformational change, and all other residues of the tail were flexible; that is, their conformations could be any from the rotamer library.
The search determined the best fit of the calculated and observed electron density maps. Because of the huge search space, the genetic algorithm was applied to these searches. The best models obtained for each of the 11 cases were tested with energy minimization by using cns software (20). Nine consecutive PapA molecules placed with the known helical symmetry from the cryoEM map were included in the energy minimization. This ensured that any possible intramolecular and intermolecular interaction was covered.
Supplementary Material
Acknowledgments
We thank Dr. Edward Egelman and Dr. David Morgan for many helpful discussions on image processing and Dr. Donna Cabral-Lilly, Dr. John M. Lyle, Dr. Jean-François Ménetrét, and Rachel Scherer for scientific discussions. This work was supported by National Institutes of Health Grant GM055722 (to E.B.), the Boston University School of Medicine, and the supercomputer facilities of the Boston University Scientific Computing and Visualization Group.
Abbreviations
- cryoEM
electron cryomicroscopy
- IHRSR
iterative helical real space reconstruction.
Footnotes
Conflict of interest statement: No conflicts declared.
This paper was submitted directly (Track II) to the PNAS office.
References
- 1.Smith H. W., Halls S. J. Med. Microbiol. 1968;1:45–59. doi: 10.1099/00222615-1-1-45. [DOI] [PubMed] [Google Scholar]
- 2.Smith H. W., Linggood M. A. J. Med. Microbiol. 1971;4:467–485. doi: 10.1099/00222615-4-4-467. [DOI] [PubMed] [Google Scholar]
- 3.Roberts J. A., Marklund B. I., Ilver D., Haslam D., Kaack M. B., Baskin G., Louis M., Mollby R., Winberg J., Normark S. Proc. Natl. Acad. Sci. USA. 1994;91:11889–11893. doi: 10.1073/pnas.91.25.11889. [DOI] [PMC free article] [PubMed] [Google Scholar]
- 4.Hultgren S. J., Normark S., Abraham S. N. Annu. Rev. Microbiol. 1991;45:383–415. doi: 10.1146/annurev.mi.45.100191.002123. [DOI] [PubMed] [Google Scholar]
- 5.Brinton C. C., Jr. Trans. N.Y. Acad. Sci. 1965;27:1003–1165. doi: 10.1111/j.2164-0947.1965.tb02342.x. [DOI] [PubMed] [Google Scholar]
- 6.Bullitt E., Makowski L. Nature. 1995;373:164–167. doi: 10.1038/373164a0. [DOI] [PubMed] [Google Scholar]
- 7.St Geme J. W., Pinkner J. S., III, Krasan G. P., Heuser J., Bullitt E., Smith A. L., Hultgren S. J. Proc. Natl. Acad. Sci. USA. 1996;93:11913–11918. doi: 10.1073/pnas.93.21.11913. [DOI] [PMC free article] [PubMed] [Google Scholar]
- 8.Marklund B. I., Tennent J. M., Garcia E., Hamers A., Baga M., Lindberg F., Gaastra W., Normark S. Mol. Microbiol. 1992;6:2225–2242. doi: 10.1111/j.1365-2958.1992.tb01399.x. [DOI] [PubMed] [Google Scholar]
- 9.Normark S., Lark D., Hull R., Norgren M., Baga M., O’Hanley P., Schoolnik G., Falkow S. Infect. Immun. 1983;41:942–949. doi: 10.1128/iai.41.3.942-949.1983. [DOI] [PMC free article] [PubMed] [Google Scholar]
- 10.Lindberg F., Lund B., Normark S. Proc. Natl. Acad. Sci. USA. 1986;83:1891–1895. doi: 10.1073/pnas.83.6.1891. [DOI] [PMC free article] [PubMed] [Google Scholar]
- 11.Denich K., Blyn L. B., Craiu A., Braaten B. A., Hardy J., Low D. A., O’Hanley P. D. Infect. Immun. 1991;59:3849–3858. doi: 10.1128/iai.59.11.3849-3858.1991. [DOI] [PMC free article] [PubMed] [Google Scholar]
- 12.Baga M., Normark S., Hardy J., O’Hanley P., Lark D., Olsson O., Schoolnik G., Falkow S. J. Bacteriol. 1984;157:330–333. doi: 10.1128/jb.157.1.330-333.1984. [DOI] [PMC free article] [PubMed] [Google Scholar]
- 13.Choudhury D., Thompson A., Stojanoff V., Langermann S., Pinkner J., Hultgren S. J., Knight S. D. Science. 1999;285:1061–1066. doi: 10.1126/science.285.5430.1061. [DOI] [PubMed] [Google Scholar]
- 14.Sauer F., Fütterer K., Pinkner J. S., Dodson K., Hultgren S. J., Waksman G. Science. 1999;285:1058–1061. doi: 10.1126/science.285.5430.1058. [DOI] [PubMed] [Google Scholar]
- 15.Sauer F. G., Pinkner J. S., Waksman G., Hultgren S. J. Cell. 2002;111:543–551. doi: 10.1016/s0092-8674(02)01050-4. [DOI] [PubMed] [Google Scholar]
- 16.Sambashivan S., Liu Y., Sawaya M. R., Gingery M., Eisenberg D. Nature. 2005;437:266–269. doi: 10.1038/nature03916. [DOI] [PubMed] [Google Scholar]
- 17.Rossmann M. G., Morais M. C., Leiman P. G., Zhang W. Structure (London) 2005;13:355–362. doi: 10.1016/j.str.2005.01.005. [DOI] [PMC free article] [PubMed] [Google Scholar]
- 18.Egelman E. H. Ultramicroscopy. 2000;85:225–234. doi: 10.1016/s0304-3991(00)00062-0. [DOI] [PubMed] [Google Scholar]
- 19.Sali A., Potterton L., Yuan F., van Vlijmen H., Karplus M. Proteins. 1995;23:318–326. doi: 10.1002/prot.340230306. [DOI] [PubMed] [Google Scholar]
- 20.Brunger A. T., Adams P. D., Clore G. M., DeLano W. L., Gros P., Grosse-Kunstleve R. W., Jiang J. S., Kuszewski J., Nilges M., Pannu N. S., et al. Acta Crystallogr. D. 1998;54:905–921. doi: 10.1107/s0907444998003254. [DOI] [PubMed] [Google Scholar]
- 21.Steidler L., Remaut E., Fiers W. J. Bacteriol. 1993;175:7639–7643. doi: 10.1128/jb.175.23.7639-7643.1993. [DOI] [PMC free article] [PubMed] [Google Scholar]
- 22.Schmidt M. A., O’Hanley P., Lark D., Schoolnik G. K. Proc. Natl. Acad. Sci. USA. 1988;85:1247–1251. doi: 10.1073/pnas.85.4.1247. [DOI] [PMC free article] [PubMed] [Google Scholar]
- 23.Bullitt E., Jones C. H., Striker R., Soto G., Jacob-Dubuisson F., Pinkner J., Wick M. J., Makowski L., Hultgren S. J. Proc. Natl. Acad. Sci. USA. 1996;93:12890–12895. doi: 10.1073/pnas.93.23.12890. [DOI] [PMC free article] [PubMed] [Google Scholar]
- 24.Soto G. E., Dodson K. W., Ogg D., Liu C., Heuser J., Knight S., Kihlberg J., Jones C. H., Hultgren S. J. EMBO J. 1998;17:6155–6167. doi: 10.1093/emboj/17.21.6155. [DOI] [PMC free article] [PubMed] [Google Scholar]
- 25.Mu X. Q., Jiang Z. G., Bullitt E. J. Mol. Biol. 2005;346:13–20. doi: 10.1016/j.jmb.2004.11.037. [DOI] [PubMed] [Google Scholar]
- 26.Jacob-Dubuisson F., Heuser J., Dodson K., Normark S., Hultgren S. EMBO J. 1993;12:837–847. doi: 10.1002/j.1460-2075.1993.tb05724.x. [DOI] [PMC free article] [PubMed] [Google Scholar]
- 27.Gong M., Makowski L. J. Mol. Biol. 1992;228:735–742. doi: 10.1016/0022-2836(92)90860-m. [DOI] [PubMed] [Google Scholar]
- 28.Dunbrack R. L., Jr., Karplus M. J. Mol. Biol. 1993;230:543–574. doi: 10.1006/jmbi.1993.1170. [DOI] [PubMed] [Google Scholar]
- 29.Eisenhaber F., Lijnzaad P., Sander C., Scharf M. J. Comput. Chem. 1995;16:273–284. [Google Scholar]
- 30.Gao D. Y., Blessing R. H., Langs D. A., Smith G. D. Acta Crystallogr. D. 1999;55:230–237. doi: 10.1107/S0907444998008208. [DOI] [PubMed] [Google Scholar]
- 31.Levitt M. J. Mol. Biol. 1976;104:59–107. doi: 10.1016/0022-2836(76)90004-8. [DOI] [PubMed] [Google Scholar]
- 32.Frank J., Radermacher M., Penczek P., Zhu J., Li Y., Ladjadj M., Leith A. J. Struct. Biol. 1996;116:190–199. doi: 10.1006/jsbi.1996.0030. [DOI] [PubMed] [Google Scholar]
Associated Data
This section collects any data citations, data availability statements, or supplementary materials included in this article.