Abstract
The phototropins are flavoprotein kinases that control phototropic bending, light-induced chloroplast movement, and stomatal opening in plants. Two flavin mononucleotide binding light, oxygen, or voltage (LOV) domains are the sites for initial photochemistry in these blue light photoreceptors. We have determined the steady state, photoexcited crystal structure of a flavin-bound LOV domain. The structure reveals a unique photochemical switch in the flavin binding pocket in which the absorption of light drives the formation of a reversible covalent bond between a highly conserved Cys residue and the flavin cofactor. This provides a molecular picture of a cysteinyl-flavin covalent adduct, the presumed signaling species that leads to phototropin kinase activation and subsequent signal transduction. We identify closely related LOV domains in two eubacterial proteins that suggests the light-induced conformational change evident in this structure is an ancient biomolecular response to light, arising before the appearance of plants.
INTRODUCTION
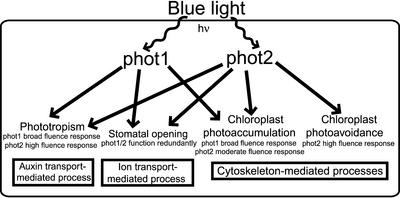
At least nine photoreceptors that control plant growth and development have been identified in Arabidopsis (Arabidopsis Genome Initiative, 2000), and many genetic and biochemical interactions between these photoreceptors and their downstream signaling partners have been established (reviewed by Singhal et al., 1999). However, the question of how a light signal is transduced by plant photoreceptors at the structural level remains unexplored. Light, oxygen, or voltage (LOV) domains, a subset of the Per-ARNT-Sim (PAS) domain superfamily (Lagarias et al., 1995; Taylor and Zhulin, 1999), bind a single molecule of flavin mononucleotide (FMN) (Christie et al., 1999) and function as sites for blue light absorption and initial photochemistry in the phototropin family of photoreceptors (phot1 and phot2) (Huala et al., 1997; Christie et al., 1998). The phototropins are Ser/Thr kinases that contain two N-terminal LOV domains (LOV1 and LOV2) (Huala et al., 1997), autophosphorylate in response to the absorption of blue light (Christie et al., 1998), and control phototropism, light-induced chloroplast movement, and stomatal opening (Huala et al., 1997; Christie et al., 1998; Jarillo et al., 2001; Kagawa et al., 2001; Kinoshita et al., 2001). The highly homologous phot1 and phot2 photoreceptors exhibit fluence-dependent functional overlap in controlling these physiologically distinct processes (Sakai et al., 2001), as shown in Figure 1.
Figure 1.
Scheme of the Cellular Processes Affected by phot1 and phot2 and Their Fluence Dependence.
The phot1 protein functions as a photoreceptor for phototropism and chloroplast photoaccumulation under a broad fluence range. phot2 functions as a photoreceptor for chloroplast photoaccumulation at moderate fluences and photoavoidance at high fluences. In addition, phot2 can function as a photoreceptor for phototropism under high fluence. Both phot1 and phot2 function as redundant photoreceptors that control stomatal opening. The initial photochemical step of cysteinyl-flavin adduct formation is identical in both of these plant blue light photoreceptors. The energy of a blue-light photon is designated hν.
Classic experiments by Briggs and colleagues (1957) demonstrated that phototropism is a direct result of lateral auxin transport away from the source of light. Chloroplast movement is mediated by microtubules and microfilaments of the cytoskeleton (Sato et al., 2001), and stomatal opening is controlled by the activation of a membrane-bound H+-ATPase and subsequent transport of K+ into the guard cells (Schroeder et al., 2001). Thus, phot1 and phot2 affect at least three distinct cellular processes: auxin transport, cytoskeleton-mediated organelle motility, and ion transport. However, the initial photochemical event governing phot1 and phot2 control over each of these processes is identical. Optical and NMR spectroscopic studies of photoexcited phot1 LOV domains in solution suggest that a covalent adduct forms between a Cys and FMN C(4a) in response to light absorption (Salomon et al., 2000, 2001; Swartz et al., 2001). Moreover, mutational analysis of phot1 LOV domains has shown that absorption of light by LOV2 alone is necessary and sufficient for C-terminal kinase activation and phototropic bending; LOV1 photoactivity can be dispensed with (W. Briggs and J. Christie, personal communication). We have studied the effects of a light stimulus on the molecular structure of a LOV2 domain and present a molecular model for how light absorption translates into structural change in a plant photoreceptor.
RESULTS
LOV2 Crystal Microspectrophotometry
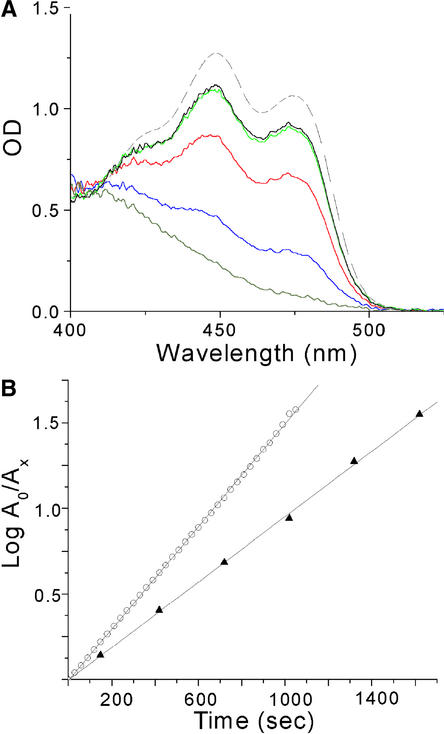
Crystals of LOV2 from maidenhair fern phy3, a chimeric phytochrome/phototropin (Nozue et al., 1998), were used for all experiments. This LOV2 construct was chosen because it produced the highest protein yield and purity compared with other phototropin LOV constructs from Arabidopsis and oat. Before determining the photoexcited structure of LOV2, we conducted spectroscopic studies of single crystals to determine how the spectral and kinetic properties of LOV2 are affected by crystallization. Figure 2A shows that the ground-state absorption spectrum of monoclinic LOV2 crystals is blue shifted by 2 nm relative to that in dilute solution. LOV2 molecules in both crystals and dilute solution undergo a fully reversible photocycle with a spectral crossover point at ∼405 nm. Thus, as in solution, the crystal spectral data are consistent with cysteinyl-C4(a) adduct formation, not with simple photoreduction.
Figure 2.
Absorption Spectra and the Photocycle of phy3 LOV2 in the Crystal and in Solution.
(A) Dark-state absorption spectra of phy3 LOV2 in single monoclinic crystals (solid black line) and solution (dashed line) normalized at 411 nm. Actinism of the monitoring light source contributes to a crystal dark-state spectrum containing a small percentage of photoproduct. Decay from the fully bleached spectrum of phy3 LOV2 (gray) is shown at 4 min (blue), 15 min (red), and 40 min (green).
(B) Recovery of the dark state from the photoexcited steady state in solution (open circles) and in the crystal (closed triangles) monitored at 473 nm. A0 represents the amount of the nonadduct form of LOV2 at time 0, and Ax represents the amount at time x. The linearity of the plots indicates single exponential behavior with decay rates of 0.003 sec−1 in solution and 0.002 sec−1 in the crystal. This kinetic difference corresponds to a difference in the free energy of activation of 0.24 kcal/mol between LOV2 decay in the crystal and in solution.
Decay from a photoexcited steady state occurs via a single exponential process with closely similar rates in the crystal and solution, as shown in Figure 2B. Single exponential decay indicates that all four monomers in the crystallographic asymmetric unit (see Methods) exhibit identical kinetic behavior despite their different crystal environments and that crystallization does not affect kinetic behavior significantly. To characterize the structural basis of these light-driven changes, we determined the steady state, photoexcited crystal structure of LOV2.
Light-Driven Adduct Formation
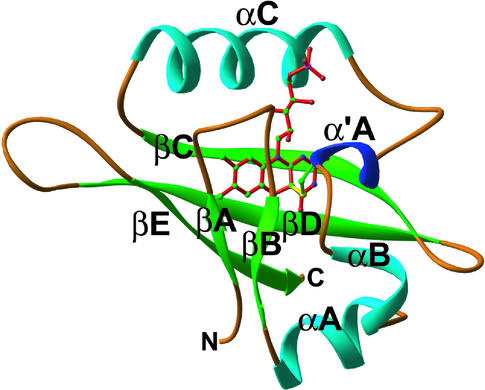
The crystal structure of photoexcited phy3 LOV2 was determined to 2.6 Å resolution by molecular replacement using the dark-state phy3 LOV2 structure (Crosson and Moffat, 2001) as a starting model. Crystallographic data and refinement statistics are summarized in Table 1. A rare single crystal of space group P1, containing four monomers per asymmetric unit, was used for structure determination. This triclinic crystal is closely related to the triclinic crystal used for dark-state structure determination, although the unit cell constants differ slightly between the two. A complete description of all of the crystal forms used for these studies is detailed in Methods. Photoexcited data were collected at room temperature to avoid “freezing out” the conformational transitions whose nature is the goal of this study and to avoid the possible formation of off-pathway structural intermediates (Moffat, 2001). Figure 3 shows the overall fold of phy3 LOV2 in the photoexcited state.
Table 1.
Summary of Crystallographic Data and Refinement Statistics
| Crystallographic data | |
|---|---|
| Space Group | P1 |
| Unique reflections | 17700 to 2.6 Å |
| I/σ(I) (highest shell) | 12.4 (3.2) |
| Rmergea (%) (highest shell) | 4.4 (19.0) |
| Completeness (%) (highest shell) | 87.5 (79.0) |
| Overall redundancy | 1.6 |
| Test set | 1295 |
| Resolution (Å) (highest shell) | 30.0 to 2.6 (2.69 to 2.60) |
| Refinement statistics | |
| Rcrystb | 23.8 |
| Rfreec | 25.9 |
| <B> (Å2)d | 32.7 |
| rmsde bond lengths (Å2) | 0.010 |
| rmsde bond angles (°) | 1.36 |
a Rmerge = ΣhklΣi |Ii − <I>| / ΣhklΣiII; for all data, I/σ(I) > −3, where hkl are coordinates in reciprocal space, <I> is the mean reflection intensity, and Ii is the intensity of the ith observation of the reflection hkl. σ(I) is the standard deviation of the mean intensity.
b Rcryst = Σhkl ||Fobs − Fcalc|| / Σhkl |Fobs|, includes all data.
c Rfree uses 7.3% of the data for the test set. The test set was selected using thin, randomly chosen resolution shells to remove noncrystallographic symmetry relationships between reflections.
d <B> (Å2) is defined as the mean crystallographic temperature factor.
e rmsd, root-mean-square deviation.
Figure 3.
Structure of Photoexcited phy3 LOV2.
Ribbon diagram of the phy3 LOV2 structure under steady state illumination. The FMN cofactor is shown in the center of the fold with the bonds colored red. The sulfur of the conserved LOV Cys residue is pictured attached covalently to carbon 4a of FMN with a yellow adduct bond. Atoms of the Cys side chain and FMN are colored by elements: carbon, green; nitrogen, blue; phosphorus, pink, sulfur, yellow; and oxygen, red. The image was generated in Ribbons (Carson, 1997). Compare with Figure 1B from Crosson and Moffat (2001).
Examination of the FMN binding pocket of photoexcited LOV2 reveals a unique, reversible photochemical switch in which the absorption of light leads to the formation of a new covalent adduct between a single Cys and the 4a carbon of FMN. Initial examination of the photoexcited structure showed clear electron density between the sulfur atom of the conserved Cys (residue 966 in phy3 LOV2) and C(4a) of FMN in all four monomers of the asymmetric unit, which suggested the presence of a covalent bond between these two atoms. Interestingly, cysteinyl-flavin C(4a) adducts also have been identified as transient intermediates in disulfide reductase flavoenzymes (Miller et al., 1990). However, the chemistry of adduct formation differs in these flavoproteins: a cysteinyl-flavin C(4a) adduct forms when the flavin reduces a disulfide bond with electrons derived from pyridine nucleotide in a light-independent manner.
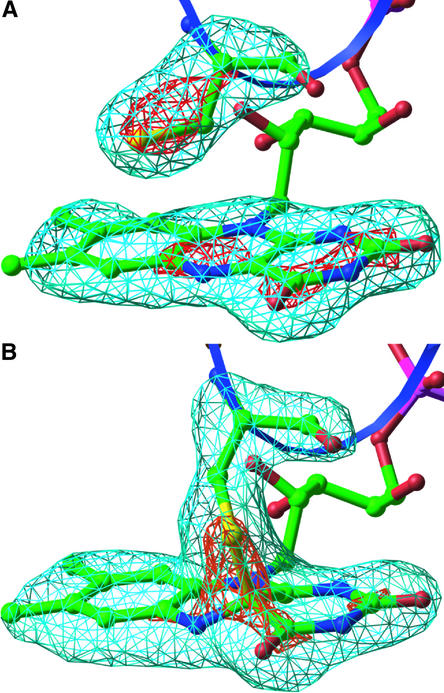
Because there are no known structures of a cysteinyl-flavin C(4a) adduct, the isoalloxazine ring from a small molecule crystal structure of a flavin-isopropyl C(4a) adduct (Bolognesi et al., 1978) was used as a starting model for the refinement of photoexcited LOV2. Multiple rounds of refinement beginning with various bond distances and angles and corresponding bond energy terms all converged to a Sγ-C(4a) covalent bond distance of 1.8 Å and a Cβ-Sγ-C(4a) angle of 113°; the geometry of FMN C(4a) was refined as tetrahedral. The cross-validated residual factor (Rfree) of 25.9% and the absence of significant features in a final Fobs − Fcalc difference (where Fobs and Fcalc are the observed and calculated structure amplitudes, respectively) electron density map of the chromophore region suggest that this single structural model accounts satisfactorily for the diffraction data at 2.6 Å resolution. Figure 4A shows the lack of electron density between the single LOV2 Cys and the flavin ring in the dark, and the electron density shown in Figure 4B indicates the formation of a cysteinyl-flavin c(4a) adduct upon light absorption.
Figure 4.
Light-Driven Cysteinyl-Flavin Adduct Formation in LOV2.
Fourfold noncrystallographic symmetry–averaged omit maps of FMN and Cys-966 were calculated from the dark state (Crosson and Moffat, 2001) (A) and the photoexcited state (B) of phy3 LOV2. Maps are contoured at ±5σ and ±9σ, in which σ is the root-mean-square value of the electron density. The blue ribbon represents the 310 helix that contains the Cys. Atom colors are as in Figure 3. The images were generated in Ribbons (Carson, 1997).
Conformational Change in the Flavin Pocket
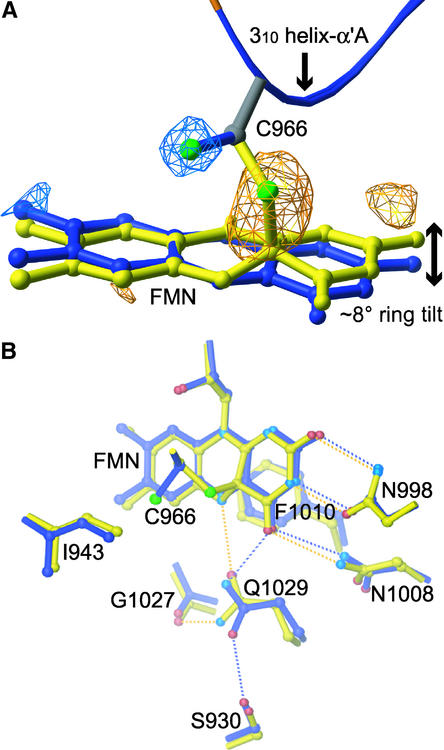
A least-squares superposition (Kabsch, 1976) of phy3 LOV2 in the dark and photoexcited states was conducted to determine which residues exhibit significant motion in response to adduct formation. The average atomic displacement between the dark and photoexcited structures was 0.29 Å (sd = 0.20 Å). Displacements exceeding two sd units (0.69 Å) were deemed significant. This analysis revealed that significant atomic displacements are confined completely to the FMN and to certain side chains in the flavin binding pocket. No atoms in the polypeptide backbone exhibit significant motion. Figure 5A shows that an ∼8° tilt of the FMN isoalloxazine ring occurs, and rotation of the Cys side chain by 100° around the Cα-Cβ bond displaces the Cys sulfur by 2.3 Å and brings it within covalent bonding distance of C(4a).
Figure 5.
Conformational Change in the FMN Binding Pocket of Photoexcited LOV2.
(A) Fourfold noncrystallographic symmetry–averaged light-minus-dark difference Fourier map contoured at ±4σ, in which σ is the root-mean-square value of the electron density. Photoactive Cys and the flavin ring for the dark (blue) and photoexcited (yellow) structures are shown. Negative difference density (blue) and positive density (yellow) indicate Cys and ring motion upon photoexcitation.
(B) Side chains exhibiting significant displacements between the dark (blue) and photoexcited (yellow) structures in response to cysteinyl-flavin C(4a) adduct formation. Hydrogen bonds between the protein and FMN cofactor in the dark and photoexcited structures are indicated by blue and yellow dotted lines, respectively. A 2.6 to 3.5 Å range for hydrogen bonding was used. Atoms are colored by elements: nitrogen, light blue; sulfur, green; and oxygen, red. Atoms colored blue in the dark structure and yellow in the photoexcited structure are carbon.
Three side chains (N1008, Q1029, and F1010) that form hydrogen bonds or van der Waals contacts with the FMN ring in the dark-state structure move in the photoexcited state to maintain their contacts with the flavin isoalloxazine moiety, as shown in Figure 5B. The side chain of I943 shifts toward the hole left by the Cys sulfur, and Q970 adjusts to the displacement of the ribityl side chain (data not shown). Hydrogen bonds and van der Waals contacts between the protein and FMN are maintained in the photoexcited structure for all residues except Q1029. It appears that the hydrogen bond present between the side chain amine and atom O4 of FMN in the dark-state structure is broken in the photoexcited state, and a hydrogen bond forms between the side chain carbonyl oxygen and the newly protonated N5 atom of FMN. Concomitantly, the hydrogen bond present in the dark state between the carbonyl oxygen of Q1029 and the hydroxyl of S930 is broken, and a new hydrogen bond between the amine and the backbone carbonyl of G1027 is formed (Figure 5B).
Higher resolution data are necessary to confirm the details of this light-driven change in hydrogen bonding pattern. Unexpectedly, the two water molecules present in the flavin binding pocket of the dark-state structure and the 310 helix, of which the conserved Cys is part, are unaltered in the photoexcited state. The absence of significant structural change in any molecular surface of LOV2 suggests that when LOV2 relays a light-driven signal to the phototropin kinase domain, it does so not directly through a conformational change at its molecular surface but through a change in the dynamic properties of the protein upon covalent linkage of the polypeptide to FMN, as discussed below.
A Conserved Biomolecular Response to Light
Nonphototropin proteins involved in the regulation of circadian rhythm, including ZTL and FKF1 from Arabidopsis and Wc-1 from Neurospora, have been predicted previously to contain highly conserved, single flavin binding LOV domains (Crosson and Moffat, 2001). Using the flavin-interacting motif as a search element, a BLAST search (Altschul et al., 1997) against GenBank identified three additional proteins that contain single LOV domains in which all 11 flavin-interacting residues, including the photoactive Cys, are conserved. The first of these proteins, VVD, has been shown to regulate circadian rhythm in the fungus Neurospora (Heintzen et al., 2001).
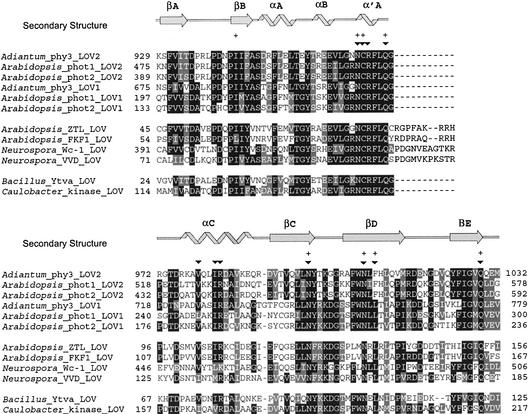
The other two proteins are from prokaryotes and include a putative sensor His kinase from the recently sequenced Caulobacter genome (Nierman et al., 2001) and Bacillus YtvA, which functions as a positive regulator of the general stress transcription factor σB (Akbar et al., 2001). Figure 6 provides an alignment of LOV domains from Arabidopsis phot1 and phot2 and maidenhair fern phy3 with the Arabidopsis and Neurospora proteins that regulate circadian rhythm and the two prokaryotic LOV domains. Although only phototropin LOV domains have been proven to bind FMN, the conservation of the flavin binding motif and Cys in these other LOV domains suggests that they also bind flavin and exhibit the same photochemistry and structural rearrangement seen in the photoexcited phy3 LOV2 structure.
Figure 6.
Alignment of LOV Domains with Known and Predicted Photoactivity.
Phototropin and phy3 LOV domains with known photoactivity include Arabidopsis phot1 and phot2 and maidenhair fern (Adiantum) phy3. LOV domains from proteins that regulate circadian rhythm include Arabidopsis ZTL and FKF1 and Neurospora Wc-1 and VVD. Sequences for two eubacterial proteins containing a LOV domain with a flavin binding motif and conserved Cys also are shown: Bacillus YtvA and a putative sensor kinase from Caulobacter. Flavin-interacting residues are marked above the sequences (inverted triangles), as are residues whose side chains exhibit significant motion upon photoexcitation (+). Identical (black) and similar (gray) residues are highlighted at a 50% cutoff. The secondary structure of LOV2 is marked above the alignment: β-strand (arrows) and helix (helices).
DISCUSSION
We have shown how the absorption of light by the LOV2 plant photoreceptor domain results in pronounced changes in the structure of the protein. Specifically, a light-driven covalent bond forms between the single Cys residue of phy3 LOV2 and the 4a carbon of FMN, resulting in structural rearrangements on and around the flavin ring. The changes seen in the photoexcited crystal structure appear to be limited to the FMN binding pocket, with the most significant molecular motion occurring at the photoactive Cys. NMR studies of a fusion protein containing oat phot1 LOV2 have shown chemical shift differences in the dark and photoexcited states between the FMN phosphate, ribityl carbons, and backbone amide protons (Salomon et al., 2001). The crystallographic data presented here suggest that these changes in chemical shift are not accompanied by large structural changes in the polypeptide backbone. Indeed, the structure and the structural changes are consistent in all four monomers of the crystallographic asymmetric unit, even though they are subject to different crystal packing environments. These data provide strong evidence that crystallization does not greatly perturb structural changes during the photocycle.
Comparison of the dark and photoexcited LOV2 structures verifies that only small protein movement is necessary to form the cysteinyl-flavin adduct. We argue that the dynamics of LOV2 are affected by adduct formation and that this change in protein dynamics affects subsequent kinase activation and signal transduction. Covalent linkage of the polypeptide to the chromophore in the photoexcited state must change the dynamics of the protein, for example, by reducing conformational flexibility in the region of Cys attachment to the flavin chromophore and decreasing the entropy of its segment of the polypeptide chain. In a signal transduction model based on a change in protein dynamics, the affinity between LOV2 and an intramolecular signaling partner (e.g., kinase or LOV1 domains) or an intermolecular partner such as NPH3 (Motchoulski and Liscum, 1999) is dominated by entropic effects.
This differs from an enthalpic model of domain recognition and interaction, in which changes in the positions of atoms affect the affinity between signaling partners. Thermodynamically, the end result of a change in either enthalpic or entropic effects can be the same: the promotion or disruption of intermolecular and intramolecular interactions in signaling systems. The recent proposal that the molecular dynamics of regulatory domains might affect kinase activity at a distant site (Young et al., 2001) suggests that changes in the dynamics of signaling molecules upon interaction with light, small molecular ligands, or other biomolecules may play an important role in signal transduction.
The photochemistry displayed by LOV2 in this crystal structure is predicted to extend beyond phototropin and phy3 to include plant and fungal proteins that regulate circadian rhythm and eubacterial proteins of varied function. Although none of the domains listed in the alignment shown in Figure 6 have been shown explicitly to bind flavin, Bacillus YtvA is a putative flavoprotein that exhibits a flavin-like spectrum when overexpressed in Escherichia coli (Akbar et al., 2001). The presence of these domains in at least two different eubacterial proteins suggests that the photochemistry evident in phototropin and phy3 LOV domains is not a eukaryotic adaptation. Although evolution of this photochemistry through convergence in plants, fungi, and eubacteria cannot be excluded, it appears that light-driven, cysteinyl-flavin adduct formation may have appeared first in the prokaryotes. Thus, the photochemistry and subsequent structural changes evident in this FMN binding LOV domain could be an ancient, evolutionarily conserved response to light that has been adapted for use by disparate systems.
METHODS
Protein Expression and Purification
A construct containing an N-terminal calmodulin binding peptide (Christie et al., 1999) and spanning residues 924 to 1051 of phy3 LOV2 from maidenhair fern (Adiantum capillus-veneris) was expressed in Escherichia coli BL21(DE3) pLysS cells. Twelve liters of cells was grown at 37°C to an OD600 of 0.4 as measured on a Shimadzu UV160U spectrophotometer (1 cm path length; Kyoto, Japan). Cells were induced with 500 μM isopropylthio-β-galactoside and grown for an additional 4 hr at 27.5°C. After cell lysis, phy3 LOV2 was purified by affinity chromatography on a calmodulin column, and the fusion tag was cleaved with thrombin (Haemotologic Technologies, Essex Junction, VT). Anion-exchange chromatography with high-performance Sepharose Q (Amersham Pharmacia) was used to separate thrombin, uncleaved protein, and calmodulin binding peptide from LOV2. Cleaved protein was concentrated to 15 mg/mL in a high-pressure stirred ultrafiltration cell with a 3000 molecular weight cutoff filter (Amicon, Beverly, MA). On average, this preparation yielded ∼8 mg of pure protein.
LOV2 Crystallization
Three crystal forms of the phy3 LOV2 domain have been characterized. The crystal form used for dark-state data collection (Crosson and Moffat, 2001) was grown at 20°C from 24% polyethylene glycol (PEG 5000) monomethyl ether, 12% glycerol, and 50 mM Tris, pH 8.0, in triclinic space group P1 with cell dimensions a = 44.9, b = 54.1, and c = 70.6 Å (α = 93.3, β = 94.0, and γ = 90.0°); the crystal form used for photoexcited-state data collection was grown at 25°C from 22% PEG 5000 monomethyl ether, 12% glycerol, and 50 mM Tris, pH 8.0, also in triclinic space group P1 with slightly different unit cell dimensions in the photoexcited state of a = 44.8, b = 54.8, and c = 70.9 Å (α = 93.1, β = 93.8, and γ = 90.4°); the third crystal form used for microspectrophotometry was grown at 25°C from 24% PEG 5000 monomethyl ether, 12% glycerol, and 50 mM Tris, pH 8.0, in the monoclinic space group P21 with cell dimensions a = 70.1, b = 70.2, and c = 74.3 Å (β = 109.15°). All three crystal forms have four LOV2 monomers in the asymmetric unit, but the monoclinic form exhibits different packing of LOV2 monomers than the two triclinic forms.
Crystal Microspectrophotometry
All crystal spectroscopic measurements were made on a single-beam microspectrophotometer (Chen et al., 1994). Thin, monoclinic crystals allowed the accurate measurement of optical density that was not readily possible with the thicker triclinic crystals used for crystal structure determination. To obtain the kinetics of decay from a photoexcited steady state, a single capillary-mounted monoclinic crystal (200 × 200 × 10 μm) was illuminated with 20 mW/mm2 polychromatic light from a xenon lamp until no further change was evident in the spectrum and allowed to decay in the dark at 23°C to the ground state. Solution recovery kinetics were measured on a Hewlett-Packard 8452A diode array spectrophotometer (Palo Alto, CA).
Structure Determination of the Photoexcited State
Diffraction data were collected from a single triclinic crystal at 23°C with the crystal under continuous illumination by 20 mW/mm2 polychromatic light delivered via fiber optics from a xenon lamp. Diffraction initially extended beyond 1.8 Å but had decayed to 3.0 Å after 180° of data collection, resulting in a final resolution of 2.6 Å. The data were processed and scaled with DENZO/SCALEPACK (Otwinowski and Minor, 1997). Molecular replacement with the dark-state LOV2 structure (Protein Data Bank Code 1G28) as a starting model was conducted using the computer program EPMR (Kissinger et al., 1999) and gave an initial crystallographic residual factor (Rcryst) of 35% with four monomers in the asymmetric unit. Rigid body, positional, and simulated annealing refinement in the computer program CNS (Brünger et al., 1998) and the addition of 65 water molecules resulted in a cross-validated residual factor (Rfree) of 27.3%. Translation-libration-screw refinement in Refmac5 (Winn et al., 2001) was used to model anisotropic displacements between noncrystallographic symmetry–related proteins in the asymmetric unit and resulted in a further decrease in Rfree to 25.9%.
Fourfold noncrystallographic symmetry averaging for the calculation of flavin/Cys omit maps and light-minus-dark difference maps was conducted using the CCP4 program DM (Bailey, 1994). As a control, the steady state photoexcited structure of the monoclinic crystal form also was solved and refined against 3.1 Å data to an Rfree of 28.5%. This crystal form showed the same adduct features as the photoexcited triclinic form, which provides further evidence that the crystal environment does not affect the photocycle significantly. All data were collected on an ADSC Quantum4 charge-coupled device detector using 1.0 Å radiation at beamline 14-BM-C (BioCARS-CAT; Advanced Photon Source, Argonne National Laboratory, Argonne, IL).
BLAST Search
LOV2 from maidenhair fern phy3 was used as a BLAST search element to identify other Per-ARNT-Sim/LOV domains (cutoff at <e−5). Domains containing all 11 flavin-interacting residues then were identified manually.
Accession Number
The Protein Data Bank accession number for LOV2 is 1JNU. Accession numbers for the sequences shown in Figure 6 are AAC01753 (Arabidopsis phot1), AAC27293 (Arabidopsis phot2), BAA36192 (maidenhair fern phy3), AAF70288 (Arabidopsis ZTL), AAF32298 (Arabidopsis FKF1), Q01371 (Neurospora Wc-1), AF338412 (Neurospora VVD), A70002 (Bacillus YtvA), and AAK22272 (a putative sensor kinase from Caulobacter).
Acknowledgments
We thank Daphne Preuss and Carl Correll for critical comments on the manuscript, Vukica Šrajer and Reinhard Pahl for beamline and microspectrophotometer support, Zhong Ren and Xiaojing Yang for assistance with data processing, Tobin Sosnick for equipment use, and Vincent Massey for helpful references. LOV constructs were generously provided by John Christie and Winslow Briggs. This work was supported by National Institutes of Health Grant GM36452 to K.M. and a National Science Foundation graduate fellowship to S.C. The BioCARS research resource at the Advanced Photon Source, Argonne National Laboratory, is supported by National Institutes of Health Grant RR07707 to K.M.
Article, publication date, and citation information can be found at www.plantcell.org/cgi/doi/10.1105/tpc.010475.
References
- Akbar, S., Gaidenko, T.A., Kang, C.M., O'Reilly, M., Devine, K.M., and Price, C.W. (2001). New family of regulators in the environmental signaling pathway which activates the general stress transcription factor σ(B) of Bacillus subtilis. J. Bacteriol. 183, 1329–1338. [DOI] [PMC free article] [PubMed] [Google Scholar]
- Altschul, S.F., Madden, T.L., Schaffer, A.A., Zhang, J., Zhang, Z., Miller, W., and Lipman, D.J. (1997). Gapped BLAST and PSI-BLAST: A new generation of protein database search programs. Nucleic Acids Res. 25, 3389–3402. [DOI] [PMC free article] [PubMed] [Google Scholar]
- Arabidopsis Genome Initiative. (2000). Analysis of the genome sequence of the flowering plant Arabidopsis thaliana. Nature 408, 796–815. [DOI] [PubMed] [Google Scholar]
- Bailey, S. (1994). The CCP4 suite: Programs for protein crystallography. Acta Crystallogr. D 50, 760–763. [DOI] [PubMed] [Google Scholar]
- Bolognesi, M., Ghisla, S., and Incoccia, L. (1978). Crystal and molecular structure of 2 models of catalytic flavo(co)enzyme intermediates. Acta Crystallogr. B 34, 821–828. [Google Scholar]
- Briggs, W.R., Toucher, R.D., and Wilson, J.F. (1957). Phototropic auxin redistribution in corn coleoptiles. Science 126, 210–212. [DOI] [PubMed] [Google Scholar]
- Brünger, A.T., et al. (1998). Crystallography & NMR system: A new software suite for macromolecular structure determination. Acta Crystallogr. D 54, 905–921. [DOI] [PubMed] [Google Scholar]
- Carson, M. (1997). Ribbons. Methods Enzymol. 277, 493–505. [PubMed] [Google Scholar]
- Chen, Y., Šrajer, V., Ng, K., Legrand, A., and Moffat, K. (1994). Optical monitoring of protein crystals in time-resolved x-ray experiments: Microspectrophotometer design and performance. Rev. Sci. Inst. 65, 1506–1511. [Google Scholar]
- Christie, J.M., Reymond, P., Powell, G.K., Bernasconi, P., Raibekas, A.A., Liscum, E., and Briggs, W.R. (1998). Arabidopsis NPH1: A flavoprotein with the properties of a photoreceptor for phototropism. Science 282, 1698–1701. [DOI] [PubMed] [Google Scholar]
- Christie, J.M., Salomon, M., Nozue, K., Wada, M., and Briggs, W.R. (1999). LOV (light, oxygen, or voltage) domains of the blue-light photoreceptor phototropin (nph1): Binding sites for the chromophore flavin mononucleotide. Proc. Natl. Acad. Sci. USA 96, 8779–8783. [DOI] [PMC free article] [PubMed] [Google Scholar]
- Crosson, S., and Moffat, K. (2001). Structure of a flavin-binding plant photoreceptor domain: Insights into light-mediated signal transduction. Proc. Natl. Acad. Sci. USA 98, 2995–3000. [DOI] [PMC free article] [PubMed] [Google Scholar]
- Heintzen, C., Loros, J.J., and Dunlap, J.C. (2001). The PAS protein VIVID defines a clock-associated feedback loop that represses light input, modulates gating, and regulates clock resetting. Cell 104, 453–464. [DOI] [PubMed] [Google Scholar]
- Huala, E., Oeller, P.W., Liscum, E., Han, I.-S., Larsen, E., and Briggs, W.R. (1997). Arabidopsis NPH1: A protein kinase with a putative redox-sensing domain. Science 278, 2120–2123. [DOI] [PubMed] [Google Scholar]
- Jarillo, J.A., Gabrys, H., Capel, J., Alonso, J.M., Ecker, J.R., and Cashmore, A.R. (2001). Phototropin-related NPL1 controls chloroplast relocation induced by blue light. Nature 410, 952–954. [DOI] [PubMed] [Google Scholar]
- Kabsch, W. (1976). Solution for best rotation to relate 2 sets of vectors. Acta Crystallogr. A 32, 922–923. [Google Scholar]
- Kagawa, T., Sakai, T., Suetsugu, N., Oikawa, K., Ishiguro, S., Kato, T., Tabata, S., Okada, K., and Wada, M. (2001). Arabidopsis NPL1: A phototropin homolog controlling the chloroplast high-light avoidance response. Science 291, 2138–2141. [DOI] [PubMed] [Google Scholar]
- Kinoshita, T., Doi, M., Suetsugu, N., Kagawa, T., Wada, M., and Shimazaki, K. (2001). phot1 and phot2 mediate blue light regulation of stomatal opening. Nature 414, 656–660. [DOI] [PubMed] [Google Scholar]
- Kissinger, C.R., Gehlhaar, D.K., and Fogel, D.B. (1999). Rapid automated molecular replacement by evolutionary search. Acta Crystallogr. D 55, 484–491. [DOI] [PubMed] [Google Scholar]
- Lagarias, D.M., Wu, S.-H., and Lagarias, J.C. (1995). Atypical phytochrome gene structure in the green alga Mesotaenium caldariorum. Plant Mol. Biol. 29, 1127–1142. [DOI] [PubMed] [Google Scholar]
- Miller, S.M., Massey, V., Ballou, D., Williams, C.H., Distefano, M.D., Moore, M.J., and Walsh, C.T. (1990). Use of a site-directed triple mutant to trap intermediates: Demonstration that the flavin C(4a)-thiol adduct and reduced flavin are kinetically competent intermediates in mercuric ion reductase. Biochemistry 29, 2831–2841. [DOI] [PubMed] [Google Scholar]
- Moffat, K. (2001). Time-resolved biochemical crystallography: A mechanistic perspective. Chem. Rev. 101, 1569–1581. [DOI] [PubMed] [Google Scholar]
- Motchoulski, A., and Liscum, E. (1999). Arabidopsis NPH3: A NPH1 photoreceptor-interacting protein essential for phototropism. Science 286, 961–964. [DOI] [PubMed] [Google Scholar]
- Nierman, W.C., et al. (2001). Complete genome sequence of Caulobacter crescentus. Proc. Natl. Acad. Sci. USA 98, 4136–4141. [DOI] [PMC free article] [PubMed] [Google Scholar]
- Nozue, K., Kanegae, T., Imaizumi, T., Fukuda, S., Okamoto, H., Yeh, K.C., Lagarias, J.C., and Wada, M. (1998). A phytochrome from the fern Adiantum with features of the putative photoreceptor NPH1. Proc. Natl. Acad. Sci. USA 95, 15826–15830. [DOI] [PMC free article] [PubMed] [Google Scholar]
- Otwinowski, Z., and Minor, W. (1997). Processing of X-ray diffraction data collected in oscillation mode. Methods Enzymol. 276, 307–326. [DOI] [PubMed] [Google Scholar]
- Sakai, T., Kagawa, T., Kasahara, M., Swartz, T.E., Christie, J.M., Briggs, W.R., Wada, M., and Okada, K. (2001). Arabidopsis nph1 and npl1: Blue light receptors that mediate both phototropism and chloroplast relocation. Proc. Natl. Acad. Sci. USA 98, 6969–6974. [DOI] [PMC free article] [PubMed] [Google Scholar]
- Salomon, M., Christie, J.M., Knieb, E., Lempert, U., and Briggs, W.R. (2000). Photochemical and mutational analysis of the FMN-binding domains of the plant blue light receptor, phototropin. Biochemistry 39, 9401–9410. [DOI] [PubMed] [Google Scholar]
- Salomon, M., Eisenreich, W., Durr, H., Schleicher, E., Knieb, E., Massey, V., Rudiger, W., Muller, F., Bacher, A., and Richter, G. (2001). An optomechanical transducer in the blue light receptor phototropin from Avena sativa. Proc. Natl. Acad. Sci. USA (online Oct. 16, 2001; 10.1073/pnas.221455298). [DOI] [PMC free article] [PubMed]
- Sato, Y., Wada, M., and Kadota, A. (2001). Choice of tracks, microtubules and/or actin filaments for chloroplast photo-movement is differentially controlled by phytochrome and a blue light receptor. J. Cell Sci. 114, 269–279. [DOI] [PubMed] [Google Scholar]
- Schroeder, J.I., Allen, G.J., Hugouvieux, V., Kwak, J.M., and Warner, D. (2001). Guard cell signal transduction. Annu. Rev. Plant Physiol. Plant Mol. Biol. 52, 627–658. [DOI] [PubMed] [Google Scholar]
- Singhal, G.S., Renger, G., Sopory, S.K., Irrgang, K.-D., and Govindjee (1999). Photoreceptors and functions. In Concepts in Photobiology: Photosynthesis and Photomorphogenesis. (Boston, MA: Kluwer Academic Publishers), pp. 775–929.
- Swartz, T.E., Corchnoy, S.B., Christie, J.M., Lewis, J.W., Szundi, I., Briggs, W.R., and Bogomolni, R.A. (2001). The photocycle of a flavin-binding domain of the blue light photoreceptor phototropin. J. Biol. Chem. 276, 36493–36500. [DOI] [PubMed] [Google Scholar]
- Taylor, B.L., and Zhulin, I.B. (1999). PAS domains: Internal sensors of oxygen, redox potential, and light. Microbiol. Mol. Biol. Rev. 63, 479–506. [DOI] [PMC free article] [PubMed] [Google Scholar]
- Winn, M.D., Isupov, M.N., and Murshudov, G.N. (2001). Use of TLS parameters to model anisotropic displacements in macromolecular refinement. Acta Crystallogr. D 57, 122–133. [DOI] [PubMed] [Google Scholar]
- Young, M.A., Gonfloni, S., Superti-Furga, G., Roux, B., and Kuriyan, J. (2001). Dynamic coupling between the SH2 and SH3 domains of c-Src and Hck underlies their inactivation by C-terminal tyrosine phosphorylation. Cell 105, 115–126. [DOI] [PubMed] [Google Scholar]


