

Abstract
The elicitation of phytoalexin biosynthesis in cultured cells of California poppy involves a shift of cytoplasmic pH via the transient efflux of vacuolar protons. Intracellular effectors of vacuolar proton transport were identified by a novel in situ approach based on the selective permeabilization of the plasma membrane for molecules of ≤10 kD. Subsequent fluorescence imaging of the vacuolar pH correctly reported experimental changes of activity of the tonoplast proton transporters. Lysophosphatidylcholine (LPC) caused a transient increase of the vacuolar pH by increasing the Na+ sensitivity of a Na+-dependent proton efflux that was inhibited by amiloride. In intact cells, yeast elicitor activated phospholipase A2, as demonstrated by the formation of LPC from fluorescent substrate analogs, and caused a transient increase of endogenous LPC, as determined by matrix-assisted laser desorption and ionization time-of-flight mass spectrometry. It is suggested that LPC generated by phospholipase A2 at the plasma membrane transduces the elicitor-triggered signal into the activation of a tonoplast H+/Na+ antiporter.
INTRODUCTION
Transient shifts of intracellular and apoplastic pH are essential steps in several signal transduction processes of plant cells. Prominent examples include the regulation of stomatal K+ channels by auxin and abscisic acid (Grabov and Blatt, 1997; Grill and Himmelbach, 1998), the gravitropic response (Scott and Allen, 1999), the control of apical growth (Feijo et al., 1999), and the induction of pathogen defense reactions in nonhost resistance (Mathieu et al., 1996; Lapous et al., 1998; Roos et al., 1998). Cytoplasmic acidification induced by biotic or abiotic stress is considered a plant-specific trigger for the synthesis of phytoalexins and other secondary metabolites (Sakano, 2001). Regulatory pH shifts may act independent of or in concert with the better investigated Ca2+ signature (for reviews, see Roos, 2000, 2002).
In cultured plant cells, microbial elicitors often trigger rapid alkalinization of the apoplast and the outer medium (Felix et al., 1993; Mathieu et al., 1996). This easily detectable phenomenon is used frequently as an early marker of an elicitation process because, on the basis of numerous examples, it is combined with intracellular acidification, loss of K+, and influx of Ca2+ and followed by an oxidative burst. These events lead to complex response patterns, including hypersensitive cell death and activation or expression of antimicrobial enzymes and other pathogenesis-related proteins (Mathieu et al., 1996; Simon-Plas et al., 1997; Lebrun-Garcia et al., 1999). Analogous to elicitor treatment, artificial acidification of the cytoplasm caused increased mRNA levels of phenylalanine ammonia-lyase (PAL) and 3-hydroxy-3-methylglutaryl-CoA reductase (i.e., the first enzymes of the phenylpropanoid and isoprenoid pathways) in cultured cells of tobacco (Lapous et al., 1998) and of phenylalanine ammonia-lyase in rice (He et al., 1998).
The increase of external pH originates from an influx of protons into the challenged cells, as shown by the simultaneous decrease of intracellular pH and the similar specificities of both pH shifts with respect to elicitor structures such as the chain length of oligogalacturonides (Mathieu et al., 1996; Kuchitsu et al., 1997). Although the molecular mechanism of this influx is not established clearly, the inhibition of the plasma membrane H+-ATPase via reversible phosphorylation appears most likely, because the activation of Ser/Thr protein kinases is required for intracellular acidification in elicited tobacco cells (Mathieu et al., 1996) and reversible changes of the phosphorylation state of the proton pump have been found to occur after exposure of tomato cells to a fungal pathogen (Xing et al., 1996). Accordingly, pathogen defense pathways appear to depend on changes in the proton electrochemical gradient across the plasma membrane (Schaller and Oecking, 1999).
The huge and highly regulated proton pool of the plant vacuole has not yet been considered as a source of protons for cytoplasmic pH changes, although auxin-dependent pH changes were blocked in experimentally evacuolated cells (Frohnmeyer et al., 1998).
Acidification of the cytoplasm that was fed by vacuolar protons was described first in elicitor-treated cells of California poppy (Roos et al., 1998). Suspensions of cultured cells responded to a yeast elicitor by overexpressing the biosynthesis of benzophenanthridine alkaloids, which are efficient phytoalexins as a result of their DNA intercalating properties. Approximately 2 min after elicitor contact, a transient decrease of the cytoplasmic pH started simultaneously with a stoichiometrically related loss of vacuolar H+, as visualized by quantitative confocal pH topography. Artificial acidification of the cytoplasm via permeant acids triggered alkaloid formation in the absence of elicitor.
After depletion of the vacuolar proton pool by preincubation with the membrane-permeant base methylamine (i.e., in the absence of a pH gradient across the tonoplast), neither cytoplasmic acidification nor alkaloid biosynthesis could be elicited. Both reactions were restored by withdrawing methylamine and subsequent recovery of vacuolar acidity to a pH of ≤6.0. These data implied that a transient efflux of vacuolar protons is a necessary and sufficient step in the elicitation of alkaloid biosynthesis. The pH-controlled signal path could be triggered independently of the events leading to the hypersensitive response: pH shift and alkaloid formation saturated at lower elicitor concentrations and were not inhibited by external catalase, in contrast to external alkalinization, leakage of cellular K+, and browning.
Here, we propose a mechanism by which the signal originating from elicitor contact is relayed to the efflux of vacuolar protons. A product of elicitor-stimulated phospholipase A2 (PLA2) was found to specifically activate proton efflux from the vacuolar pool; thus, it is a likely candidate for the signal transfer between the plasmalemma and the tonoplast.
RESULTS
An in Situ System for Monitoring Vacuolar Proton Transport
The search for low-molecular-mass signal molecules that are formed in elicited cells and that trigger vacuolar proton fluxes is central to the present study. It requires an assay of vacuolar transport that is based on free access of micromolecules to the tonoplast and that maintains a maximum of vacuolar functions of the intact cell. An in situ system was developed that, after selective permeabilization of the plasma membrane for low-molecular-mass compounds, kept the vacuole intact within its macromolecular intracellular environment.
In situ measurements appeared superior to experiments with the isolated organelle, because the mechanisms of cellular control over vacuolar proton transport likely include interactions with cytoplasmic proteins and other organelles. Such processes might influence vacuolar (V)-ATPase activity via dissociation/reassociation of its subunits (Yoshida, 1991; Kane, 1995), dithiol-disulfide interconversions (Feng and Forgac, 1994), the activity of ion channels (Weiser and Bentrup, 1990), and the activity of amino acid transporters (Roos et al., 1997). In situ assays would further avoid potential changes of local tonoplast properties as a result of membrane rearrangements that occur during the isolation of vacuoles or tonoplast vesicles.
By combining osmotic shock with a temperature shift, the plasma membranes of cultured cells could be permeabilized without impairing the known features of vacuolar proton transport (see Methods). The main properties of the resulting in situ system of vacuolar transport are described below.
(1) The formation of “pores“ in the plasma membrane was confirmed by the rapid uptake and subsequent incorporation into DNA of propidium iodide, a dye that is impermeant to intact cell membranes (Figure 1). After permeabilization, ∼70% of all cells displayed propidium-stained nuclei, compared with ∼7% in control suspensions. The apparent pore size was estimated approximately via the distribution of fluorescently labeled dextrans of defined molecular mass. More than 90% of the propidium-stained cells proved accessible to fluorescein conjugates of 10 kD but were not stained by 40-kD conjugates (Figure 2). The loss of proteins during the permeabilization procedure was below the detection limits of Lowry measurements and SYPRO Ruby (Molecular Probes)–stained SDS gels made from 10-fold concentrated cell-free supernatants.
Figure 1.

Distribution of Carboxyfluorescein and Propidium Iodide in Intact and Permeabilized Cells.
During a 30-min preincubation with 50 nM carboxyfluorescein diacetate acetoxymethyl ester, 5- and 6-carboxyfluorescein were liberated and accumulated in vacuoles (green-yellow fluorescence). The DNA stain propidium iodide (2 μM; red fluorescence) was added before (A) or after (B) the permeabilization procedure. Filter settings were excitation at 470 to 490 nm and emission at >520 nm.
Figure 2.

Characterization of Plasma Membrane Permeability by Fluorescent Dextrans.
Fluorescence images of permeabilized cells after a 20-min incubation with 10 μM dextrans of defined molecular mass coupled to the fluorescein derivative 2′,7′-bis-(2-carboxyethyl)-5[and 6]-carboxyfluorescein.
(A) Cells incubated with dextrans of ∼40 kD.
(B) Cells incubated with dextrans of ∼10 kD.
(2) Nearly all vacuoles, but not the cytoplasmic areas of permeabilized cells, accumulated the pH probes 5-(and-6)-carboxy-2′,7′-dimethyl-3′-hydroxy-6′-N-ethylaminospiro[isobenzofuran-1(3H), 9′-(9H)xanthen]-3-one (DM-NERF) and carboxyfluorescein liberated from its permeant acetoxymethyl diacetate ester (Figure 1A). These indicators were used to monitor vacuolar pH via confocal or classic fluorescence ratio imaging during continuous perfusion in a flow-through cell chamber. Under these conditions, the vacuolar proton pool was maintained and controlled by the joint activities of V-ATPase and V-pyrophosphatase (V-PPase), as shown by the response of vacuolar pH to energy supply, specific inhibitors, and changes of the ionic environment.
In suspensions of intact cells, the pH measured in individual vacuoles ranged from 4.3 to 6.4 and was not influenced significantly by adding 1 to 3 mM of either MgATP or Mg pyrophosphate (MgPP). After the permeabilization procedure, vacuoles displayed pH values between 6.2 and 7.2 that did not change by >0.1 unit during 30 min in the absence of energy sources. Upon the addition of MgATP, the vacuoles acidified rapidly, with an initial rate that saturated at ∼1 mM ATP (Figures 3 and 4). At a given concentration of MgATP, individual vacuoles displayed different rates of acidification that led to a remarkable divergence of proton concentrations (Figure 4A) that, at saturating ATP levels, spanned the full range of vacuolar pH seen in intact cells. MgPP caused a slower pH decrease compared with MgATP (Figure 4B), confirming the lower proton-pumping efficiency of V-PPase compared with V-ATPase (Ratajczak and Wilkins, 2000).
Figure 3.

ATP-Dependent Acidification of Vacuoles in Situ Imaged by Classic Fluorescence Microscopy with Carboxyfluorescein.
MgATP (3 mM) was added at time 0. pH maps were obtained after 5 min (A) and after 10 min (B).
Figure 4.

Acidification of in Situ Vacuoles Powered by MgATP or MgPP.
(A) H+ concentrations of individual vacuoles during incubation with 1 mM MgATP.
(B) Dependence of initial rates of acidification on the concentration of MgATP or MgPP. Data are increments of H+ concentration between 5 and 10 min after the addition of MgATP or MgPP. Because individual vacuoles show basically different rates of acidification (cf. [A]), the three highest rates (mean ± sd) observed at each specified concentration of MgATP or MgPP are displayed. They were selected from three different experiments with 10 to 12 vacuoles per concentration.
(3) Specific inhibitors of the tonoplast proton pumps triggered a transient loss of vacuolar protons. Among them are bafilomycin A1, a well-characterized inhibitor of V-ATPase (Crider et al., 1994; Brauer et al., 1997), and destruxin B, a mycotoxin known for its specific inhibition of V-type ATPases in yeast (Muroi et al., 1994) and mung bean (Bandani et al., 2001). As seen in Figures 5A and 5B, the effect of destruxin B but not of bafilomycin A1 was fully reversible, which reflects properties of the yeast V-ATPase (Muroi et al., 1994). A transient loss of vacuolar protons also could be evoked by exchanging the Cl− of the perfusion medium for NO3−, confirming the known inhibition of V-ATPase by nitrate. Finally, the diphosphonate etidronate, a specific inhibitor of V-PPase (Zhen et al., 1994), triggered an increase of vacuolar pH if Mg pyrophosphate was present as an energy source (Figure 5C).
Figure 5.

Shifts of Vacuolar pH Triggered by Inhibitors of V-ATPase or V-PPase.
pH traces of individual vacuoles in situ in the presence of 200 nM bafilomycin A1 (A), 10 μM destruxin B (B), or 1 mM Na etidronate (C). In the latter case, 3 mM Mg pyrophosphate instead of 1 mM MgATP was present as the energy source. Arrows mark the time of addition to (↓) or withdrawal from (↑) the perfusion medium of each inhibitor.
In summary, it appears that the in situ vacuoles retained the main characteristics of active and passive proton transport at the tonoplast and thus constitute a sensitive test system. The vacuolar pH reflects a dynamic equilibrium of active accumulation and passive efflux of H+ that is shifted toward a transient net efflux upon the inhibition of proton pumps. Regulatory mechanisms remain intact that achieve the reaccumulation of lost protons even in the presence of pump inhibitors (Figures 5B and 5C). By changing the concentration of the energy source during a perfusion experiment, a slow, nearly constant rate of acidification could be adjusted, facilitating the detection of proton efflux that appeared as an upward deflection of a slightly decreasing pH trace (cf. Figure 5C).
Lysophosphatidylcholine Triggers the Net Efflux of Vacuolar Protons
Candidate compounds to be tested for their effects on vacuolar proton transport were selected from hydrolysis products of phospholipids. The involvement of phospholipases in elicitor-triggered signal cascades has been documented in a number of plant species. Examples include PLA2 in cultured cells of soybean (Chandra et al., 1996), tobacco (Roy et al., 1995), potato (Senda et al., 1998), and tomato leaves (Narvaez-Vasquez et al., 1999), phospholipase C in wheat leaves (Arz and Grambow, 1995) and tomato cells (van der Luit et al., 2000), and phospholipase D in tobacco cells (Laxalt et al., 2001; for reviews, see Chapman, 1998; Munnik et al., 1998; Munnik, 2001; Wang, 2001). In the cell culture used, elicitor-stimulated activity of PLA also has been demonstrated, and its stimulation or inhibition was correlated with the elicitation of alkaloid biosynthesis (Roos et al., 1999).
Table 1 shows the results of an intense search for phospholipid-derived compounds that increased the pH of in situ vacuoles when added to the perfusion medium. Among several types of molecules tested, only lysophosphatidylcholine (LPC) triggered a significant loss of vacuolar protons. The ability to evoke a pH shift required a lysophospholipid structure with a choline head group, but there was no discrimination between different fatty acid chain lengths (which varied between 12 and 18 carbon atoms) or their degree of unsaturation. Accordingly, PLA2 digests of plasma membranes prepared from the cell strain used also were active.
Table 1.
Effects of Phospholipids and Related Compounds on Vacuolar pH in Situ
| Test Compound (Fatty Acid Chain Length:Number of Double Bonds) | Increase of Vacuolar pH (pH Shift/pH Gradient) |
|---|---|
| l-α-Phosphatidylcholine (16:0/16:0) | –a |
| l-α-Phosphatidic acid (16:0/16:0) | – |
| l-α-Lysophosphatidylcholines: 18:0, 18:1, 18 unsaturatedb; 16:0, 14:0, 12:0 | 0.1 ± 0.02 |
| l-α-Lysophosphatidylethanolamine (mainly 18:0 and 16:0) | – |
| l-α-Lysophosphatidylserine (mainly 18:0) | – |
| l-α-Lysophosphatidylinositol (mainly 16:0 and 18:0) | – |
| l-α-Lysophosphatidic acid (18:1) | – |
| 1,2-sn-Diacylglycerols (18:0/18:0), (16:0/16:0) | 0.09 ± 0.03c |
| Phosphorylcholine | – |
| Choline | – |
| d-myo-Inositol 1,4,5-tris-phosphate | – |
| Palmitic acid (16:0) | – |
| Stearic acid (18:1) | – |
| Linoleic acid (18:2) | – |
| α-Linolenic acid (18:3) | – |
| γ-Linolenic acid (18:3) | – |
| PLA2 Digest of plasma membrane vesiclesd | 0.09 ± 0.02 |
Concentration in the perfusion medium was 10 μM. Before the experiment, perfusion media were prepared by adding test compounds from 20 mM stock solutions in chloroform and sonicating for 90 s at 4°C to facilitate proper dissolution. (A solubility test performed with l-α-phosphatidic acid confirmed its presence in solution.)
Vacuolar pH was monitored by fluorescence mapping. Increases that occurred within 10 min were ratioed to the pH gradient between the vacuole and the perfusion medium at the time of adding the test compound. If no pH shift was detectable, the test compound was replaced by 1 μM LPC (16:0), and the pH shift measured after this replacement was used as an internal standard indicating the proper functioning and sensitivity of the in situ vacuoles. Detergents either impaired vacuolar integrity (0.01% Triton X-100, cetyl-trimethyl-ammonium bromide or deoxycholate caused loss of pH indicators) or were tolerated without affecting vacuolar pH (pluronic F-127 up to 0.05%).
Data are means ± sd of 9 to 10 pH traces obtained from three independent cell suspensions. Differences between the effects of individual LPC or DAG species were not significant.
–, no change.
Mixture of C-18 unsaturated acids, mainly C18:2 (Sigma catalog No. L0906).
Proton efflux occurred only if >20 μM Ca2+ was added to the perfusion medium (see comment (5) in Discussion).
PLA2 from bee venom (EC 3.1.1.4). The digest was ultrafiltrated (5-kD cutoff) before use.
The rapid alkaline shift of the vacuolar pH triggered by LPC (between 0.1 and 0.3 units) was transient in nature; that is, the lost protons reappeared in the vacuole within ∼10 min even in the presence of LPC (Figures 6, inset, and 7A). Proton efflux also could be initiated in the absence of MgATP or MgPP, provided that a sufficient pH difference toward the extravacuolar medium existed at the time of LPC addition (Figure 7A, compare top and bottom traces). The dependence of the rate of proton efflux on the LPC concentration could be established by determining the ratio of the decline of vacuolar H+ concentration to the initial pH gradient between the vacuole and the outer medium.
Figure 6.

ATP-Dependent Acidification and LPC-Triggered pH Change of Vacuoles in Situ Imaged by Confocal Laser Scanning Microscopy with DM-NERF.
(A) Time 0, with no MgATP present. MgATP (3 mM) was added after this image was scanned.
(B) Ten minutes after the addition of MgATP. LPC (1 μM) was added after this image was scanned.
(C) Four minutes after the addition of LPC.
(D) Twelve minutes after the addition of LPC.
The inset shows a pH trace of the displayed vacuolar area. Letters refer to the respective pH maps, and arrows mark the time of addition (↓) or withdrawal (↑) of LPC.
Figure 7.

Efflux of Vacuolar Protons Triggered by LPC.
(A) pH traces of individual vacuoles in situ. Arrows mark addition (↓) or withdrawal (↑) of 1 μM LPC (16:0). The actual energy source is indicated at the horizontal arrows. The top two traces (open squares, right axis) represent no energy source in the perfusion medium and cells pretreated with 1 mM MgATP at 30 min before the experiment.
(B) Dependence of the LPC-triggered pH shift on LPC concentration. Efflux of vacuolar protons is presented as the maximum increase of pH (ΔpH) measured between the addition and removal of LPC (10 min). This shift is ratioed to the pH gradient between the vacuole and the perfusion medium at the time of LPC addition (ΔpHvc). Data are means ± sd of the three highest pH shifts observed at each LPC concentration. They were selected from 30 to 40 pH traces measured in five independent experiments.
This (remarkably varying) parameter is assumed to be part of the driving force of efflux. As shown in Figure 7B, a minimum concentration of ∼200 nM LPC proved to be active, and ∼600 nM was required for the half-maximum effect. At a typical vacuolar pH of 5.2, the decrease of proton concentration caused by 1 μM LPC in vacuoles of different cells ranged from 1 to 2.5 μM. These shifts are in the range found in vacuoles of intact cells after elicitor contact (Roos et al., 1998).
The saturation of H+ efflux at ∼1 μM LPC, together with its reversible mode of action (Figure 7A) and the structural requirements of proton efflux (Table 1), exclude detergent-like effects as the molecular basis of the effect of LPC on vacuolar transport. The proton efflux caused by LPC required the presence of Na+ in the extravacuolar fluid. As shown in Figure 8A, a shift of vacuolar pH could be initiated either by adding Na+ to an LPC-containing perfusion medium or vice versa. In the presence of 1 μM LPC, the minimum Na+ requirement was ∼2 mM, and the efflux rate was saturated at ∼10 mM Na+. In the absence of LPC, Na+ triggered a proton efflux at concentrations >10 mM, and saturation occurred at ∼30 mM Na+ (Figure 8B). Hence, the presence of LPC results in a reduced Na+ requirement of proton efflux.
Figure 8.

Na+ Dependence of Proton Efflux on the Presence and Absence of LPC.
(A) pH traces of individual vacuoles in situ that subsequently received LPC and Na+ (open symbols) and vice versa (closed symbols). At the times indicated by the arrows, LPC (1 μM) or NaCl (10 mM) was added to a Na+-free perfusion medium. Shown are two typical examples of six traces obtained from two different cell suspensions.
(B) Na+ concentrations required to cause an efflux of vacuolar protons in the presence and absence of LPC. Upon perfusion with Na+-free medium, NaCl was added either 10 min after the addition of 1 μM LPC (closed squares) or in the absence of LPC (open circles). Each pH shift (ΔpH) is ratioed to the pH gradient between the vacuole and the outer medium (ΔpHvc) at the time of Na+ addition; the latter is assumed to be part of the driving force of proton efflux. Each data point represents the mean ± sd of the three highest pH shifts observed at the specified Na+ concentration. These shifts were selected from 21 to 24 pH traces of three independent experiments.
These data suggest a Na+/H+ exchange process at the vacuolar membrane that is stimulated by LPC. Therefore, we tested the effect of amiloride on the Na+-dependent pH shift. This compound is a well-known inhibitor of Na+/H+ antiporters in animal cells (Counillon and Pouysségur, 2000) and was used successfully to inhibit similar transport systems of yeast and plant vacuoles (Darley et al., 2000). As shown in Figure 9A, the efflux of vacuolar H+ caused by 1 μM LPC plus 10 mM Na+ was abolished completely by 40 μM 5-(N-ethyl-N-isopropyl)-amiloride. The same concentration prevented the proton efflux initiated by 30 mM Na+ in the absence of LPC (Figure 9B).
Figure 9.

Prevention of LPC- or Na+-Triggered Proton Efflux by Amiloride.
pH traces of individual vacuoles in situ that received 40 μM 5-(N-ethyl-N-isopropyl)-amiloride (EIPA).
(A) EIPA together with 1 μM LPC plus 10 mM NaCl. Results of a corresponding experiment with inhibitor-free vacuoles are shown in Figure 7A.
(B) EIPA together with 30 mM NaCl in the absence of LPC. Inhibitor-free vacuoles are indicated by open symbols.
Other amiloride derivatives, such as 5-(N,N-dimethyl)-amiloride and 5-(N-methyl-N-isobutyl)-amiloride, showed similar inhibition. Although no efflux of vacuolar protons occurred in the presence of amiloride, the rate of acidification increased considerably, giving rise to a more acidic vacuolar pH (Figures 9A and 9B). This finding suggests that an amiloride-sensitive Na+/H+ antiport constitutes a permanent drain of the ATPase-generated H+ gradient across the tonoplast; hence, inhibition of this exchange increases the steady state concentration of vacuolar protons.
In summary, it appears that LPC increases the Na+ sensitivity of a H+/Na+ antiport that is located at the tonoplast and energized by the vacuolar proton gradient. Thus, an efflux of protons is initiated at physiological Na+ concentrations of the cytosol. The effect of LPC did not change upon the removal of Ca2+ from the perfusion medium, as indicated by the absence of any influence of 10 μM of the Ca2+ chelators 1,2-bis(o-aminophenoxy)ethane-N,N,N,N-tetraacetic acid (Kd of ∼700 nM) or dimethyl-1,2-bis(o-aminophenoxy)ethane-N,N,N,N-tetraacetic acid (Kd of ∼50 nM). Furthermore, no staurosporine-sensitive protein phosphorylation seemed to be required for the LPC-triggered proton efflux, as determined with 10 μM of this inhibitor in the perfusion medium.
LPC Is Increased Transiently after Elicitor Contact
Stimulation of PLA2 in Intact Cells
Having identified LPC as a specific effector of vacuolar proton transport, it was important to determine whether this molecule accumulated in elicitor-treated cells. In earlier studies (Roos et al., 1999), the activity of a PLA, as a potential generator of LPC, had been detected in the cell strain used via the hydrolysis of the fluorogenic phospholipid bis-BODIPY FL C11 phosphatidylcholine (BPC; for structure, see Methods). Elicitor stimulation of this activity could be visualized only after decreasing the considerable fluorescence development of nonelicited cells by PLA2 inhibitors (Roos et al., 1999).
In the present study, using a gel-based cell chamber that probably minimized mechanical and osmotic stress, elicitor-triggered stimulation of PLA activity was distinguished clearly from the activity of nonelicited cells (Figure 10). Elicitor-triggered fluorescence development was prevented by the inhibitors of PLA2 aristolochic acid and 5,8,11,14-eicosatetraynoic acid (ETYA) (Table 2). To identify the substrate specificity of PLA, the conversion of an ether phospholipid was tested that bears one BODIPY fluorophore at the sn-1 alkyl chain: BODIPY-1-O-alkyl-2-acyl-sn-glycerophosphocholine (BEPC; for structure, see Methods). The hydrolysis product indicative of PLA2 activity, BODIPY-1-(O-alkyl)-sn-glycero-3-phosphocholine (BELPC), was formed at a rate that increased after elicitor contact (Figure 11A). Thus, the elicitor-stimulated enzyme can be attributed to the A2 group because the ether substrate cannot be converted by PLA1 (Hendrickson et al., 1990).
Figure 10.

Activity of PLA2 Measured by Confocal Fluorescence Microscopy of Individual Cells.
Cells on agar discs were incubated with 0.25 μM of the fluorogenic substrate BPC and examined as described in Methods.
(A) to (C) Control cells imaged 2, 4, and 6 min after adding the substrate.
(D) to (F) Images scanned at similar time points. Yeast elicitor (1 μg/mL) was added at 4 min, i.e., before the last image (F) was scanned.
Table 2.
PLA2 Activity Measured in Intact Cells by Fluorescence Microscopy (see Figure 10)
| Experiment | Increase of Fluorescence (Intensity Units ± sd, n) |
|---|---|
| Control | 18.1 ± 3.5 (n = 7) |
| Elicitor | 29.4 ± 5.0 (n = 7) |
| Control + ETYA | 3.8 ± 0.2 (n = 6) |
| Elicitor + ETYA | 4.0 ± 0.1 (n = 6) |
| Control + aristolochic acid | 4.5 ± 0.1 (n = 6) |
| Elicitor + aristolochic acid | 5.5 ± 0.2 (n = 4) |
Fluorescence developed within 2 min of incubation with the fluorogenic substrate BPC in independent experiments with 3-day-old cell suspensions. Inhibitor concentrations were 10 μM ETYA and 20 μM aristolochic acid.
Figure 11.

Formation and Metabolization of BODIPY-Labelled Lysophosphatidylcholines by Intact Cells.
(A) Activity of PLA2 in elicitor-treated cell suspensions demonstrated by hydrolysis of the artificial substrate BEPC. The formation of the LPC derivative BELPC from the ether substrate BEPC was monitored (see Methods for formulas and analytical details). Each data point is based on the mean fluorescence of four thin layer chromatography spots of BELPC obtained from the same cell suspension; sd was 8 to 10% throughout. Three independent cell suspensions yielded curves with the same tendency.
(B) Conversion of BODIPY-labeled lysophospholipids by intact cells. During incubation of cell suspensions with 2 μM BLPC or BELPC (which had been isolated from PLA2 digests of BPC or BEPC, respectively), the content of these compounds was monitored by the methods used for PLA2 activity. Data are based on the mean fluorescence of three thin layer chromatography spots of BLPC or BELPC obtained from the same cell suspension; sd was 9 to 11% throughout. Two independent experiments gave similar results.
Cellular Steady State Content of LPC
Although the hydrolysis of artificial phospholipids indicated the ability of elicited cells to overproduce molecules of the LPC type, the question remained whether elicitor-stimulated cells generated enhanced levels of LPC from genuine phospholipids. When fed to intact cells, BODIPY-labeled LPC (but not its ether homolog) was metabolized rapidly, which indicates a fast turnover of lysophospholipids (Figure 11B). This was not unexpected, because LPC-metabolizing enzymes (e.g., acylases and lysophospholipases) are known from several plant species (Testet et al., 1996; Wang, 2001).
To gain insight into the steady state content of endogenous LPC, we attempted to use matrix-assisted laser desorption and ionization time-of-flight mass spectrometry (MALDI-TOF MS). This method proved a suitable analytic tool, because it allows fast and direct assays of defined phospholipids and related molecules without disturbing signaling processes or metabolism (which might occur during preincubation with radiolabeled lipid precursors).
Table 3 lists some of the molecular species of phosphatidylcholine (PC), LPC, and diacylglycerol (DAG) identified in cell extracts and plasma membranes of California poppy. LPCs were represented mainly by the species 18:2 (2 to 3 pmol/mg dry weight). Elicitor contact of cell suspensions caused a transient, significant increase of this molecule that could be differentiated clearly from the slower, continuous increase of the control level (Figure 12A).
Table 3.
Selection of Mass Peaks Identified in MALDI-TOF Mass Spectra of Extracts from Cells and Plasma Membrane Vesicles
| Peak Position | Assigned to Molecular Species | Peak Position | Assigned to Molecular Species |
|---|---|---|---|
| 7847 | PC 16:0, 18:0, + Na+ | 5203 | LPC 18:2 + H+ |
| 7826 | PC 16:0, 18:1, + Na+ | 5183 | LPC 16:0 + Na+ |
| 7806 | PC 16:0, 18:2, + Na+ | 4963 | LPC 16:0 + H+ |
| 7606 | PC 16:0, 18:1, + H+ | 5921 | DAG 16:0, 16:0, + H+, + Na+ |
| 7586 | PC 16:0, 18:2, + H+ | 6481 | DAG 18:0, 18:0, + H+, + Na+ |
| 5443 | LPC 18:1 + Na+ | 6202 | DAG 16:0, 18:0, + H+, + Na+ |
| 5423 | LPC 18:2 + Na+ |
Assignment to molecular species occurred in comparison with authentic compounds and using data from Petković et al. (2001) and Schiller et al. (2000).
Figure 12.

Elicitor-Triggered Increase of Endogenous LPC in Cell Suspensions and Plasma Membrane Preparations Assayed by MALDI-TOF MS.
(A) Cell suspensions in the presence or absence of 2 μg/mL yeast elicitor. The dynamic of the most abundant LPC species, 18:2 (Na+ adduct; mass-to-charge ratio of 542.3), is presented. Each data point represents an average ± sd from four measurements in the same suspension. Three independent experiments yielded similar data.
(B) Plasma membrane vesicles in the presence or absence of 2 μg/mL yeast elicitor. The mass peaks of LPC 18:2 (closed columns), LPC 18:1 (hatched columns), and LPC 16:0 (open columns), represented by the mean of their H+ and Na+ adducts, were quantified via the signal-to-noise ratio. The LPC content is ratioed to the content of phosphatidylcholine 16:0/18.1 (mass-to-charge ratio of 782.6 and 760.6), which was the most abundant membrane phospholipid of each mass spectrum. Each data point represents an average ± sd of four samples from the same membrane preparation. The experiment was repeated twice and yielded similar data. The inset shows that the formation of BELPC in plasma membrane preparations was stimulated by elicitor and inhibited by ETYA. An aliquot of the same plasma membrane preparation was incubated with 2 μM BEPC, 2 μg/mL yeast elicitor, and 20 μM ETYA as indicated. After 20 min, samples were extracted, and BELPC was quantified as in Figure 11. The ordinate shows picomoles of BELPC per microgram of vesicle protein. Data are means ± sd of three measurements of the same suspension. The experiment was performed twice with similar outcomes.
Although less pronounced, an elicitor-dependent increase also was established for the LPC species 16:0. The elicitor-triggered increase of LPC content generated from endogenous sources occurred in the same period as the previously mentioned accumulation of the fluorescent conversion products of the phospholipids BEPC (Figure 11) and BPC (Figure 13, Table 2). These findings suggest a transient activation of PLA2 by elicitor contact rather than a decrease of LPC metabolism, which in itself would not cause increased fluorescence.
Figure 13.
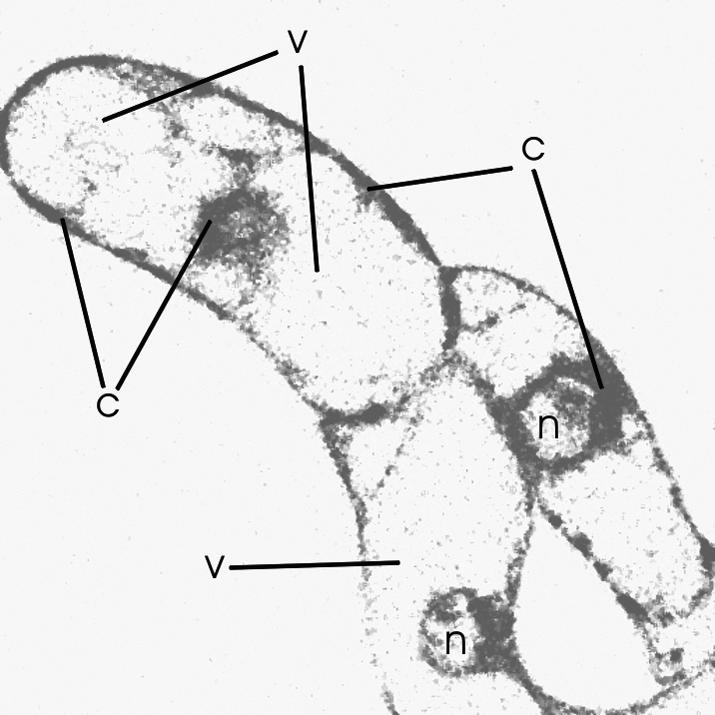
Cellular Distribution of the BODIPY-Labeled Ether Lysophospholipid BELPC Visualized by Confocal Microscopy.
Intact cells on agar discs are shown 2 min after the addition of 2 μM BELPC. This compound was isolated after hydrolysis of BELPC with PLA2. Some cytoplasmic (c) or vacuolar (v) areas and nuclei (n) are marked. Note that vacuoles are free of fluorescence. The green-yellow fluorescence was inverted into gray before printing.
Elicitor Activation of PLA2 in Plasma Membrane Vesicles
A calcium-independent PLA2 is known to be active in plasma membrane vesicles prepared from California poppy cell suspensions (Roos et al., 1999). Because this membrane preparation did not metabolize fluorescently labeled LPC, it appeared suitable to examine the formation of genuine LPCs from membrane phospholipids. As seen in Figure 12B, the molecular species LPC 16:0, LPC 18:1, and (most abundant) LPC 18:2 could be quantified in MALDI-TOF mass spectra. After elicitor contact, all of them accumulated significantly over the control level.
The increase of LPC species started more slowly than in cell suspensions but was not transient as in intact cells, reflecting the absence of LPC metabolism. The compound showing the greatest increase after elicitor contact (LPC 18:2) is identical to the abundant LPC species of intact cells that also peaked in response to elicitor (Figure 12A). Likewise, hydrolysis of the artificial PLA2 substrate BEPC was enhanced in elicitor-treated compared with control vesicles, and this activity was reduced by the PLA2 inhibitor ETYA (Figure 12B, inset). Thus, despite the significant formation of LPC in untreated membrane preparations, whether attributable to a basal level of PLA2 activity or nonspecific hydrolases, the elicitor-triggered production of LPC most probably represents PLA2 activity. This enzyme converts phosphatidylcholines of the plasma membrane (or contaminating membranes) but also the artificial substrates used in this study.
LPC Molecules Are Highly Mobile in Intact Cells
The findings described above imply that LPC species are generated transiently at the plasma membrane in response to elicitor contact. This raises the question of whether these molecules can trigger an efflux of vacuolar protons in intact cells like that found in our in situ experiments. If so, they must be able to travel rapidly to the tonoplast. To estimate the mobility of LPC, its fluorescent derivative BELPC proved to be most useful because this compound was not metabolized rapidly in intact cells (Figure 11B).
As shown in Figure 13, upon incubation with BELPC, fluorescence was seen over all cytoplasmic areas within 2 min. The fluorescence rapidly reached the tonoplast but did not enter the vacuolar interior. Although these data do not address the mode of transport, they indicate that LPC generated at the plasmalemma can reach the tonoplast easily. This would be consistent with its putative functioning upstream of the vacuolar pH shift: the latter has been imaged in intact cells 2 to 5 min after elicitor contact (Roos et al., 1998).
DISCUSSION
The data presented here suggest a link between two signaling modules of an elicited plant cell: the generation of pH changes and the activation of PLA2. Our earlier suggestions regarding the mobilization of the vacuolar proton pool for the signal transfer (Roos et al., 1998) now are more substantiated: LPC that is overproduced transiently by PLA2 at the plasma membrane might convert the elicitor-derived signal into the activation of a vacuolar H+/Na+ exchanger. The evidence supporting this concept is summarized below.
(1) Elicitor stimulation of PLA2 activity is indicated by consistent data from two different approaches: monitoring of the hydrolysis of artificial phospholipids (BPC and BEPC) in cell suspensions (Figure 11A) or individual cells (Figure 10) and mass spectrometric detection of LPC species generated from endogenous phospholipids (Figure 12). The finding that intact cells rapidly metabolize fluorescently labeled LPC (Figure 11B) implies tight control over the steady state content of LPC and may explain why the basal level of PLA2 activity detected in control cells did not trigger alkaloid biosynthesis.
(2) The dynamics of LPC, its estimated cytoplasmic concentration, and the extent of vacuolar pH shifts triggered by this compound all fit into the range spanned by the other landmark of the elicitation process, the proton fluxes of intact cells. The level of LPC peaked 2 to 3 min after elicitor contact (Figure 12A); in the same period, maximum shifts of vacuolar and cytoplasmic pH have been observed (see Figure 5 in Roos et al., 1998). The cytoplasmic concentration of LPC reached after elicitor contact can be estimated approximately from the measured steady state content and the intracellular water volume.
The latter was defined as the difference between the total water content of a given cell pellet and the extracellular water volume that is accessible to the nonpermeant protein HSA. It amounts to ∼4.9 μL/mg dry weight, and ∼86% of this value represents the vacuolar volume according to morphometric measurements. The increase of LPC 18:2 content over the control value is ∼1.3 pmol/mg dry weight (Figure 12A) and would account for a concentration of 1.9 μM in cytoplasmic volume. The accumulation of artificial LPC derivatives under the influence of elicitor (Figure 11A) yields concentrations of a similar magnitude. Hence, after elicitor contact, the cytoplasmic LPC concentration of intact cells might reach levels sufficient to trigger an efflux of vacuolar protons.
The amplitudes of vacuolar pH shifts caused by LPC contact in situ coincide largely with those measured in elicitor-treated intact cells. In the whole cell study (Roos et al., 1998), it was found that 8 to 10 protons need to leave the vacuole to generate 1 extra free proton in the cytoplasm. If this relation is applied to a typical shift of vacuolar pH caused in situ by 1 μM LPC (e.g., from pH 5.3 to 5.47, as in Figure 7A, reflecting the loss of 1.5 μM vacuolar H+), a decrease of cytoplasmic pH from 7.3 to 6.7 can be expected. This is in the range of cytoplasmic pH shifts observed in elicited cells and thus should be sufficient to initiate the expression of alkaloid biosynthesis.
(3) In purified plasma membranes, a significant portion of the Ca2+-independent, LPC-producing capacity responded to elicitor and was sensitive to ETYA. These findings suggest that the elicitor-stimulated PLA2 activity of intact cells is localized at least in part in this membrane, even though the activation of different lipid-degrading activities during membrane isolation and purification must be taken into account. A Ca2+-insensitive, ETYA-inhibited PLA2 that was isolated as a 48-kD protein from the microsomal membranes of broad bean leaves (Jung and Kim, 2000) might resemble the enzyme expected to operate at the plasma membrane in California poppy.
The involvement of PLA2 activities in the cellular signaling of plants has been demonstrated repeatedly (for reviews, see Chapman, 1998; Munnik et al., 1998; Wang, 2001). In the complex situation of pathogen defense, an increase of PLA2 activity has been correlated with the perception of elicitors in several plant–pathogen systems (Roy et al., 1995; Senda et al., 1998; Narvaez-Vasquez et al., 1999) and with early downstream effects such as the production of reactive oxygen species (Chandra et al., 1996) and the increase of free fatty acids (Müller et al., 1993).
With regard to signal functions of the hydrolysis products, fatty acids released by PLA2 are likely second messengers in the transmission of wound- or systemin-triggered signals (Lee et al., 1997; Ryan, 2000), in auxin-stimulated cell elongation (Paul et al., 1998), and as starting material for the octadecanoid signal pathway (Blechert et al., 1995; Narvaez-Vasquez et al., 1999; Ryan, 2000). Signal functions of lysophospholipids are much less well documented, with the exception of the long-known stimulation of the plasma membrane proton pump (see below) and a recently suggested role of lysophosphatidic acid in the osmotic signaling of algae (Meijer et al., 2001).
(4) The effect of LPC on vacuolar pH probably reflects the activation of a Na+/H+ antiport system at the vacuolar membrane. This is indicated by the strict dependence on Na+ at concentrations in a range required for the activity of Na+/H+ antiporters in tonoplast vesicles (Barkla et al., 1995) and by the strong inhibition by amiloride. The effect of LPC on the vacuolar Na+/H+ exchange may add a new facet to the regulation of pH and salt homeostasis in plant cells.
Tonoplast Na+/H+ exchangers were first detected and cloned in plants only a few years ago (Nass et al., 1997; Apse et al., 1999; Fukuda et al., 1999; Darley et al., 2000; for reviews see Blumwald, 2000; Padan, 2001). There is growing evidence for their role in the maintenance of Na+ homeostasis of the cytoplasm (Gaxiola et al., 1999). The most convincing data come from studies with plants and yeast species that acquired salt tolerance upon overexpression of such antiporters (Apse et al., 1999; Nass and Rao, 1999).
Our experiments suggest a new role of these transporters in the generation of cytoplasmic pH shifts, with implications for pH-controlled signal transfer and pH homeostasis. LPC increases the sensitivity of the Na+/H+ exchange toward cytoplasmic Na+ by a factor of ∼10 (Figure 8B). Thus, proton efflux could be evoked at physiological Na+ concentrations of the cytosol without the need to increase this critical parameter.
LPC is known to activate the H+-transporting ATPase of the plasma membrane (Palmgren and Sommarin, 1989), probably by stimulating the staurosporine-sensitive phosphorylation of this enzyme (Scherer et al., 1993; Hanju et al., 1996; Xing et al., 1996). In contrast, the rapid interaction of LPC with the vacuolar Na+ and H+ transport seen in our experiments was not changed by staurosporine (which, however, may not exclude any phosphorylation of involved proteins).
In summary, LPC is a good candidate for an intracytoplasmic messenger that bridges the gap between the activation of a stress-responding enzyme of the plasma membrane and the generation of vacuolar proton fluxes for the expression of the phytoalexin response after contact with low elicitor concentrations (Roos et al., 1998).
(5) Finally, it needs to be mentioned that, among the lipid metabolites tested, DAGs also caused an efflux of vacuolar protons (Table 1). However, their cellular content (∼50 pmol/mg dry weight for DAG 16:0/16:0 and 250 pmol/mg dry weight for DAG 18:0/18:0, all measured by MALDI-TOF-MS) exceeds by far the concentration required to saturate the rate of proton efflux (6 pmol/mg dry weight, corresponding to 2 μM). No less intriguing is the requirement of >20 μM extravacuolar Ca2+ for the DAG-induced proton efflux.
This value is 2 orders of magnitude higher than the resting value of cytoplasmic Ca2+ in plant cells (100 to 200 nM) (Trewavas and Malho, 1998). DAG is a central intermediate of phospholipid, triacylglycerol, and galactolipid metabolism in plants (Miège and Maréchall, 1999). However, because the metabolism of this poorly soluble compound is highly compartmentalized, the possibility cannot be excluded that local concentrations of DAG (and of Ca2+) are established near the tonoplast that allow for the transient activation of vacuolar proton efflux.
METHODS
Plant Materials
Suspension-cultured cells of California poppy (Eschscholtzia californica) were grown in a medium according to Linsmaier and Skoog (1965) with the hormones 2,4-D and α-naphthalene acetic acid (1 μM each). Cultivation was performed on a gyratory shaker (100 rpm) at 24°C in continuous light (∼7 μmol·m−2·s−1) in a 9-day growth cycle.
Yeast Elicitor Preparation
The preparation of a glycoprotein fraction of bakers' yeast (autoclaving of washed cells, pH and ethanol precipitation, and ultrafiltration) was performed essentially as described previously (Roos et al., 1998). The elicitor preparation showed no phospholipase A activity, as determined with a 10 μg/mL solution in the thin layer chromatography (TLC)–based assay used for membrane vesicles (see below).
Permeabilization and Preparation of Cells for Microscopy
After 3 to 5 days of growth, cell suspensions were preincubated with the pH probes carboxyfluorescein diacetate acetoxymethyl ester (50 nM for 30 min) or 5-(and-6)carboxy-2′,7′-dimethyl-3′-hydroxy-6′-N-ethylaminospiro[isobenzofuran-1(3H), 9′-(9H)xanthen]-3-one (DM-NERF) (5 μM for 2 h). Cells of a 2-mL sample (60 mg fresh weight) were filtered (nylon mesh, 50-μm pore size, no suction), resuspended, and gently shaken successively in (1) 2 mL of 100 mM sorbitol for 2 min, (2) 4 mL of hypertonic medium 1, precooled to 13°C, for 15 min, (3) 4 mL of near isotonic medium 2 for 15 min at 13°C, and (4) medium 2 at 21°C.
After adding 2 μM propidium iodide from a 1 mM aqueous stock solution, a 10-μL cell suspension was mixed with 50 μL of medium 2 that contained 3% of low-melting-point agarose (type VII; Sigma) and was kept at 40°C. The mixture was spread rapidly on a cover glass kept at 20°C. The resulting agarose film with the embedded cells was placed in a flow-through cell chamber (volume of 140 μL; Bachofer, Reutlingen, Germany), mounted at the microscope stage, and perfused with perfusion medium at a flow rate of 300 μL/min.
Medium 1 consisted of 300 mM KCl, 20 mM Hepes, and 5 mM glutathione. Medium 2 consisted of 100 mM KCl, 20 mM Hepes, and 5 mM glutathione. Perfusion medium consisted of 100 mM KCl, 10 mM NaCl, 50 mM 3-(N-morpholino)-propanesulfonic acid Bis-tris propane, 5 mM glutathione, 0.5 mM Na citrate, 0.5 mM Na2HPO4, 2 mM ascorbic acid, 100 μM KCN, and 0.1% BSA, Na2ATP, or Na4 pyrophosphate plus equimolar amounts of MgCl2 indicated in the relevant figures. For Na+-free perfusion medium, Na+ was replaced by K+ and KCl + NaCl was replaced by 70 mM KCl + 80 mM sorbitol.
All solutions were adjusted to pH 7.4 with KOH. Effectors and inhibitors were added from stock solutions in DMSO (destruxin and bafilomycin), chloroform (phospholipids, lysophospholipids, fatty acids, and diacylglycerol), or water (Na etidronate). The final concentration of each solvent was kept at <0.05% and did not affect the vacuolar pH in a standard perfusion experiment.
Microscopy and pH Mapping
pH mapping of in situ vacuoles was performed routinely by classic fluorescence microscopy with a Nikon Diaphot 300 inversed microscope (Tokyo, Japan). 5- and 6-Carboxyfluorescein, liberated during preincubation from carboxyfluorescein diacetate acetoxymethyl ester and enriched in intact vacuoles (Figure 1B), was used as a pH probe. Excitation ratioing was performed at excitation of 470 to 490 nm (channel 1), excitation of 425 to 445 nm (channel 2), and emission of >520 nm (both channels). Images were obtained successively in channels 1 and 2, digitalized with a Sony Progressive 3 charge-coupled device camera (Tokyo, Japan), and ratioed (channel 1:channel 2) with Optimas 6 software (Bothell, WA). The green band of fluorescence was selected for further analysis to avoid interference of the red propidium fluorescence.
Confocal imaging was performed with a Leica TCS-SP confocal microscope (Wetzlar, Germany). Fluorescence images of vacuoles accumulating DM-NERF (a rhodol-based pH indicator from Molecular Probes, Eugene, OR) were obtained by excitation with the 488-nm argon laser line and simultaneous scanning at emission of 493 to 525 nm (channel 1) and emission of 527 to 560 nm (channel 2). Ratio images (channel 1:channel 2) were calculated using Corel Photopaint software (Toronto, Canada).
Calibration of ratio images to pH was done with calibration graphs established for DM-NERF (pK of 5.4) and carboxyfluorescein (pK of 6.4). For this purpose, cells preincubated with the respective pH probe were permeabilized and resuspended in 40 mM Mes buffers of varied pH. These buffers contained either 80 mM methylamine (pH 7 to 5.5) or 5 mM Na pivalate, 100 mM KCl, and 10 μM nigericine (pH 5.2 to 4.0) to facilitate the equilibration of external and vacuolar pH, according to Brauer et al. (1997) and Roos et al. (1998). Ratio images were obtained as described, and the ratio data of 10 to 12 vacuolar areas were averaged, plotted against external pH, and fitted to a sigmoidal dose–response curve (Hill slopes of 0255 for DM-NERF and 0.8 for carboxyfluorescein). All intensity ratios were color coded by self-defined lookup tables shown with the figures. The detection limit of change in pH was estimated at ∼0.07 units in a vacuolar pH range of 5.0 to 6.5.
Detection of Changes in Vacuolar pH during Perfusion Experiments
Perfusion of permeabilized cells usually started in the presence of 3 mM MgATP. Maps of vacuolar pH were obtained at 5-min intervals. After vacuolar pH had decreased to 6.0 to 5.5, the ATP concentration was reduced to 1 mM to slow the rate of acidification. Substances to be tested for their effects on proton efflux were added to the perfusion medium, and image capture was continued at 2.5-min intervals. pH traces were obtained from the time-resolved stack of pH maps by plotting the mean of one area of ∼20 × 20 pixels positioned in the middle of a distinct vacuole. Each such area was assigned to a distinct line/symbol (Figures 4, 5, 7A, 8A, and 9). A loss of vacuolar protons was assumed if the H+ traces displayed an upward deflection of >10−7 M from the value measured at the time the effector was added.
Assay of Phospholipase A Activity
Confocal Fluorescence Microscopy of Individual Cells
Cells were suspended in phosphate-free 25% culture liquid (∼12 mg fresh weight/mL). Five-microliter samples were spotted onto an Isopore membrane (Millipore, Bedford, MA) that was placed on top of an agarose (3%) gel disc of 0.5 mm thickness made from the same liquid, sealed by a cover glass, and mounted on a Leica TCS-SP confocal microscope. The substrate solution (2 μM bis-BODIPY FL C11 phosphatidylcholine [BPC] in phosphate-free 25% culture liquid), containing 2 μg/mL of elicitor if indicated, was injected with a microsyringe into the agarose disc. Fluorescence images were obtained at 63-fold optical magnification at excitation of 488 nm and emission of 510 to 520 nm.
In Cell Suspensions
After 3 to 5 days of growth, cell suspensions were filtered and resuspended (50 mg fresh weight/mL) successively in 100 mM sorbitol and in phosphate-free 75% culture liquid containing 2 μM of the fluorogenic substrates 1-O-alkyl-2-acyl-sn-glycerophosphocholine (BEPC) or BPC. After 30 min of preincubation at 21°C, 2 μg/mL yeast elicitor was added. Samples (100 μL) were withdrawn, mixed rapidly with 300 μL of methanol:chloroform (2:1, v/v), and vortexed for 30 min. After adding 100 μL of 150 mM NaCl and 100 μL of additional chloroform, phase separation occurred over 1 h at 4°C.
The chloroform phase was removed with a syringe, concentrated by evaporation under nitrogen at 20°C and resuspension in a smaller volume of chloroform, and used for TLC analysis. Samples for matrix-assisted laser desorption and ionization time-of-flight mass spectrometry (MALDI-TOF-MS) were prepared similarly but in the absence of external substrates, and 200 μL methanol:chloroform (4:1, v/v) and 160 μL of additional chloroform were used.
In Plasma Membrane Vesicles
Ten microliters of a plasma membrane vesicle suspension (∼1 μg protein/μL) was mixed with 40 μL of suspension buffer (see below) containing 2 μM BEPC. After 20 min, 150 μL of methanol:chloroform (2:1, v/v) was added and vortexed for 30 min. After adding 50 μL of 150 mM NaCl and 50 μL of chloroform, samples were treated as described for cell suspensions.
For MALDI-TOF-MS, 50-μL samples were mixed with 100 μL of methanol:chloroform (4:1, v/v) and vortexed for 30 min. After adding 50 μL of 150 mM NaCl and 80 μL of chloroform, samples were treated as described for cell suspensions.
Preparation of Plasma Membrane Vesicles
The procedure based on two-phase polymer distribution (Larsson et al., 1994) was described previously (Roos et al., 1999). The plasma membrane pellet was resuspended in a buffer containing 5 mM Na+/K+ phosphate, pH 7.8, 5 mM KCl, 330 mM Suc, 0.1 mM EDTA, and 0.5 mM phenylmethylsulfonyl fluoride. The vesicle preparation typically contained ∼10% endoplasmic reticulum and <2% vacuolar membranes, as indicated by the activities of the marker enzymes NAD(P)H–cytochrome c oxidoreductase (endoplasmic reticulum), α-mannosidase (tonoplast), and erythrosin B–sensitive ATPase (plasma membrane).
TLC of Phospholipid Samples
Four microliters of chloroform extract (see above) was applied on silica HPTLC-plates (Merck, Darmstadt, Germany) using an AS 30 TLC applicator (Desaga, Wiesloch, Germany). The plates were developed in a horizontal TLC sandwich chamber (Camag, Mutten, Switzerland) with chloroform:methanol:water (65:25:4, v/v/v) as the mobile phase. After drying at room temperature, fluorescent compounds were visualized and quantified with a STORM imager (Molecular Dynamics, Sunnyvale, CA). The intensity of the 1-(O-alkyl)-sn-glycero-3-phosphocholine (BELPC) spot was converted to concentrations using a calibration graph of BELPC made from BEPC by conversion with authentic phospholipase A2 from bee venom.
MALDI-TOF Assays of Phospholipids, Lysophospholipids, and Diacylglycerols
Although not yet widespread in plant science, the potential of this fast and direct analysis of complex lipid mixtures has been established by methodological work and its application to human cells (Schiller et al., 2000; Müller et al., 2001; Petković et al., 2001). Compared with protein analysis, MALDI-TOF MS of lipids allows a more reliable quantification because the matrix and the analyte are easily soluble in the same solvent and thus form a homogeneous phase.
Chloroform extract (1.8 μL) was mixed with the same volume of matrix solution (0.5 M 2,5-dihydrobenzoic acid and 0.1% [v/v] trifluoroacetic acid in methanol) and spotted onto the sample plate, and the solvent was removed by drying under a warm air stream. MALDI-TOF mass spectra were obtained on a Voyager Biospectrometry work station (PerSeptive Biosystems, Framingham, MA) using the protocol published by Schiller et al. (1999).
In brief, the ions liberated by a pulsed nitrogen laser at 337 nm were accelerated by a 20-kV voltage within the ion source, and the total field-free time-of-flight distance was 2 m. Internal calibration was performed by setting the mass peak of the protonated 2,5-dihydrobenzoic acid matrix to 155.034 D. Each mass spectrum was calculated by averaging the results of 128 single laser shots and was repeated two times. Positive ion mode spectra were used throughout.
Quantification of the compounds detected was based on signal-to-noise (S/N) ratios as described by Müller et al. (2001). The signal height (SH) of the mass peak of interest was related to the noise amplitude (NA), that is, the span between maximum and minimum signal height in a region that contained pure noise (usually 1040 to 1140 D), using the formula S/N = 2.5 (SH − 0.5 NA)/NA × 2.5. This ratio correctly reflected the concentrations of phosphatidylcholines and lysophosphatidylcholines (LPCs) in test mixtures (Müller et al., 2001; Petković et al., 2001).
In our experiments, the S/N ratios of LPC and diacylglycerol (DAG) peaks were calibrated to the concentration of these compounds by adding authentic LPC 16:0 or DAG 18:0/18:0 as internal standards to the chloroform extracts in amounts that yielded S/N ratios of a similar magnitude as those of the molecule to be analyzed. The increments in the S/N ratios caused by the authentic compounds were averaged and used to convert the measured S/N ratios of LPC and DAG to their respective concentrations. Peaks with S/N ratios of <3 were excluded from analysis.
Structures of the Artificial Phospholipase Substrates
BEPC has the structure 2-decanoyl-1-(O-(11-(4,4-difluoro-5,7-dimethyl-4-bora-3a,4a-diaza-S-indacene-3-propionyl)amino)undecyl)-sn-glycero-3-phosphocholine. Its corresponding lysophospholipid is BELPC. BPC has the structure 1,2-bis-(4,4-difluoro-5,7-dimethyl-4-bora-3a,4a-diaza-S-indacene-3-undecanoyl)-sn-glycero-3-phosphocholine. Its corresponding lysophospholipid is BLPC.
In this substrate, the vicinity of the fluorophores located at either fatty acid results in intramolecular quenching. Separation of one or two fatty acid(s) upon hydrolysis causes an increase of fluorescence that can be visualized by fluorescence microscopy, as shown in zebrafish embryos (Farber et al., 1999) and in the California poppy culture used here (Roos et al., 1999).
Acknowledgments
We are grateful to M. Petković, J. Schiller, and K. Arnold (Institute of Medical Physics and Biophysics, University of Leipzig) for their expert help with the MALDI-TOF MS and to A. Nitzsche and W. Schwartze from our department for corroborating the fluorescence assays of phospholipase A. Destruxin B was a kind gift of A. Takatsuki (RIKEN Institute, Saitama, Japan). The work was supported by a grant from the Deutsche Forschungsgemeinschaft (SFB 363) and by the Fonds der Chemischen Industrie.
Article, publication date, and citation information can be found at www.plantcell.org/cgi/doi/10.1105/tpc.002329.
References
- Apse, M.P., Aharon, G.S., Snedden, W.A., and Blumwald, E. (1999). Salt tolerance conferred by overexpression of a vacuolar Na+/H+ antiport in Arabidopsis. Science 285, 1256–1258. [DOI] [PubMed] [Google Scholar]
- Arz, M.C., and Grambow, H.J. (1995). Elicitor and suppressor effects on phospholipase C in isolated plasma membranes correlate with alterations in phenylalanine ammonia-lyase activity of wheat leaves. J. Plant Physiol. 146, 64–70. [Google Scholar]
- Bandani, A.R., Amiri, B., Butt, T.M., and Gordon-Weeks, R. (2001). Effects of efrapeptin and destruxin, metabolites of entomogenous fungi, on the hydrolytic activity of a vacuolar type ATPase identified on the brush border membrane vesicles of Galleria mellonella midgut and on plant membrane bound hydrolytic enzymes. Biochim. Biophys. Acta 1510, 367–377. [DOI] [PubMed] [Google Scholar]
- Barkla, B.J., Zingarelli, L., Blumwald, E., and Smith, J.A.C. (1995). Tonoplast Na+/H+ antiport activity and its energization by the vacuolar H+ ATPase in the halophytic plant Mesembryanthemum crystallinum. Plant Physiol. 109, 549–556. [DOI] [PMC free article] [PubMed] [Google Scholar]
- Blechert, S., Brodschelm, W., Hölder, S., Kammerer, L., Kutchan, T.M., Müller, M.J., Xia, Z.-Q., and Zenk, M.H. (1995). The octadecanoic pathway: Signal molecules for the regulation of secondary pathways. Proc. Natl. Acad. Sci. USA 92, 4099–4105. [DOI] [PMC free article] [PubMed] [Google Scholar]
- Blumwald, E. (2000). Sodium transport and salt tolerance in plants. Curr. Opin. Cell Biol. 12, 431–434. [DOI] [PubMed] [Google Scholar]
- Brauer, D., Uknalis, J., Triana, R., and Tu, S.I. (1997). Effects of external pH and ammonium on vacuolar pH in maize roothair cells. Plant Physiol. Biochem. 35, 31–39. [DOI] [PMC free article] [PubMed] [Google Scholar]
- Chandra, S., Heinstein, P.F., and Low, P.S. (1996). Activation of phospholipase A by plant defense elicitors. Plant Physiol. 110, 979–986. [DOI] [PMC free article] [PubMed] [Google Scholar]
- Chapman, K.D. (1998). Phospholipase activation during plant growth and development and in response to environmental stress. Trends Plant Sci. 11, 419–426. [Google Scholar]
- Counillon, L., and Pouysségur, J. (2000). The expanding family of eucaryotic Na+/H+ exchangers. J. Biol. Chem. 276, 1–4. [DOI] [PubMed] [Google Scholar]
- Crider, B.P., Xie, X.-S., and Stones, D.K. (1994). Bafilomycin inhibits proton flow through the H+ channel of vacuolar proton pumps. J. Biol. Chem. 269, 17379–17381. [PubMed] [Google Scholar]
- Darley, C.P., van Wuytswinkel, O.C., van der Woude, K., Mager, W.H., and de Boer, A.H. (2000). Arabidopsis thaliana and Saccharomyces cerevisiae NHX1 genes encode amiloride sensitive electroneutral Na+/H+ exchangers. Biochem. J. 351, 241–249. [DOI] [PMC free article] [PubMed] [Google Scholar]
- Farber, S.A., Olson, E.S., Clark, J.D., and Halpern, M.E. (1999). Characterization of Ca2+-dependent phospholipase A2 activity during zebrafish embryogenesis. J. Biol. Chem. 274, 19338–19346. [DOI] [PubMed] [Google Scholar]
- Feijo, J.A., Sainhas, J., Hackett, G.R., Kunkel, J.G., and Hepler, P.K. (1999). Growing pollen tubes possess a constitutive alkaline band in the clear zone and a growth-dependent acidic tip. J. Cell Biol. 144, 483–496. [DOI] [PMC free article] [PubMed] [Google Scholar]
- Felix, G., Regenass, M., and Boller, T. (1993). Specific perception of subnanomolar concentrations of chitin fragments by tomato cells: Induction of extracellular alkalinization, changes in protein phosphorylation, and establishment of a refractory state. Plant J. 4, 307–316. [Google Scholar]
- Feng, Y., and Forgac, M. (1994). Inhibition of vacuolar H+-ATPase by disulfide bond formation between cysteine 254 and cysteine 532 in subunit A. J. Biol. Chem. 269, 13224–13230. [PubMed] [Google Scholar]
- Frohnmeyer, H., Grabov, A., and Blatt, M.R. (1998). A role for the vacuole in auxin-mediated control of cytosolic pH by Vicia mesophyll and guard cells. Plant J. 13, 109–116. [Google Scholar]
- Fukuda, A., Nakamura, A., and Tanaka, Y. (1999). Molecular cloning and expression of the Na+/H+ exchanger gene in Oryza sativa. Biochim. Biophys. Acta 1446, 149–155. [DOI] [PubMed] [Google Scholar]
- Gaxiola, R.A., Rao, R., Sherman, A., Grisafi, P., Alper, S.L., and Fink, G.R. (1999). The Arabidopsis thaliana proton transporters A6tNhx1 and Avp1 can function in cation detoxification in yeast. Proc. Natl. Acad. Sci. USA 96, 1480–1485. [DOI] [PMC free article] [PubMed] [Google Scholar]
- Grabov, A., and Blatt, M.R. (1997). Parallel control of the inward-rectifier K+ channel by cytosolic free Ca2+ and pH in Vicia guard cells. Planta 201, 84–95. [Google Scholar]
- Grill, E., and Himmelbach, A. (1998). ABA signal transduction. Curr. Opin. Plant Biol. 1, 412–418. [DOI] [PubMed] [Google Scholar]
- Hanju, Y., Doonam, P., and Youngsook, L. (1996). In vivo evidence for the involvement of phospholipase A and protein kinase in the signal transduction pathway for auxin induced corn coleoptile elongation. Physiol. Plant. 96, 359–368. [Google Scholar]
- He, D.Y., Yazaki, Y., Nishizawa, Y., Takai, R., Yamada, K., Sakano, K., Shibuya, N., and Minami, E. (1998). Gene activation by cytoplasmic acidification in suspension-cultured rice cells in response to the potent elicitor, N-acetylchitoheptaose. Mol. Plant-Microbe Interact. 11, 1167–1174. [Google Scholar]
- Hendrickson, H.S., Kotz, K.J., and Hendrickson, E.K. (1990). Evaluation of fluorescent and colored phosphatidylcholine analogs as substrates for the assay of phospholipase A2. Anal. Biochem. 185, 80–83. [DOI] [PubMed] [Google Scholar]
- Jung, K.M., and Kim, D.K. (2000). Purification and characterization of a membrane-associated 48-kilodalton phospholipase A2 in leaves of broad bean. Plant Physiol. 123, 1057–1068. [DOI] [PMC free article] [PubMed] [Google Scholar]
- Kane, P.M. (1995). Disassembly and reassembly of the yeast vacuolar H+-ATPase in vivo. J. Biol. Chem. 270, 17025–17032. [PubMed] [Google Scholar]
- Kuchitsu, K., Yazaki, Y., Sakano, K., and Shibuya, N. (1997). Transient cytoplasmic pH change and ion fluxes through the plasma membrane in suspension-cultured rice cells triggered by N-acetylchitooligosaccharide elicitor. Plant Cell Physiol. 38, 1012–1018. [Google Scholar]
- Lapous, D., Mathieu, Y., Guern, J., and Lauriére, C. (1998). Increase of defense gene transcripts by cytoplasmic acidification in tobacco cell suspensions. Planta 205, 452–458. [Google Scholar]
- Larsson, C., Widell, S., and Sommarin, M. (1994). Isolation of highly purified plant plasma membranes and separation of inside-out and right-side-out vesicles. FEBS Lett. 229, 289–292. [Google Scholar]
- Laxalt, A.M., ter Riet, B., Verdonk, J.C., Parigi, L., Tameling, W.I.L., Vossen, J., Haring, M., Musgrave, A., and Munnik, T. (2001). Characterization of five tomato phospholipase D cDNAs: Rapid and specific expression of LePLD.β1 on elicitation with xylanase. Plant J. 26, 237–247. [DOI] [PubMed] [Google Scholar]
- Lebrun-Garcia, A., Bourque, S., Binet, M.N., Ouaked, F., Wendehenne, D., Chiltz, A., Schaffner, A., and Pugin, A. (1999). Involvement of plasma membrane proteins in plant defense responses: Analysis of the cryptogein signal transduction in tobacco. Biochimie 6, 663–668. [DOI] [PubMed] [Google Scholar]
- Lee, S., Suh, S., Kim, S., Crain, R.C., and Kwak, J.M. (1997). Systemic elevation of phosphatidic acid and lysophospholipid levels in wounded plants. Plant J. 12, 547–556. [Google Scholar]
- Linsmaier, E.M., and Skoog, F. (1965). Organic growth factor requirements of tobacco tissue cultures. Physiol. Plant. 18, 100–127. [Google Scholar]
- Mathieu, Y., Lapous, D., Thomine, S., Laurière, C., and Guern, J. (1996). Cytoplasmic acidification as an early phosphorylation-dependent response of tobacco cells to elicitors. Planta 199, 416–424. [Google Scholar]
- Meijer, H.J.G., Arisz, S.A., van Himbergen, J.A.J., Musgrave, A., and Munnik, T. (2001). Hyperosmotic stress rapidly generates lyso-phosphatidic acid in Chlamydomonas. Plant J. 25, 541–548. [DOI] [PubMed] [Google Scholar]
- Miège, C., and Maréchall, E. (1999). 1,2-sn-Diacylglycerol in plant cells: Product, substrate and regulator. Plant Physiol. Biochem. 37, 795–808. [DOI] [PubMed] [Google Scholar]
- Müller, M., Schiller, J., Petković, M., Oehrl, W., Heinze, R., Wetzker, R., Arnold, K., and Arnhold, J. (2001). Limits for the detection of (poly-)phosphoinositides by matrix-assisted laser desorption and ionization time-of-flight mass spectrometry (MALDI-TOF MS). Chem. Physiol. Lipids 110, 151–164. [DOI] [PubMed] [Google Scholar]
- Müller, M.J., Brodschelm, W., Spannagl, E., and Zenk, M.H. (1993). Signaling in the elicitation process is mediated through the octadecanoid pathway leading to jasmonic acid. Proc. Natl. Acad. Sci. USA 90, 7490–7494. [DOI] [PMC free article] [PubMed] [Google Scholar]
- Munnik, T. (2001). Phosphatidic acid: An emerging plant lipid second messenger. Trends Plant Sci. 6, 227–233. [DOI] [PubMed] [Google Scholar]
- Munnik, T., Irvine, R.F., and Musgrave, A. (1998). Phospholipid signalling in plants. Biochim. Biophys. Acta 1389, 222–272. [DOI] [PubMed] [Google Scholar]
- Muroi, M., Shiragami, N., and Takatsuki, A. (1994). Destruxin B, specific and readily reversible inhibitor of vacuolar-type H+-translocating ATPase. Biochem. Biophys. Res. Commun. 205, 1358–1365. [DOI] [PubMed] [Google Scholar]
- Narvaez-Vasquez, J., Florin-Christensen, J., and Ryan, C.A. (1999). Positional specificity of a phospholipase A activity induced by wounding, systemin, and oligosaccharide elicitors in tomato leaves. Plant Cell 11, 2249–2260. [DOI] [PMC free article] [PubMed] [Google Scholar]
- Nass, R., Cunningham, K.W., and Rao, R. (1997). Intracellular sequestration of sodium by a novel Na+/H+ exchanger in yeast is enhanced by mutations in the plasma membrane H+-ATPase. J. Biol. Chem. 272, 26145–26152. [DOI] [PubMed] [Google Scholar]
- Nass, R., and Rao, R. (1999). The yeast endosomal Na+/H+ exchanger, NHx1, confers osmotolerance following acute hypertonic shock. Microbiology 145, 3221–3228. [DOI] [PubMed] [Google Scholar]
- Padan, E. (2001). Na+/H+ antiporters. Biochim. Biophys. Acta 1505, 144–157. [DOI] [PubMed] [Google Scholar]
- Palmgren, M.G., and Sommarin, M. (1989). Lysophosphatidylcholine stimulates ATP dependent proton accumulation in isolated oat root plasma-membrane vesicles. Plant Physiol. 90, 1009–1014. [DOI] [PMC free article] [PubMed] [Google Scholar]
- Paul, R.U., Holk, A., and Scherer, G.F. (1998). Fatty acids and lysophospholipids as potential second messengers in auxin action: Rapid activation of a phospholipase A2 activity by auxin in suspension-cultured parsley and soybean cells. Plant J. 16, 601–611. [Google Scholar]
- Petković, M., Schiller, J., Müller, J., Müller, M., Arnold, K., and Arnhold, J. (2001). The signal-to-noise-ratio as the measure for the quantification of lysophospholipids by matrix-assisted laser desorption/ionisation time-of-flight mass spectrometry. Analyst 126, 1042–1050. [DOI] [PubMed] [Google Scholar]
- Ratajczak, R., and Wilkins, T.A. (2000). Energizing the tonoplast. Annu. Plant Rev. 5, 133–173. [Google Scholar]
- Roos, W. (2000). Ion mapping in plant cells: Methods and applications in signal transduction research. Planta 210, 347–370. [DOI] [PubMed] [Google Scholar]
- Roos, W. (2002). Confocal pH topography in plant cells: Shifts of proton distribution are involved in plant signalling. In Handbook of Plant Growth: pH as a Major Variable in Plant Growth, Z. Rengel, ed (New York: Marcel Dekker), pp. 73–106.
- Roos, W., Dordschbal, B., Steighardt, J., Hieke, M., Weiss, D., and Saalbach, G. (1999). A redox-dependent, G-protein-coupled phospholipase A of the plasma membrane is involved in the elicitation of alkaloid biosynthesis in Eschscholtzia californica. Biochim. Biophys. Acta 1448, 390–402. [DOI] [PubMed] [Google Scholar]
- Roos, W., Evers, S., Hieke, M., Tschöpe, M., and Schumann, B. (1998). Shifts of intracellular pH distribution as a part of the signal mechanism leading to the elicitation of benzophenanthridine alkaloid biosynthesis. Plant Physiol. 118, 349–364. [DOI] [PMC free article] [PubMed] [Google Scholar]
- Roos, W., Schulze, R., and Steighardt, J. (1997). Dynamic compartmentation of vacuolar amino acids in Penicillium cyclopium. J. Biol. Chem. 272, 15849–15855. [DOI] [PubMed] [Google Scholar]
- Roy, S., Pouénat, M.-L., Caumont, C., Cariven, C., Prévost, M.-C., and Esquerré-Tugayé, M.-T. (1995). Phospholipase activity and phospholipid patterns in tobacco cells treated with fungal elicitor. Plant Sci. 107, 17–25. [Google Scholar]
- Ryan, C.A. (2000). The systemin signaling pathway: Differential activation of plant defensive genes. Biochim. Biophys. Acta 1447, 112–121. [DOI] [PubMed] [Google Scholar]
- Sakano, K. (2001). Metabolic regulation of pH in plant cells: Role of cytoplasmic pH in defense reaction and secondary metabolism. Int. Rev. Cytol. 206, 1–44. [DOI] [PubMed] [Google Scholar]
- Schaller, A., and Oecking, C. (1999). Modulation of plasma membrane H+-ATPase activity differentially activates wound and pathogen defense responses in tomato plants. Plant Cell 11, 263–272. [DOI] [PMC free article] [PubMed] [Google Scholar]
- Scherer, G.F.E., Hecker, D., and Muller, J. (1993). Ca2+ ions and lysophospholipids activate phosphorylation of different proteins in plasma membranes and tonoplast. J. Plant Physiol. 142, 425–431. [Google Scholar]
- Schiller, J., Arnhold, J., Benard, S., Müller, M., Reichl, S., and Arnold, K. (1999). Lipid analysis by matrix-assisted laser desorption and ionization mass spectrometry: A methodological approach. Anal. Biochem. 267, 46–56. [DOI] [PubMed] [Google Scholar]
- Schiller, J., Arnhold, J., Glander, H.-J., and Arnold, K. (2000). Lipid analysis of human spermatozoa and seminal plasma by MALDI-TOF mass spectrometry and NMR spectroscopy: Effects of freezing and thawing. Chem. Physiol. Lipids 106, 145–156. [DOI] [PubMed] [Google Scholar]
- Scott, A.C., and Allen, N.S. (1999). Changes in cytosolic pH within Arabidopsis root columella cells play a key role in the early signaling pathway for root gravitropism. Plant Physiol. 121, 1291–1298. [DOI] [PMC free article] [PubMed] [Google Scholar]
- Senda, K., Doke, N., and Kawakita, K. (1998). Effect of mastoparan on phospholipase A2 activity in potato tubers treated with fungal elicitor. Plant Cell Physiol. 39, 1080–1086. [Google Scholar]
- Simon-Plas, F., Rusterucci, C., Milat, M.L., Humbert, C., Montillet, J.L., and Blein, J.P. (1997). Active oxygen species production in tobacco cells elicited by cryptogein. Plant Cell Environ. 20, 1573–1579. [Google Scholar]
- Testet, E., Bessoule, J.J., Mongrand, S., Guillot-Salomon, T., Cantrel, C., and Cassagne, C. (1996). Occurrence of an acyl-CoA:1-acylglycerophosphorylcholine acyltransferase in plant mitochondria. FEBS Lett. 399, 87–91. [DOI] [PubMed] [Google Scholar]
- Trewavas, A.J., and Malho, R. (1998). Ca2+ signalling in plant cells: The big network! Curr. Opin. Plant Biol. 1, 428–433. [DOI] [PubMed] [Google Scholar]
- van der Luit, A.H., Piatti, T., van Doorn, A., Musgrave, A., Felix, G., Boller, T., and Munnik, T. (2000). Elicitation of suspension-cultured tomato cells triggers the formation of phosphatidic acid and diacylglycerol pyrophosphate. Plant Physiol. 123, 1507–1515. [DOI] [PMC free article] [PubMed] [Google Scholar]
- Wang, X. (2001). Plant phospholipases. Annu. Rev. Plant. Physiol. Plant. Mol. Biol. 52, 211–231. [DOI] [PubMed] [Google Scholar]
- Weiser, T., and Bentrup, F.-W. (1990). (+)-Tubocurarine is a potent inhibitor of cation channels in the vacuolar membrane of Chenopodium rubrum L. FEBS Lett. 277, 220–222. [DOI] [PubMed] [Google Scholar]
- Xing, T., Higgins, V.J., and Blumwald, E. (1996). Regulation of plant defense response to fungal pathogens: Two types of protein kinases in the reversible phosphorylation of the host plasma membrane H+-ATPase. Plant Cell 8, 555–564. [DOI] [PMC free article] [PubMed] [Google Scholar]
- Yoshida, S. (1991). Chilling-induced inactivation and its recovery of tonoplast H+-ATPase in mung bean cell suspension cultures. Plant Physiol. 95, 455–460. [DOI] [PMC free article] [PubMed] [Google Scholar]
- Zhen, R.-G., Baykov, A.A., Bakuleva, N.P., and Rea, P.A. (1994). Aminomethylenediphosphonate: A potent type-specific inhibitor of both plant and phototrophic bacterial H+-pyrophosphatases. Plant Physiol. 104, 153–159. [DOI] [PMC free article] [PubMed] [Google Scholar]