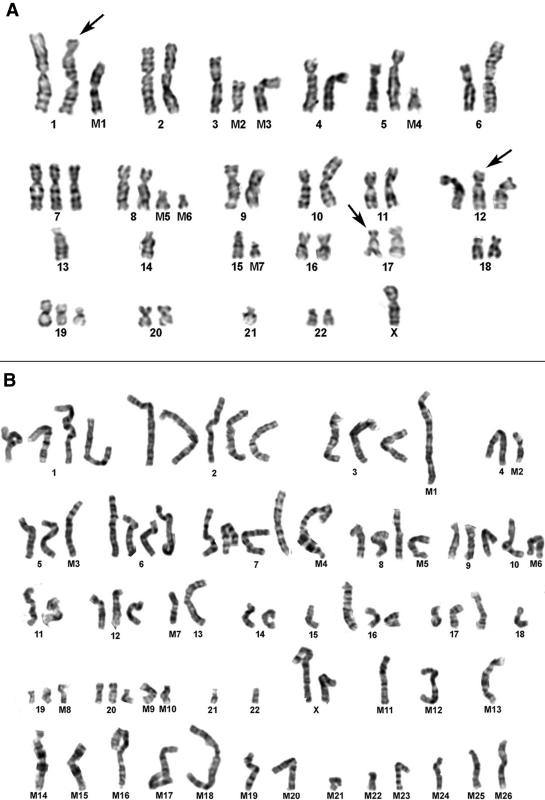
Figure 3.
A. G-banding analysis of embryonal RMS cell line RD. The chromosomal origins were confirmed using SKY analysis (see Figure 4A). Examples of cryptic rearrangements, which were undetected by G band analysis but identified by SKY, are arrowed. B. G-banding analysis of alveolar RMS cell line SJRH30. The chromosomal origins were confirmed by using SKY analysis (see Figure 4B). Numerous marker (M1–M26) chromosomes and partially identified derivatives can be seen.

