Abstract
A critical component of insulin action is the enzyme phosphoinositide (PI) 3-kinase. The major regulatory subunits of PI 3-kinase, p85α and its splice variants, are encoded by the Pik3r1 gene. Heterozygous disruption of Pik3r1 improves insulin signaling and glucose homeostasis in normal mice and mice made insulin-resistant by heterozygous deletion of the Insulin receptor and/or insulin receptor substrate-1 (IRS1) genes. Reduced expression of p85 modulates the molecular balance between this protein, the p110 catalytic subunit of PI 3-kinase, and the IRS proteins. Thus, despite the decrease in p85α, PI 3-kinase activation is normal, insulin-stimulated Akt activity is increased, and glucose tolerance and insulin sensitivity are improved. Furthermore, Pik3r1 heterozygosity protects mice with genetic insulin resistance from developing diabetes. These data suggest that regulation of p85α levels may provide a novel therapeutic target for the treatment of type 2 diabetes.
Introduction
Insulin resistance is a major pathophysiologic feature of type 2 diabetes, obesity, polycystic ovarian disease, and the metabolic syndrome (1, 2). Unraveling the molecular determinants of insulin resistance is therefore essential to understanding of the pathogenesis of these diseases and development of therapies for them. Over the past decade, evidence has accumulated indicating that class IA phosphoinositide (PI) 3-kinase plays a central role in the metabolic actions of insulin (3). Class IA PI 3-kinase is a heterodimer composed of catalytic and regulatory subunits. Most tissues express two forms of regulatory subunit, p85α and p85β, and two forms of catalytic subunit, p110α and p110β (3). p85α and p85β share the highest degree of homology in the C-terminal half of the molecules, which contains two SH2 domains that bind to tyrosine-phosphorylated proteins and an inter-SH2 domain that interacts with the catalytic subunit. The N-terminal halves of p85α and p85β contain an SH3 domain, a BCR homology region, and two proline-rich domains, but these domains are less well conserved between the two molecules. Two isoforms of p85α truncated in the N-terminal region, identified as AS53 (or p55α) (4, 5) and p50α (6, 7), as well as p85α itself, are derived from a single gene (Pik3r1). p85β and another short isoform with limited tissue distribution termed p55γ/p55PIK are encoded by separate genes (8).
Insulin stimulation of PI 3-kinase activity involves docking of tyrosine-phosphorylated insulin receptor substrate (IRS) proteins to SH2 domains of the regulatory subunit via pYXXM motifs. This increases the intracellular levels of PI(3, 4)P2 and PI(3, 4, 5)P3, which are presumed to act as second messengers of insulin actions (9). A large body of evidence in cultured cells indicates that PI 3-kinase is central to the metabolic effects of insulin on glucose transport (10–12), glycogen synthesis (13), hepatic glucose production (14, 15), and regulation of β cell function (16). Although it is known that changes in the regulatory subunits of PI 3-kinase are observed in animals with insulin resistance and diabetes (17, 18), suggesting that expression levels of the regulatory subunits might modulate insulin sensitivity in vivo, the precise role of PI 3-kinase in glucose homeostasis in vivo is still poorly understood.
To directly clarify the role of PI 3-kinase in vivo, knockout mice with several types of disruption of PI 3-kinase have been engineered. Of these, disruption of p110α results in embryonic lethality, presumably through deficiency of PI 3-kinase signaling for normal growth, such that it is impossible to address the role of PI 3-kinase in glucose homeostasis (19). Disrupting the regulatory subunits was also expected to result in an impaired PI 3-kinase signaling in insulin actions, since these subunits function as a bridge between the p110 subunit and IRS proteins. Surprisingly, however, mice carrying a disruption of only the long form of p85α but still expressing the alternatively spliced forms of this gene, p55α and p50α, exhibit increased insulin sensitivity (20). This led to the suggestion that the improvement of insulin sensitivity was due to an increase in the p50α isoform, which seems to be a more potent mediator of PI 3-kinase–dependent signaling (20). On the other hand, homozygous disruption of all products of the Pik3r1 gene results in perinatal lethality, presumably via a marked reduction in PI 3-kinase signaling (21, 22). Indeed, in the knockout mice, there is a significant decrease in the p85-p110 dimer (21, 22) by the primary reduction in the regulatory subunits and the secondary reduction in the p110 catalytic subunits. The secondary reduction is caused by a deficiency of the regulatory subunits to stabilize p110 (23). Although this indicates the indispensable role of the regulatory subunits in normal development, with regard to glucose homeostasis the homozygous knockout mice show hypoglycemia with decreased plasma insulin concentrations (22), suggesting that insulin signaling is preserved, at least in part, despite the marked reduction of the p85-p110 dimer. Recent studies suggest that the regulatory subunit plays a dual role in regulation of the p110 catalytic subunit of PI 3-kinase. Binding of p85 to p110 stabilizes p110 but also maintains p110 in a low activity state by an allosteric mechanism (23, 24). Association of the SH2 domains of p85 with tyrosine-phosphorylated IRS proteins recruits PI 3-kinase to the membrane and reduces the negative effect on the catalytic activity. Moreover, overexpression or pharmacological induction of the p85α subunit inhibits insulin or IGF-1 signaling (24, 25), by both this allosteric effect and by increasing the monomeric form of the regulatory subunit that can interfere with the p85-p110 heterodimer for binding phosphorylated IRS proteins. These findings raise a possibility that a reduction in the regulatory subunits may reduce these inhibitory effects and enhance insulin signaling by affecting the balance between the regulatory subunits, catalytic subunits, and phosphorylated IRS proteins. This would be most likely if the regulatory subunits are more abundant than the p110 subunits and IRS proteins.
To assess this possibility and better define the physiological role of the regulatory subunit, we have investigated the effects of heterozygous deletion of the Pik3r1 gene on glucose homeostasis in normal mice as well as mice with insulin resistance by heterozygous deletion of the insulin receptor (IR) and/or IRS-1 (26). In this study, we demonstrate that reduction in all isoforms derived from the Pik3r1 gene results in improved insulin signaling and glucose homeostasis and can prevent development of diabetes in mice with genetic insulin resistance.
Methods
Creation of mutant mice and PCR genotyping.
Mice heterozygous for the IR allele (IR+/–), double heterozygous for the IR- and IRS-1–null alleles (IR/IRS-1+/–), and heterozygous for the Pik3r1-null allele (p85+/–) were obtained as previously described (21, 26). Double heterozygous IR/p85+/– and triple heterozygous IR/IRS-1/p85+/– mice were generated by breeding the IR/IRS-1+/– with the p85+/– mice. This yielded eight different genotypes with the expected mendelian frequency of 12.5% per genotype: wild-type, p85+/–, IR+/–, IR/p85+/–, IRS-1+/–, IRS-1/p85+/–, IR/IRS-1+/–, and IR/IRS-1/p85+/–. All mice had a mixed genetic background consisting of 129Sv and C57BL/6. For all studies, we used the 6-month-old male mice of the same generation and mixed background. Genotyping was performed by PCR using DNA from tail biopsies of 3- to 4-week-old mice, as previously described (21, 26). All animals were housed on a 12-hour light/dark cycle and were fed a standard rodent chow (Purina Mills Inc., St. Louis, Missouri, USA). All protocols for animal use and euthanasia were approved by the Animal Care Use Committee of the Joslin Diabetes Center and Harvard Medical School in accordance with NIH guidelines.
Metabolic studies.
For glucose tolerance testing (GTT), blood samples were obtained at 0, 15, 30, 60, and 120 minutes after intraperitoneal injection of 2 g/kg dextrose. For stimulated insulin secretion, blood was obtained at 0, 2, 5, 15, and 30 minutes after intraperitoneal injection of 3 g/kg of dextrose. For insulin and IGF-1 tolerance tests, blood samples were obtained at 0, 30, 60, and 120 minutes after intraperitoneal injection of 1 U/kg insulin (Lilly Research Laboratories, Indianapolis, Indiana, USA) or 1 mg/kg IGF-1 (Peprotech Inc., Rocky Hill, New Jersey, USA). Whole blood glucose values were determined using an automatic glucose monitor (One Touch II; Lifescan Inc., Milipitas, California, USA). Plasma insulin levels were measured by ELISA using mouse insulin as a standard (Crystal Chem Inc., Chicago, Illinois, USA). Triglyceride levels in serum from fasted animals were measured by a colorimetric enzyme assay using the GPO-Trinder Assay (Sigma Diagnostics Inc., St. Louis, Missouri, USA). FFA levels were analyzed in serum from fasted animals using the NESCAUTO NEFA-Kit-U (Azwell Inc., Osaka, Japan). Plasma leptin levels were measured by ELISA using mouse leptin as a standard (Crystal Chem).
In vivo insulin stimulation and analysis of insulin signaling.
Six-month-old male mice were starved overnight, anesthetized with pentobarbital, and injected with 5 U of regular human insulin (Lilly Research Laboratories) into the inferior vena cava. Liver and muscle were removed 5 minutes after injection and frozen in liquid nitrogen. Immunoprecipitation and Western blot analysis of insulin signaling molecules were performed on tissue homogenates as previously described (26).
Glucose transport in isolated muscles.
Mice were food-restricted overnight before they were sacrificed, and the soleus and extensor digitorum longus (EDL) muscles were removed. Uptake of 2-deoxy-D-[1,2-3H]-glucose was measured in the presence or absence of 2.2 nM insulin, as previously described (27).
Antibodies and enzyme assays.
Anti-p85α antibodies (αp85pan), which recognize all variants of p85α and (to a lesser extent) p85β, p85α-specific antibodies (αp85α), and anti-phosphotyrosine antibodies (4G10) were purchased from Upstate Biotechnology Inc. (Lake Placid, New York, USA). p85β-specific antibodies (αp85β) were generated as described (21). Anti-p55PIK antibodies (αp55PIK) were kindly provided by Morris White (Joslin Diabetes Center) (8). Anti–IRS-1 antibodies (αIRS-1) were generated against a glutathione-S transferase–fusion (GST-fusion) protein corresponding to amino acids 859–1233 of mouse IRS-1. Anti–IRS-2 antibodies (αIRS-2) were generated against a GST-fusion protein corresponding to a plekstrin homology domain of mouse IRS-2. Anti-p110α antibodies (αp110α) and anti-Akt antibodies (αAkt), which recognize both Akt1 and Akt2, were purchased from Santa Cruz Biotechnology Inc. (Santa Cruz, California, USA). Phosphospecific Akt (Ser473) antibodies (αp-Akt) were purchased from New England Biolabs Inc. (Beverly, Massachusetts, USA).
PI 3-kinase activities in liver and muscle were determined using immunoprecipitates in vitro as previously described (28). Akt kinase activities were determined in the basal state and after insulin stimulation in immunoprecipitates with αAkt antibody using Crosstide, a synthetic peptide (Gly-Arg-Pro-Arg-Thr-Ser-Ser-Phe-Ala-Glu-Gly), corresponding to the region surrounding in vivo phosphorylation site of glycogen synthase kinase 3 by Akt.(29).
Results
Generation and characterization of mutant mice.
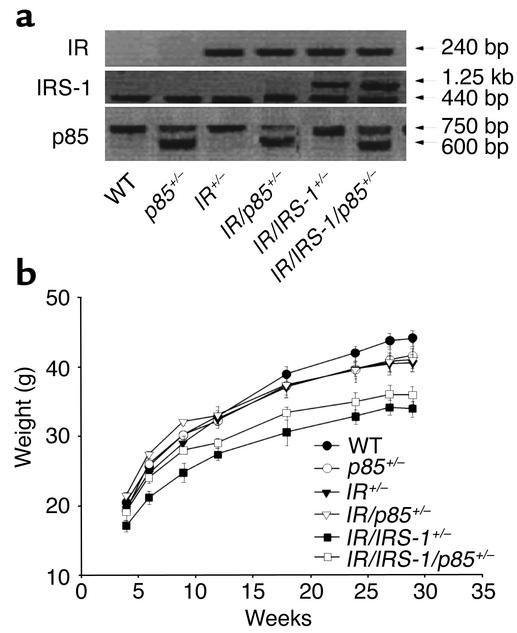
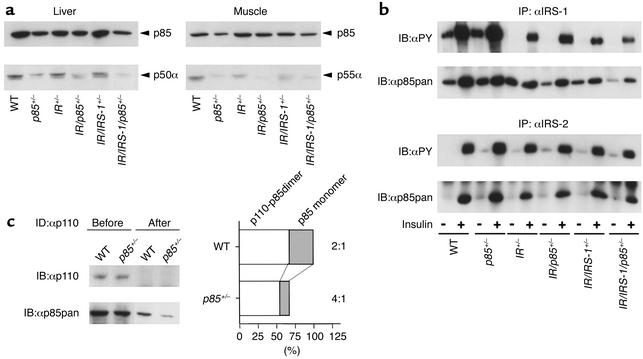
Mutant mice were generated as described in Methods and genotyped as outlined in Figure 1a. The p85+/–, IR/p85+/–, and IR/IRS-1/p85+/– mice were born alive and were indistinguishable from their controls. IR/IRS-1+/– and IR/IRS-1/p85+/– mice showed a stable 20% decrease in body weight compared with the other groups (Figure 1b), consistent with the mild growth retardation previously observed after heterozygous disruption of the IRS-1 gene (26). Immunoblotting revealed an approximately 40% decrease in total p85 protein in both liver and muscle of p85+/– mice compared with their control group (39.3% ± 1.4% and 42.0% ± 3.6% in p85+/–, 35.4% ± 5.4% and 43.7% ± 13.1% in IR/p85+/–, and 40.9% ± 8.2% and 40.2% ± 4.7% in IR/IRS-1/p85+/–; n = 3) (Figure 2a). In addition, there was an approximately 60% reduction in expression of p50α in liver and AS53/p55α in muscle from the three genotypes of mice carrying the heterozygous Pik3r1 allele (Figure 2a). The levels of p50α were 41.1% ± 6.1% in p85+/–, 37.3% ± 1.8% in IR/p85+/–, and 35.5% ± 5.6% in IR/IRS-1/p85+/– compared with their controls, and the levels of AS53 were 44.7% ± 4.8% in p85+/–, 39.1% ± 4.2% in IR/p85+/–, and 46.5% ± 4.1% in IR/IRS-1/p85+/– compared with their controls (n = 3). As expected, heterozygous deletion of IR or IRS-1 resulted in about 50% reduction of each of these proteins (data not shown).
Figure 1.
Creation of mutant mice. (a) Mice were bred and genotyped using PCR. The presence of the IR mutant allele results in a 240-bp product, while there is no product in the wild-type (WT) allele. The presence of the wild-type allele for the IRS-1 gene results in a 440-bp product; insertion of the neomycin cassette in the targeted allele results in a band of 1.25 kb. In the case of the Pik3r1 gene, the mutant allele results in a band at 600 bp, whereas the wild-type allele yields a 750-bp product. (b) Body weight of the various subgroups of mice was determined at the indicated ages. Results are expressed as mean ± SEM (n = 12–30 mice per genotype).
Figure 2.
Signaling molecules involved in activation of PI 3-kinase by insulin. (a) Expression levels of Pik3r1 gene products were determined in lysates from liver (left) and skeletal muscle (right) by Western blotting with an anti-p85pan antibody (αp85pan). (b) Tyrosine phosphorylation of IRS proteins and association with p85 were determined using lysates from liver of the indicated animals. Proteins were immunoprecipitated with anti–IRS-1 antibody (αIRS-1) (top two panels) or anti–IRS-2 antibody (αIRS-2) (bottom two panels), and blotted with anti-phosphotyrosine antibody (αPY) or αp85pan. (c) To determine the molecular balance between p85 and p110, the liver lysates were subjected to three sequential rounds of immunodepletion using αp110, followed by Western blotting with αp110 (left top panel) or αp85pan (left bottom panel). The amount of the p85-p110 dimer and the p85 monomer was expressed as the ratio to the value of the amount of the p85 monomer in the wild-type cells. In the graph, each bar represents the ratio to the total p85 in wild-type cells (open bar, p85-p110 dimer; dotted bar, p85 monomer).
Study of early insulin signaling.
As previously reported (26), IRS-1 phosphorylation and IRS-1 binding to p85 were reduced by about 50% in IR heterozygous mice and by 75–80% in the IR/IRS-1 double heterozygotes (Figure 2b). The levels of IRS-2 phosphorylation and binding to p85 were also reduced by about 40% in IR+/– mice, but were unchanged in IR/IRS-1+/– mice, probably due to a compensatory increase in IRS-2 phosphorylation (26). Heterozygosity for the Pik3r1 gene did not appreciably affect the level of IR, IRS-1, or IRS-2 phosphorylation (Figure 2b). Interestingly, despite the decrease in p85α expression in mice heterozygous for the Pik3r1 gene, the amount of p85 associated with phosphorylated IRS-1 and IRS-2 in livers of p85+/–, IR/p85+/–, and IR/IRS-1/p85+/– mice was unchanged compared with controls (Figure 2b). This appears to be due to the fact that in normal cells the p85 regulatory subunits are more abundant than the phosphorylated IRS proteins (24).
In normal cells in culture, the p85 regulatory subunits are also more abundant than the p110 catalytic subunits (24). To assess the balance between p85 monomer and p85-p110 dimer in the tissues of the mouse, we performed immunodepletion studies using anti-p110 antibody and liver lysates (Figure 2c, left, top). Under these conditions, p85 protein remaining in the lysates after immunodepletion represents the p85 monomer, whereas the amount of p85 depleted corresponds to the p85-p110 dimer. Using this approach, the ratio of p85-p110 dimer to p85 monomer in liver of wild-type mice was about 2:1 (Figure 2c, left, bottom). By comparison, in the p85+/– mice, this ratio was increased to 4:1, due to a preferential reduction in p85 monomer as compared with p85-p110 dimer. Similar results were obtained in muscle, where the ratio of p85-p110 dimer to p85 monomer was 3:1 in wild-type mice and 5:1 in p85+/– mice (data not shown).
Insulin-dependent activation of PI 3-kinase and Akt in liver and muscle.
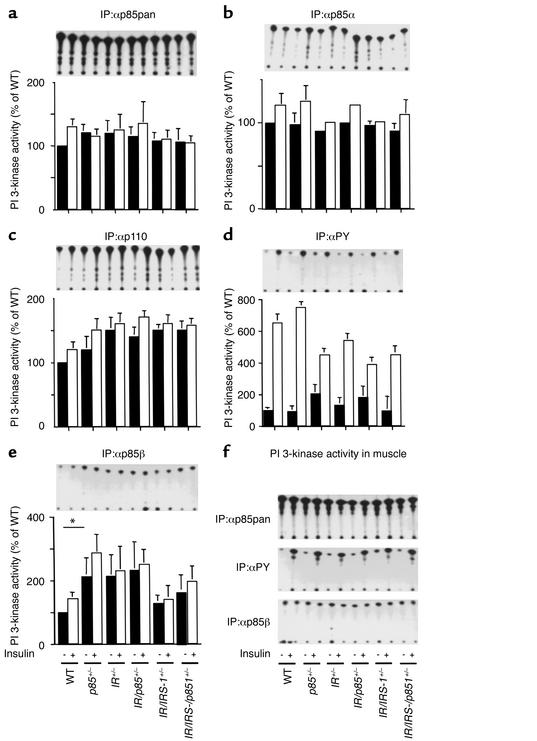
The 50% reduction in products of Pik3r1 did not result in a decrease in p85-associated PI 3-kinase activity. Thus, PI 3-kinase activity in liver detected by an anti-p85pan antibody, which recognizes p85α, p55α, p50α, and, to a lesser extent, p85β, or by an anti-p85α specific antibody, was comparable in mice of all genotypes (Figure 3, a and b). Likewise, heterozygosity for Pik3r1 had no effect on PI 3-kinase activity associated with p110α, consistent with the findings that heterozygosity for Pik3r1 does not reduce the amount of p85-p110 dimer (Figure 3c). PI 3-kinase activity associated with tyrosine-phosphorylated IRS proteins was decreased by 40% in IR+/– and by 50% in IR/IRS-1+/– mice compared with wild-type, but it was actually increased to some extent by heterozygosity for Pik3r1 (Figure 3d). This is most likely due to the increased ratio of p85-p110 dimer to p85 monomer produced by heterozygous disruption of Pik3r1, since p85 monomer can compete with p85-p110 dimer in binding to IRS proteins and inhibit PI 3-kinase–dependent signaling (24). In muscle, PI 3-kinase activity associated with anti-p85α and anti-phosphotyrosine (anti-PY) immunoprecipitates was not affected by the heterozygosity for Pik3r1 (Figure 3f). By contrast, PI 3-kinase activity associated with p85β in liver was increased in the basal and insulin-stimulated states by 15–100% in p85+/–, IR/p85+/–, and IR/IRS-1/p85+/– mice as compared with their controls (Figure 3e), while PI 3-kinase activity associated with p85β in muscle showed no significant difference between the different groups of animals (Figure 3f). PI 3-kinase activity associated with p55PIK was very low and not stimulated by insulin in all groups of animals in both liver and muscle.
Figure 3.
PI 3-kinase activation in liver and muscle of Pik3r1 mutant mice. Lysates from the liver of animals were immunoprecipitated with the indicated antibodies and subjected to a PI 3-kinase assay as described in Methods. PI 3-kinase activities associated with total regulatory subunit (αp85pan) (a), associated with p85α regulatory subunit (αp85α) (b), associated with the p110 catalytic subunit (αp110) (c), associated with tyrosine-phosphorylated proteins (αPY) (d), and associated with p85β regulatory subunit (αp85β) (e) were assessed. The upper panels shows representative PI 3-kinase assays, while each bar in the lower panels represents the mean ± SEM of the relative PI 3-kinase activity (% of unstimulated wild-type) calculated from at least three independent experiments. *P < 0.05, wild-type vs. p85+/–. (f) Activation of PI 3-kinase in muscle. Lysates were immunoprecipitated with the p85pan antibody (αp85pan, top panel), tyrosine-phosphorylated proteins (αPY, middle panel), or the p85β regulatory subunit (αp85β, bottom panel), and subjected to PI 3-kinase assay as above.
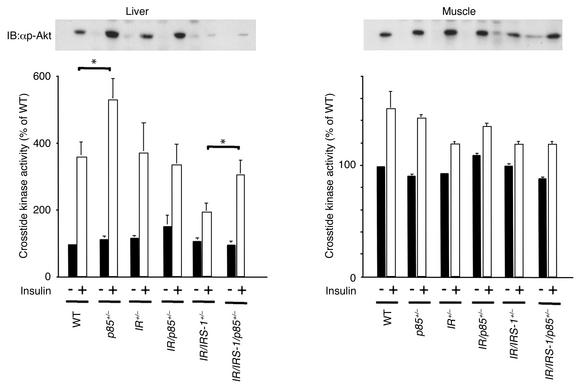
Akt is a Ser/Thr kinase that is phosphorylated and activated by PI 3-kinase upon insulin stimulation and is believed to mediate certain metabolic actions of insulin (30). In livers of wild-type mice, insulin induced a threefold increase in Akt phosphorylation and activity. This was unchanged in IR+/– and reduced by about 50% in IR/IRS-1+/– mice (Figure 4). Surprisingly, decreasing the expression of p85α and its splice variants led to an increase in Akt phosphorylation and activity in livers of p85+/– mice and IR/IRS-1/p85+/– mice (P < 0.05) as compared with their controls (Figure 4). In muscle, the effect of insulin on Akt was small, and no modification of Akt activity or phosphorylation was detected by the heterozygous knockouts (Figure 4).
Figure 4.
Insulin-stimulated Akt activity in Pik3r1 mutant mice. Lysates from liver and muscle were subjected to Western blotting with αp-Akt (top panels). Akt activity was assessed following immunoprecipitation with an anti-Akt antibody in an immune complex kinase assay (bottom panels). The results are expressed as percent of unstimulated wild-type. Each bar represents the mean ± SEM of at least four independent experiments. *P < 0.05, wild-type vs. p85+/– and IR/IRS-1+/– vs. IR/IRS-1/p85+/–.
Disrupting one allele of the p85α gene improves insulin sensitivity.
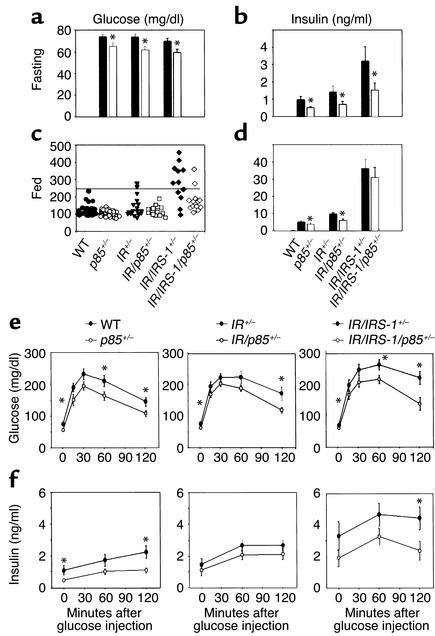
With respect to glucose homeostasis, by 6 months of age, although fasting glucose concentrations in the IR+/– and the IR/IRS-1+/– mice were still normal, random-fed glucose levels indicated that about 10% of IR+/– and about 50% of IR/IRS-1+/– mice had developed diabetes (glucose > 250 mg/dl) (Figure 5, a and c). In addition, GTT revealed impaired glucose tolerance in both the IR+/– and the IR/IRS-1+/– mice (Figure 5e).
Figure 5.
Improved glucose homeostasis in the Pik3r1 mutant groups. Fasting blood glucose (a) and insulin levels (b), and random-fed blood glucose (c) and insulin levels (d), were determined in 6-month-old male mice of the indicated genotype. For random-fed glucose levels, a scattered plot is represented; bars represent the mean ± SEM (n = 12–30 mice per genotype). Glucose (e) and insulin (f) concentrations were determined during a glucose tolerance test (2 g/kg body weight, intraperitoneally) at the indicated time points in 6-month-old male mice of the indicated genotypes. Results are expressed as mean ± SEM (n = 12–30 mice). *P < 0.05, wild-type vs. p85+/–; IR+/– vs. IR/p85+/–; IR/IRS-1+/– vs. IR/IRS-1/p85+/–.
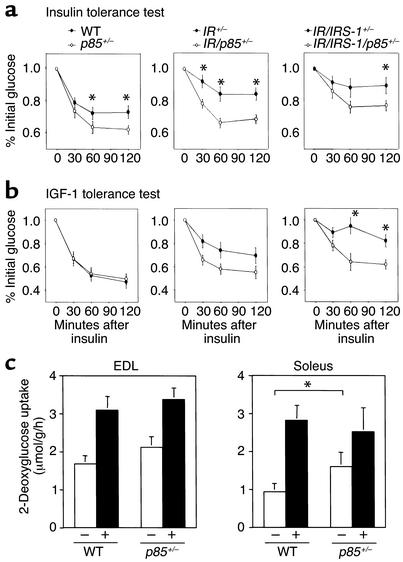
In all three genotypes of mice, heterozygosity for Pik3r1 was associated with lower blood glucose in both the fasting and the fed states (Figure 5a). In addition, p85+/– mice, IR/p85+/– mice, and IR/IRS-1/p85+/– mice showed significantly improved glucose tolerance compared with their respective controls (Figure 5e). All p85 heterozygote mice also maintained significantly lower insulin concentrations than did their respective controls (Figure 5, b, d, and f). Consistent with this, p85+/–, IR/p85+/–, and IR/IRS-1/p85+/– mice showed improved sensitivity to insulin injection as compared with their respective controls (Figure 6, a and b). Most importantly, the incidence of diabetes in the IR/IRS-1/p85+/– subgroup was reduced by half (Figure 5c). Although the improved insulin sensitivity is present in several tissues, the most important effect is probably at the liver. Glucose uptake in isolated soleus and EDL muscles was increased in the basal state, but not after insulin stimulation (Figure 6c). Likewise, heterozygosity of p85α did not affect either insulin secretion or islet size (data not shown).
Figure 6.
Increased insulin sensitivity in the Pik3r1 mutant groups. (a) Insulin tolerance tests (1 U/kg, intraperitoneally) and (b) IGF-1 tolerance tests (1 mg/kg, intraperitoneally) were performed on 6-month-old male mice of the indicated genotypes. Results represent the blood glucose concentration as a percentage of the starting glucose value and are expressed as mean ± SEM (n = 12–30 mice per genotype). *P < 0.05, wild-type vs. p85+/–; IR+/– vs. IR/p85+/–; IR/IRS-1+/– vs. IR/IRS-1/p85+/–. (c) Glucose transport activity in isolated skeletal muscle of the Pik3r1 mutant mice was estimated using 2-deoxyglucose uptake in isolated EDL and soleus muscles as described in Methods. Results are expressed as mean ± SEM (n = 4). *P < 0.05, wild-type vs. p85+/–.
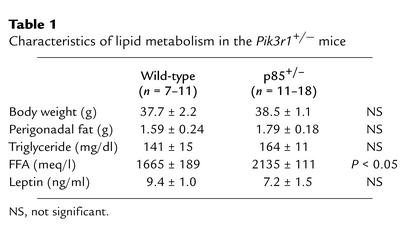
In addition to the direct effects of the heterozygous deletion of the Pik3r1 gene on insulin signaling, it is possible that a reduction in the regulatory subunits may affect glucose metabolism in an indirect fashion, such as alteration of lipid metabolism. However, as shown in Table 1, heterozygous disruption of the Pik3r1 gene did not change either body weight or fat pad mass and resulted in a modest but significant increase in FFA, which is usually associated with increased rather than decreased insulin resistance (31). Thus, it is unlikely that these changes in lipid metabolism contribute to increased insulin sensitivity in p85+/– mice.
Table 1.
Characteristics of lipid metabolism in the Pik3r1+/– mice
Recently, a number of factors secreted from adipocytes have been shown to affect insulin sensitivity (32). Of these factors, leptin is best characterized, and its deficiency is known to lead to insulin resistance in some types of obese mice (33) and lipoatrophic mice (34). Again, there was no change in plasma leptin levels by heterozygous deletion of the Pik3r1 gene that might contribute to increased insulin sensitivity (Table 1).
Discussion
PI 3-kinase activation is central to most of the metabolic actions of insulin (3). The major regulatory subunits of PI 3-kinase in most cells are p85α and its alternatively spliced isoforms AS53/p55α and p50α encoded by the Pik3r1 gene. In the present study, we have shown that reducing the level of p85α, AS53, and p50α by heterozygous disruption of the Pik3r1 gene results in increased insulin sensitivity, lower fasting and postprandial glucose levels, and a significant decrease in the incidence of diabetes related to genetically induced insulin resistance in mice.
Recently, Terauchi et al. reported that selective homozygous disruption of the p85α full-length form of regulatory subunit results in hypoglycemia and increased sensitivity to insulin (20). The authors suggested that this was a result of an isoform switch from p85α to p50α or AS53 in insulin-sensitive tissues and that p50α is more potent in activation of PI 3-kinase–dependent insulin signaling than is p85α. Since the expression levels of p85α, p50α, and AS53 are all reduced in the Pik3r1 knockout mouse, this mechanism cannot be responsible for the increased insulin sensitivity observed in the present study. Rather, changes in the molecular balance between p85 and p110 by heterozygous knockout of Pik3r1 appear to play a key role in this phenomenon. Indeed, immunodepletion studies reveal that in liver of wild-type mouse, 30% of p85 exits as a monomer that may compete with p85-p110 dimer in binding to phosphorylated IRS proteins, thereby inhibiting PI 3-kinase–dependent signaling. Heterozygous disruption of Pik3r1 decreases p85 monomer with only slight reduction of the amount of p85-p110 dimer. As a consequence, p85+/– mice group exhibits PI 3-kinase activities almost equal to those of mice with normal levels of p85α. Thus, heterozygous disruption of Pik3r1 increases the ratio of p85-p110 dimer to p85 monomer. This could improve insulin-induced PI 3-kinase signaling, depending on the balance between p85 and phosphorylated IRS proteins. For instance, if phosphorylated IRS proteins are less abundant than total p85 monomer and p85-p110 dimer in a p85+/– tissue, the increase in the ratio of p85-p110 dimer to p85 monomer by heterozygous disruption of Pik3r1 could improve PI 3-kinase signaling by increasing the amount of p85/p110/IRS complexes. However, if phosphorylated IRS proteins are more abundant than total p85 in wild-type, the increase of the ratio by heterozygous disruption of Pik3r1 might not affect PI 3-kinase–dependent signaling, because all of the p85-p110 dimers can bind IRS proteins even in the wild-type.
Following insulin injection, the improvement of PI 3-kinase–dependent signaling in mice with a heterozygous disruption of Pik3r1 was confirmed by increased Akt activity, at least in wild-type and IR/IRS-1+/– mice. Since under normal feeding conditions, phosphorylation levels of IRS proteins should be much lower than those caused by pharmacological insulin injection, the improvement of PI 3-kinase–dependent signaling leading to improved insulin sensitivity would be even more pronounced.
Heterozygous disruption of Pik3r1 also results in an increase in the PI 3-kinase activity associated with p85β, at least in liver of the mouse, and this may also contribute to the increased insulin sensitivity. We (24) and others (23, 35) have shown that p85α inhibits the lipid kinase activity of the p110 catalytic subunit in vitro. p85β appears to be less potent in this negative regulation, as evidenced by the finding that in Pik3r1-null mice PI 3-kinase activity associated with p85β maintains Akt activation, even though p85α is completely absent and p110 is markedly decreased (22).
In addition, p85α may modulate PI 3-kinase–dependent signaling by effects that are independent of its regulation of p110. For example, we find that in cultured cells derived from p85+/– mice, PI(3, 4, 5)P3 production is increased and the levels more sustained as compared with those in the wild-type cells, even though PI 3-kinase activity associated with phosphotyrosine complexes is equal in these two cell types (36). This suggests that p85α protein may have some effect to modulate PI(3, 4, 5)P3 clearance independent of its effect on PI 3-kinase activity (36). This could account for the 30% increase in Akt activity in livers of p85+/– and IR/IRS-1/p85+/– mice, since Akt activity depends on PI(3, 4, 5)P3 levels. Similarly, Terauchi et al. demonstrated that disrupting the full-length p85α alone, results in an increased and sustained PI(3, 4, 5)P3 production, although PI 3-kinase activity associated with phosphotyrosine complex is markedly decreased (20).
While the effect of reducing p85α levels on insulin sensitivity is clear, it remains to be determined which tissue is most important in this physiological response. In both isolated skeletal muscle (this study) and cultured brown adipocyte cell lines (K. Ueki et al., unpublished data), basal glucose uptake is increased in the p85+/– tissues as compared with controls, although no significant difference is observed in insulin-stimulated glucose uptake. This could contribute to lower fasting glucose levels. Lower fasting glucose levels may also reflect increased sensitivity to insulin-induced suppression of hepatic glucose output, since the enzyme phosphoenolpyruvate carboxykinase (PEPCK) is negatively regulated by insulin via a PI 3-kinase/Akt–mediated pathway (14, 15, 37), and increasing Akt activity in liver has been shown to lower glucose levels in insulin-resistant mice (28). Thus, insulin-induced inhibition of hepatic glucose production seems to be important for whole-body insulin sensitivity observed in p85+/– mice. However, in preliminary studies, we found no change in mRNA levels of PEPCK in the p85α heterozygous mice (data not shown). It is possible that any differences in PEPCK are too small to be detected or that the increased Akt activity in liver modifies other enzymes involved in hepatic glucose production, such as 6-phospho-fructose 2-kinase (38) and glycogen synthase kinase 3 (39). Further studies using cultured cells heterozygous for the Pik3r1-null allele would help characterize these issues.
In summary, reducing the expression level of p85α by 50% significantly improves insulin sensitivity and results in a decrease in the incidence of diabetes in mouse models of insulin resistance. This appears to be due to an improved stoichiometry of the p85/p110/IRS complex and enhanced PI 3-kinase–dependent signaling. Thus p85α can play a dual role in insulin action mediating PI 3-kinase activation by bridging IRS proteins and the catalytic p110 subunit, but it can also act as a competitive inhibitor in PI 3-kinase signaling in its monomeric state. Pharmacological modulation of p85α expression in insulin-sensitive tissues appears to be a novel strategy to improve insulin sensitivity and may serve as a new therapeutic target in the treatment of type 2 diabetes.
Acknowledgments
We are grateful to Karrie E. Miller for excellent technical assistance and Sandra Paquette for assistance in preparing this manuscript. This work was supported by NIH grants DK-33201 and DK-55545 to C.R. Kahn and GM-41890 to L.C. Cantley. D.A. Fruman was supported by fellowships from Damon Runyon-Walter Winchell Cancer Research Fund and the Leukemia Society of America.
Footnotes
Franck Mauvais-Jarvis and Kohjiro Ueki contributed equally to this work.
References
- 1.Kahn CR. Banting Lecture. Insulin action, diabetogenes, and the cause of type II diabetes. Diabetes. 1994; 43:1066–1084. doi: 10.2337/diab.43.8.1066. [DOI] [PubMed] [Google Scholar]
- 2.Dunaif A. Insulin action in the polycystic ovary syndrome. Endocrinol Metab Clin North Am. 1999; 28:341–359. doi: 10.1016/s0889-8529(05)70073-6. [DOI] [PubMed] [Google Scholar]
- 3.Shepherd PR, Withers DJ, Siddle K. Phosphoinositide 3-kinase: the key switch mechanism in insulin signaling. Biochem J. 1998; 333:471–490. doi: 10.1042/bj3330471. [DOI] [PMC free article] [PubMed] [Google Scholar]
- 4.Inukai K, et al. A novel 55-kDa regulatory subunit for phosphatidylinositol 3-kinase structurally similar to p55PIK is generated by alternative splicing of the p85a gene. J Biol Chem. 1996; 271:5317–5320. doi: 10.1074/jbc.271.10.5317. [DOI] [PubMed] [Google Scholar]
- 5.Antonetti DA, Algenstaedt P, Kahn CR. Insulin receptor substrate 1 binds two novel splice variants of the regulatory subunit of phosphatidylinositol 3-kinase in muscle and brain. Mol Cell Biol. 1996; 16:2195–2203. doi: 10.1128/mcb.16.5.2195. [DOI] [PMC free article] [PubMed] [Google Scholar]
- 6.Fruman DA, Cantley LC, Carpenter CL. Structural organization and alternative splicing of the murine phosphoinositide 3-kinase p85a gene. Genomics. 1996; 37:113–121. doi: 10.1006/geno.1996.0527. [DOI] [PubMed] [Google Scholar]
- 7.Inukai K, et al. p85a gene generates three isoforms of regulatory subunit for phosphatidylinositol 3-kinase (PI 3-kinase), p50a, p55a, and p85a, with different PI 3-kinase activity elevating responses to insulin. J Biol Chem. 1997; 272:7873–7882. doi: 10.1074/jbc.272.12.7873. [DOI] [PubMed] [Google Scholar]
- 8.Pons S, et al. The structure and function of p55PIK reveal a new regulatory subunit for phosphatidylinositol 3-kinase. Mol Cell Biol. 1995; 15:4453–4465. doi: 10.1128/mcb.15.8.4453. [DOI] [PMC free article] [PubMed] [Google Scholar]
- 9.Rameh LE, Cantley LC. The role of phosphoinositide 3-kinase lipid products in cell function. J Biol Chem. 1999; 274:8347–8350. doi: 10.1074/jbc.274.13.8347. [DOI] [PubMed] [Google Scholar]
- 10.Hara K, et al. 1-Phosphatidylinositol 3-kinase activity is required for insulin-stimulated glucose transport but not for RAS activation in CHO cells. Proc Natl Acad Sci USA. 1994; 91:7415–7419. doi: 10.1073/pnas.91.16.7415. [DOI] [PMC free article] [PubMed] [Google Scholar]
- 11.Cheatham B, et al. Phosphatidylinositol 3-kinase activation is required for insulin stimulation of pp70 S6 kinase, DNA synthesis, and glucose transporter translocation. Mol Cell Biol. 1994; 14:4902–4911. doi: 10.1128/mcb.14.7.4902. [DOI] [PMC free article] [PubMed] [Google Scholar]
- 12.Okada T, Kawano Y, Sakakibara T, Hazeki O, Ui M. Essential role of phosphatidylinositol 3-kinase in insulin-induced glucose transport and antilipolysis in rat adipocytes. Studies with a selective inhibitor wortmannin. J Biol Chem. 1994; 269:3568–3573. [PubMed] [Google Scholar]
- 13.Cross DA, Alessi DR, Cohen P, Andjelkovich M, Hemmings BA. Inhibition of glycogen synthase kinase-3 by insulin mediated by protein kinase B. Nature. 1995; 378:785–789. doi: 10.1038/378785a0. [DOI] [PubMed] [Google Scholar]
- 14.Gabbay RA, et al. Insulin regulation of phosphoenolpyruvate carboxykinase gene expression does not require activation of the Ras/mitogen-activated protein kinase signaling pathway. J Biol Chem. 1996; 271:1890–1897. doi: 10.1074/jbc.271.4.1890. [DOI] [PubMed] [Google Scholar]
- 15.Agati JM, Yeagley D, Quinn PG. Assessment of the roles of mitogen-activated protein kinase, phosphatidylinositol 3-kinase, protein kinase B, and protein kinase C in insulin inhibition of cAMP-induced phosphoenolpyruvate carboxykinase gene transcription. J Biol Chem. 1998; 273:18751–18759. doi: 10.1074/jbc.273.30.18751. [DOI] [PubMed] [Google Scholar]
- 16.Leibiger IB, Leibiger B, Moede T, Berggren PO. Exocytosis of insulin promotes insulin gene transcription via the insulin receptor/PI-3 kinase/p70 s6 kinase and CaM kinase pathways. Mol Cell. 1998; 1:933–938. doi: 10.1016/s1097-2765(00)80093-3. [DOI] [PubMed] [Google Scholar]
- 17.Anai M, et al. Altered expression levels and impaired steps in the pathway to phosphatidylinositol 3-kinase activation via insulin receptor substrates 1 and 2 in Zucker fatty rats. Diabetes. 1998; 47:13–23. doi: 10.2337/diab.47.1.13. [DOI] [PubMed] [Google Scholar]
- 18.Kerouz NJ, Horsch D, Pons S, Kahn CR. Differential regulation of insulin receptor substrates-1 and -2 (IRS-1 and IRS-2) and phosphatidylinositol 3-kinase isoforms in liver and muscle of the obese diabetic (ob/ob) mouse. J Clin Invest. 1997; 100:3164–3172. doi: 10.1172/JCI119872. [DOI] [PMC free article] [PubMed] [Google Scholar]
- 19.Bi L, Okabe I, Bernard DJ, Wynshaw-Boris A, Nussbaum RL. Proliferative defect and embryonic lethality in mice homozygous for a deletion in the p110alpha subunit of phosphoinositide 3-kinase. J Biol Chem. 1999; 274:10963–10968. doi: 10.1074/jbc.274.16.10963. [DOI] [PubMed] [Google Scholar]
- 20.Terauchi Y, et al. Increased insulin sensitivity and hypoglycaemia in mice lacking the p85a subunit of phosphoinositide 3-kinase. Nat Genet. 1999; 21:230–235. doi: 10.1038/6023. [DOI] [PubMed] [Google Scholar]
- 21.Fruman DA, et al. Impaired B cell development and proliferation in absence of phosphoinositide 3-kinase p85a. Science. 1999; 283:393–397. doi: 10.1126/science.283.5400.393. [DOI] [PubMed] [Google Scholar]
- 22.Fruman DA, et al. Hypoglycaemia, liver necrosis and perinatal death in mice lacking all isoforms of phosphoinositide 3-kinase p85a. Nat Genet. 2000; 26:379–382. doi: 10.1038/81715. [DOI] [PubMed] [Google Scholar]
- 23.Yu J, et al. Regulation of the p85/p110 phosphatidylinositol 3’-kinase: stabilization and inhibition of the p110alpha catalytic subunit by the p85 regulatory subunit. Mol Cell Biol. 1998; 18:1379–1387. doi: 10.1128/mcb.18.3.1379. [DOI] [PMC free article] [PubMed] [Google Scholar]
- 24.Ueki K, Algenstaedt P, Mauvais-Jarvis F, Kahn CR. Positive and negative regulation of phosphoinositide 3-kinase-dependent signaling pathways by three different gene products of the p85a regulatory subunit. Mol Cell Biol. 2000; 20:8035–8046. doi: 10.1128/mcb.20.21.8035-8046.2000. [DOI] [PMC free article] [PubMed] [Google Scholar]
- 25.Giorgino F, Pedrini MT, Matera L, Smith RJ. Specific increase in p85alpha expression in response to dexamethasone is associated with inhibition of insulin-like growth factor-I stimulated phosphatidylinositol 3-kinase activity in cultured muscle cells. J Biol Chem. 1997; 272:7455–7463. doi: 10.1074/jbc.272.11.7455. [DOI] [PubMed] [Google Scholar]
- 26.Bruning JC, et al. Development of a novel polygenic model of NIDDM in mice heterozygous for IR and IRS-1 null alleles. Cell. 1997; 88:561–572. doi: 10.1016/s0092-8674(00)81896-6. [DOI] [PubMed] [Google Scholar]
- 27.Bruning JC, et al. A muscle-specific insulin receptor knockout exhibits features of the metabolic syndrome of NIDDM without altering glucose tolerance. Mol Cell. 1998; 2:559–569. doi: 10.1016/s1097-2765(00)80155-0. [DOI] [PubMed] [Google Scholar]
- 28.Ueki K, et al. Restored insulin-sensitivity in IRS-1-deficient mice treated by adenovirus-mediated gene therapy. J Clin Invest. 2000; 105:1437–1445. doi: 10.1172/JCI7656. [DOI] [PMC free article] [PubMed] [Google Scholar]
- 29.Ueki K, et al. Potential role of protein kinase B in insulin-induced glucose transport, glycogen synthesis, and protein synthesis. J Biol Chem. 1998; 273:5315–5322. doi: 10.1074/jbc.273.9.5315. [DOI] [PubMed] [Google Scholar]
- 30.Coffer PJ, Jin J, Woodgett JR. Protein kinase B (c-Akt): a multifunctional mediator of phosphatidylinositol 3-kinase activation. Biochem J. 1998; 335:1–13. doi: 10.1042/bj3350001. [DOI] [PMC free article] [PubMed] [Google Scholar]
- 31.Boden G. Role of fatty acids in the pathogenesis of insulin resistance and NIDDM. Diabetes. 1997; 46:3–10. [PubMed] [Google Scholar]
- 32.Flier JS. Diabetes. The missing link with obesity? Nature. 2001; 409:292–293. doi: 10.1038/35053251. [DOI] [PubMed] [Google Scholar]
- 33.Zhang Y, et al. Positional cloning of the mouse obese gene and its human homologue. Nature. 1994; 372:425–432. doi: 10.1038/372425a0. [DOI] [PubMed] [Google Scholar]
- 34.Shimomura I, Hammer RE, Ikemoto S, Brown MS, Goldstein JL. Leptin reverses insulin resistance and diabetes mellitus in mice with congenital lipodystrophy. Nature. 1999; 401:73–76. doi: 10.1038/43448. [DOI] [PubMed] [Google Scholar]
- 35.Yu J, Wjasow C, Backer JM. Regulation of the p85/p110alpha phosphatidylinositol 3’-kinase. Distinct roles for the n-terminal and c-terminal SH2 domains. J Biol Chem. 1998; 273:30199–30203. doi: 10.1074/jbc.273.46.30199. [DOI] [PubMed] [Google Scholar]
- 36.Ueki, K., et al. 2001. Molecular balance between the regulatory and catalytic subunits of phosphoinositide 3-kinase regulates cell signaling and survival. Mol. Cell. Biol. In press. [DOI] [PMC free article] [PubMed]
- 37.Michael MD, et al. Loss of insulin signaling in hepatocytes leads to severe insulin resistance and progressive hepatic dysfunction. Mol Cell. 2000; 6:87–97. [PubMed] [Google Scholar]
- 38.Lefebvre V, Mechin MC, Louckx MP, Rider MH, Hue L. Signaling pathway involved in the activation of heart 6-phosphofructo-2-kinase by insulin. J Biol Chem. 1996; 271:22289–22292. doi: 10.1074/jbc.271.37.22289. [DOI] [PubMed] [Google Scholar]
- 39.Peak M, Rochford JJ, Borthwick AC, Yeaman SJ, Agius L. Signaling pathways involved in the stimulation of glycogen synthesis by insulin in rat hepatocytes. Diabetologia. 1998; 41:16–25. doi: 10.1007/s001250050861. [DOI] [PubMed] [Google Scholar]


