Abstract
We have demonstrated a microfabricated single-molecule DNA sizing device. This device does not depend on mobility to measure molecule size, is 100 times faster than pulsed-field gel electrophoresis, and has a resolution that improves with increasing DNA length. It also requires a million times less sample than pulsed-field gel electrophoresis and has comparable resolution for large molecules. Here we describe the fabrication and use of the single-molecule DNA sizing device for sizing and sorting DNA restriction digests and ladders spanning 2–200 kbp.
Many assays in biology require measurement of the length distribution of DNA molecules in a heterogeneous solution. This measurement is commonly done with gel electrophoresis; the molecules are separated by mobility, from which the lengths are inferred. This method is powerful, yet has some drawbacks. For medium to large DNA molecules the resolution is limited to approximately 10%. Gel electrophoresis is time consuming. It generally takes at least an hour to run the gel, not including the setup time to cast the gel. Furthermore, for large molecules the procedure fails. This problem has been alleviated to some extent by the development of pulsed-field gel electrophoresis (1), but running times can be days.
With the development of high affinity intercalating DNA stains (2), it has become possible to directly measure the length of single molecules by quantitating fluorescence. The amount of intercalated dye is proportional to the length of the molecule, so measuring the total fluorescent intensity from a single molecule gives a direct measurement of its length. This method in principle allows the measurement of extremely long DNA molecules because the signal increases with the length of the molecule. This technique has been used with traditional methods of flow cytometry to measure length distributions of DNA molecules (3, 4). Other groups have imaged restriction enzymes digesting extended single DNA molecules for “optical mapping” (5, 6).
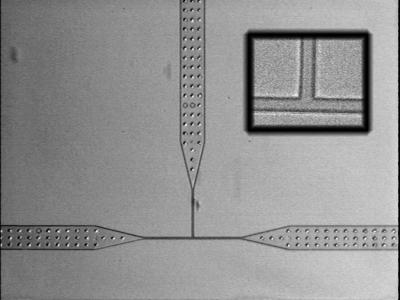
We have developed microfabricated devices to size and sort microscopic objects based on measurement of fluorescent properties. The devices have a network of microfluidic channels and are fabricated from a silicone elastomer by using a replica technique (7). Master molds are made from silicon wafers by using standard micromachining techniques. Because the molds can be reused indefinitely, this method of fabrication allows economical mass production of the devices. The devices were patterned as shown in Fig. 1. This fabrication technique is one of a new set of technologies known as soft lithography. Previous work has demonstrated that elastomers can replicate gratings and other test patterns with high (≈50 nm) resolution and fidelity (8, 9). Although some groups have made large (≈30 μm) elastomer structures for capillary electrophoresis (10), there is only one other example of a micron scale fluidic network with the elastomer (11).
Figure 1.
Optical micrograph of T-channel device. The large channels have lateral dimensions of 100 μm, which narrow down to 5 μm at the T junction. The depth of the channels is 3 μm. In early prototypes, we found that because of the large aspect ratio (100 μm in width by 3 μm in depth), some of the elastomer channels would bow and pinch off by sealing directly to the glass. This problem was remedied in later versions by adding support pillars to the mask that would prop up the large channels and prevent bowing. (Inset) Magnified view of T junction. The channels are 5 μm wide at this point. Note the high fidelity of the elastomer replica.
MATERIALS AND METHODS
Device Fabrication.
Negative master devices were fabricated in silicon and used as molds for the silicone elastomer. Contact photolithography was used to pattern the oxide surface of a silicon wafer, which then was etched by reactive ion etch (RIE) with a C2F6/CHF3 gas mixture. A 3-min O2 RIE was used to remove fluorocarbon polymer residue on the silicon surface. The oxide then was used as a mask for the silicon underneath, which was etched with KOH. The silicone elastomer (General Electric RTV 615) components were mixed together and pumped in an evacuated chamber for 30 min to remove air bubbles. The liquid elastomer then was poured on the mold and cured in an oven at 90°C for 2 hr. After this procedure, the devices could be peeled from the silicon master and would bond hermetically to glass. Number 1 coverslips were used to seal the devices.
The elastomer is naturally hydrophobic, preventing aqueous solution from entering the channels. The surfaces of the devices were modified by soaking in dilute HCl (pH 2.7, 0.01% in water) for 40 min at 43°C. After this treatment, the devices were hydrophilic, and aqueous solution would enter easily by capillary action. The devices could be cleaned and reused several times if desired. All of the data for this paper were taken with the same device. We have found that the geometry of the device does not affect reproducibility of the results; data taken from a device with slightly different channel dimensions were comparable. Results from run to run and day to day are highly reproducible; the histograms can be overlaid without adjusting any parameters and there is no need to recalibrate the apparatus.
Sample wells were created during the fabrication process by gluing small aluminum cylinders to the silicon wafer molds. The final elastomer devices were attached to a coverslip in such a way that the sample wells were only partially covered, which allowed access with a pipette tip for introduction of the sample and also provided convenient electrode insertion. The flow rate was determined by a balance between capillary action within the channels and electro-osmotic flow.
Experimental Apparatus.
A 10-mW air-cooled argon ion laser (Uniphase, San Jose, CA) emitting at 488 nm was used for fluorescent excitation. The laser was focused through a 60× 1.4 NA oil immersion objective, which also was used to collect the emitted fluorescence, on an upright microscope (Olympus BH-2, New Hyde Park, NY). Auxiliary lenses were used to adjust the focused spot to a full width half maximum of 30 μm. The large spot size was chosen to give uniform excitation across the width of the channel. The quality and uniformity of the spot was evaluated by imaging a thin layer of fluorescein in solution with a charge-coupled device camera. The image was digitized and evaluated for symmetry and Gaussian shape. Dielectric filters were used to filter laser tube fluorescence (CVI 488-nm line filter, CVI Laser, Albuquerque, NM) and to reduce background and scattered light from the emitted fluorescence (Chroma D535/50M, Chroma Technology, Brattleboro, VT). A dichroic filter was used to introduce the laser light into the optical train (Chroma 500 DCLP).
Fluorescence was imaged onto a 5-mm avalanche photodiode detector (Advanced Photonix, Camarillo, CA). The detector was cooled to −40° with a two-stage thermoelectric cooler (ITI 6320/157/040C, Chelmsford, MA), which reduced the dark current of the detector from 50 nA to 90 pA. The detector was reverse-biased at 2,450 V, giving a gain of 500. A transimpedance amplifier (Burr Brown OP128, Tucson, AZ) converted the photocurrent to a voltage at a gain of 100 mV/nA. A second stage amplifier provided additional voltage gain of 10. The signal was low-pass-filtered at 1.6 kHz and digitized at 5 kHz by a National Instruments (Austin, TX) Lab PC1200 board on a personal computer running labview.
The depth of focus of the microscope was checked by centering a 1-μm fluorescent bead in the laser beam. The detector output as a function of focal distance shows that the signal is essentially flat over a depth of 5 μm. The depth of the device channels was chosen to be 3 μm so that the DNA molecules always remained in the plane of focus of the microscope.
Sample Preparation.
Lambda phage DNA (GIBCO) was either digested with HindIII (GIBCO) or ligated with T4 ligase (New England Biolabs), then was diluted in buffer (Tris-EDTA, pH 6.8 with 5 mM NaCl) and stained with the intercalating dye YOYO-1 (Molecular Probes) at a stoichiometry of one dye molecule per 4 bp. Single molecules of DNA gave measurable pulses whose height corresponded to the length of the molecule. Pulses were collected in large batches and then analyzed off-line with custom software written for peak detection. One of the advantages of this device is the simplicity of the data processing: no fitting is needed. The analog signal from the avalanche photodiode is digitally low-pass-filtered (cutoff ≈300 Hz), and peak heights are extracted with a thresholding algorithm. The analysis is extremely efficient to implement in real time and can be done for DNA sorting applications, as described below.
RESULTS
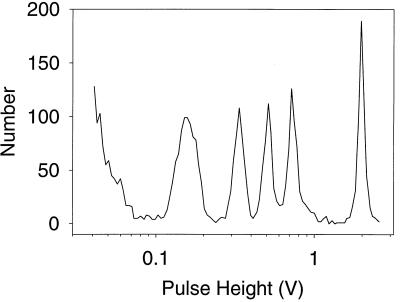
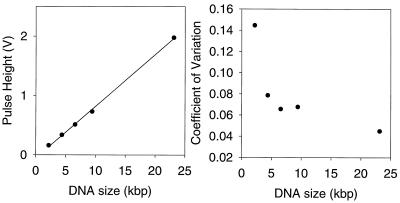
To test the utility of these devices for screening restriction digests, we analyzed a HindIII digest of λ DNA. A solution containing the stained digest was introduced to the device, and fluorescence was collected with a microscope and monitored with an avalanche photodiode. Fig. 2 shows a histogram of the observed peak heights. After collection of data for 10 min, the major fragments are clearly resolved. The 2- and 2.3-kbp pieces are not resolved from each other, but are well above the noise floor of the device. For larger fragments, the resolution is on the order of 5% and improves with the length of the molecule (Fig. 3). A notable feature of this method is that it requires very small amounts of sample: 28 femtograms of DNA were analyzed, about 3,000 molecules.
Figure 2.
Histogram of HindIII digest of λ DNA. The peaks represent (from right to left) fragments of length 23 kbp, 9 kbp, 6 kbp, 4 kbp, and an unresolved combination of 2 kbp and 2.3 kbp.
Figure 3.
Precision and resolution of HindIII digest. The histogram of Fig. 2 was fit with 5 Gaussians to estimate the precision and resolution of the measurement. (Left) The known sizes of the restriction fragments are compared with the fitted peak locations. The measurements are linear with a precision of a few percent. (Right) The widths of the peaks determine the resolution of the measurement. The coefficient of variation is the peak’s SD divided by its height and is an indication of the fractional resolution. Resolution improves with longer molecules. In both graphs, the error bars are smaller than the size of the data point symbols.
The detection volume for the single-molecule DNA sizing (SMS) devices is 375 femtoliters, more than an order of magnitude smaller than what has been achieved so far with flow cytometry. This small detection volume reduces the background signal proportionately. Furthermore, the geometry of the microfabricated devices allows the use of a high numerical aperture objective for efficient collection of the fluorescent light. DNA fragments of size 2 kbp, containing ≈500 fluorophores, were easily measured. The noise floor of the histogram for the HindIII digest indicates that the current sensitivity of the device is approximately 1 kbp.
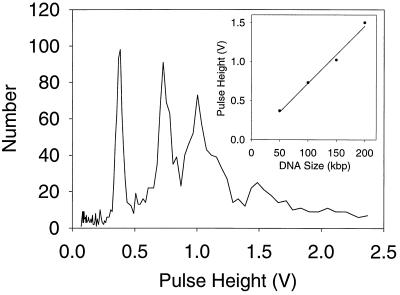
To determine the upper length limits of analysis in the device, we analyzed λ DNA ladders in the devices and have been able to detect molecules of up to 200 kbp (Fig. 4). That limit is determined solely by the geometry of the optical setup and does not represent an inherent limitation of the technology. As with the HindIII digest, about 3,000 molecules were analyzed in 10 min.
Figure 4.
Analysis of λ ladder. To test the upper length limit of the device, a λ ladder was analyzed. Peaks corresponding to 50, 100, 150, and 200 kbp can clearly be resolved. (Inset) The peak height measurement is linear even out to 200 kbp.
The microfabricated devices have several advantages over macroscopic systems, including design flexibility, size, cost, and sensitivity. An important example of this flexibility is that one can actively sort molecules in the microfabricated devices. By inserting electrodes in the sample wells and manipulating the DNA with electric fields, we have shown that molecules can be sent down one channel or the other at will. Speeds of 125 μm/sec were attained with an electric field of 20 V/cm. The response time of the DNA to a rapidly switching potential was faster than 30 msec, the video data acquisition rate. Thus, after detection, if the molecule passes a given criterion, a computer or circuit can be used to control the destiny of the molecule. The T channels can be cascaded to give an arbitrary number of bins in which the molecules can be collected. In contrast, the hydrodynamic focusing methods used in flow cytometry do not permit easy manipulation of the sample after detection.
DISCUSSION
We have shown that the SMS devices can be used for rapid, efficient sizing of DNA molecules ranging from 2 to 200 kbp. The operating time of 10 min is independent of the size of the DNA molecules being sorted and represents a significant improvement over gel electrophoresis. Furthermore, the devices require only tens of femtograms of DNA to operate, making it is possible to envision future applications in which SMS devices obviate the need for PCR.
By directly measuring length via fluorescent dye intercalation, SMS devices allow an absolute measurement of length which eliminates the need for sizing standard in each run. Finally, for gel electrophoresis the resolution decreases as the molecules being analyzed become longer. SMS has the opposite property: the longer the molecules, the better the signal to noise, and the fewer fluctuations because of the statistics of dye binding (Fig. 3). For the longest molecules in the lambda ladder (Fig. 4), the SMS resolution begins to degrade as a result of the optical setup: the molecules become bigger (or longer) than the region illuminated by the laser beam used to excite fluorescence. This problem can be easily remedied in the future, as applications require. The ultimate sizing limit probably will be determined by the ability of DNA molecules to survive fluid shear forces in the device.
There are several possible direct applications for SMS DNA sizing. Restriction fragment length polymorphism analysis and genetic mapping are amenable to analysis in these devices. Another important application is in the Human Genome Project. There has been a proposal to use bacterial artificial chromosome (BAC) libraries for human genome sequencing (12). This proposal requires restriction digest fingerprinting of 600,000 BAC clones, a slow and expensive task with current technology. SMS devices are capable of rapid, cheap restriction fingerprinting and mapping of BAC clones, which have a typical size of 200 kbp.
Because the devices are microfabricated, additional features could be added directly to the chip. It is easy to construct many devices in parallel on a chip, allowing rapid multiplex analysis of samples. One can envision future SMS devices with cascaded T channels capable of sorting fragments according to size and then recutting the individual fragments with different enzymes for ordered mapping, something that is not possible with electrophoretic or optical mapping techniques. Furthermore, because the detection system is all solid state and does not in principle require imaging optics, it should be possible to build an integrated SMS device with semiconductor laser excitation and detection on a single chip.
Acknowledgments
We thank Wayne Volkmuth for helpful discussions and contributions in the early stages of this work. This work was supported in part by the Powell Foundation and National Institutes of Health Grant HG01641-01.
ABBREVIATION
- SMS
single-molecule DNA sizing
References
- 1.Burmeister M, Ulanovsky L, editors. Pulsed-Field Gel Electrophoresis: Protocols, Methods, and Theories. Totowa, NJ: Humana; 1992. [Google Scholar]
- 2.Haugland R P. Handbook of Fluorescent Probes and Research Chemicals. Eugene, OR: Molecular Probes; 1996. [Google Scholar]
- 3.Castro A, Fairfield F R, Schera E B. Anal Chem. 1993;65:849–852. [Google Scholar]
- 4.Huang Z, Petty J T, Quinn O B, Longmire J L, Brown N C, Jett J H, Keller R A. Nucleic Acids Res. 1996;24:4202–4209. doi: 10.1093/nar/24.21.4202. [DOI] [PMC free article] [PubMed] [Google Scholar]
- 5.Guo X H, Huff E J, Schwartz D C. Nature (London) 1992;359:783–784. doi: 10.1038/359783a0. [DOI] [PubMed] [Google Scholar]
- 6.Cai W W, Jing J P, Irvin B, Ohler L, Rose E, Shizuya H, Kim U J, Simon M, Anantharaman T, Mishra B, Schwartz D C. Proc Natl Acad Sci USA. 1998;95:3390–3395. doi: 10.1073/pnas.95.7.3390. [DOI] [PMC free article] [PubMed] [Google Scholar]
- 7.Carlson R H, Gabel C V, Chan S S, Austin R H, Brody J P, Winkelman J W. Phys Rev Lett. 1997;79:2149–2152. [Google Scholar]
- 8.Jackman R J, Wilbur J L, Whitesides G M. Science. 1995;269:664–666. doi: 10.1126/science.7624795. [DOI] [PubMed] [Google Scholar]
- 9.Xia Y, Whitesides G M. Angew Chem Int Ed Engl. 1998;37:550–575. doi: 10.1002/(SICI)1521-3773(19980316)37:5<550::AID-ANIE550>3.0.CO;2-G. [DOI] [PubMed] [Google Scholar]
- 10.Effenhauser C S, Bruin G J M, Paulus A, Ehrat M. Anal Chem. 1997;69:3451–3457. doi: 10.1021/ac9703919. [DOI] [PubMed] [Google Scholar]
- 11.Delamarche E, Bernard A, Schmid H, Michel B, Biebuyck H. Science. 1997;276:779–781. doi: 10.1126/science.276.5313.779. [DOI] [PubMed] [Google Scholar]
- 12.Venter J C, Smith H O, Hood L. Nature (London) 1996;381:364–366. doi: 10.1038/381364a0. [DOI] [PubMed] [Google Scholar]


