Abstract
Myostatin is a TGF-β family member that acts as a negative regulator of muscle growth. Mice lacking the myostatin gene (Mstn) have a widespread increase in skeletal muscle mass resulting from a combination of muscle fiber hypertrophy and hyperplasia. Here we show that Mstn-null mice have a significant reduction in fat accumulation with increasing age compared with wild-type littermates, even in the setting of normal food intake (relative to body weight), normal body temperature, and a slightly decreased resting metabolic rate. To investigate whether myostatin might be an effective target for suppressing the development of obesity in settings of abnormal fat accumulation, we analyzed the effect of the Mstn mutation in two genetic models of obesity, agouti lethal yellow (Ay) and obese (Lepob/ob). In each case, loss of Mstn led to a partial suppression of fat accumulation and of abnormal glucose metabolism. Our findings raise the possibility that pharmacological agents that block myostatin function may be useful not only for enhancing muscle growth, but also for slowing or preventing the development of obesity and type 2 diabetes.
Introduction
The TGF-β superfamily is a large family of secreted growth and differentiation factors that play essential roles in regulating tissue development and homeostasis (1). Mutations in the signaling pathway of several family members cause diseases such as cancer, hereditary hemorrhagic telangiectasia, and primary pulmonary hypertension, demonstrating the importance of the family members to human health (2). In a search for novel TGF-β–related factors, we discovered a family member, myostatin (Mstn), that is specifically expressed in vertebrate skeletal muscle (3). Mstn is expressed in cells of the skeletal muscle lineage throughout embryogenesis beginning in the myotome compartment of developing somites. In adult tissues, Mstn is expressed predominantly in skeletal muscle and at significantly lower levels in adipose tissue. Mice carrying a targeted disruption of the Mstn gene have a dramatic increase in skeletal muscle mass throughout the body, with individual muscles weighing approximately twice as much as those of wild-type counterparts. This increase in muscle mass results from a combination of muscle fiber hypertrophy and hyperplasia.
The myostatin sequence has been highly conserved through evolution (4); in fact, the predicted myostatin protein sequence in the active portion of the molecule is identical among most mammalian and avian species that have been examined. In this region, the human myostatin is identical to the mouse myostatin amino acid sequence (4). The function of myostatin also appears to have been conserved, as mutations in the Mstn gene have been shown to be responsible for the double muscling phenotype in cattle (4–7). This raises the possibility that myostatin could be a potential therapeutic target for increasing skeletal muscle mass in human patients with muscle-wasting diseases such as cachexia from cancer and AIDS and the muscular dystrophies.
Proper skeletal muscle function is also important for maintenance of normal glucose metabolism (8–10). Skeletal muscle resistance to insulin-stimulated glucose uptake is the earliest known manifestation of non–insulin-dependent (type 2) diabetes mellitus (11–13). In this paper we show that loss of myostatin prevents an age-related increase in adipose tissue mass and partially attenuates the obese and diabetic phenotypes of two mouse models of obesity and diabetes, agouti lethal yellow (Ay) and obese (Lepob/ob). These results suggest that inhibition of myostatin signaling may be useful for the prevention or treatment of obesity and diabetes.
Methods
Animals.
The Mstn wild-type and null mice used were obtained from offspring of 129/SvJ founders that were backcrossed four to five times into the C57BL/6J strain. Ay and Lepob/+ mice in the C57BL/6J background were purchased from The Jackson Laboratory (Bar Harbor, Maine, USA).
Muscle weights.
Individual muscles (pectoralis, triceps, quadriceps, gastrocnemius/plantaris, and tibialis anterior) were dissected on one side of the body and weighed.
Fat analysis.
Fat pads were dissected according to the method of Johnson and Hirsch (14). Cell number was determined by fluorometry using either the left or the right side of the gonadal fat pad from 6-month-old mice. The other was fixed in formalin, embedded in paraffin, sectioned at 10 μm, and stained with hematoxylin and eosin. Total body fat from the entire bodies of 8-month-old males after exsanguination was determined as described (15).
Serum measurements.
Morning-fed glucose levels were determined using an Accu-Check glucose monitor in duplicate (Roche Diagnostics Corp., Indianapolis, Indiana, USA) using tail blood. For glucose tolerance experiments, 6-month-old male animals were fasted overnight. Glucose measurements were taken for 2–4 hours after intraperitoneal injection of 1 g of dextrose/kg body weight. Serum leptin in 8-month-old males was determined by RIA (Linco Research Inc., St. Charles, Missouri, USA). All other serum values were analyzed by Antech Diagnostics (New York, New York, USA) from blood samples taken by exsanguination from 6- to 7-month-old males. Values are expressed as average ± SE.
Food intake.
Male mice 5.5 months of age were individually housed and fed ad libitum. Food was weighed daily for 10 days.
Body temperature.
Temperatures of individually housed 5.5-month-old male mice were taken with a rectal thermometer at a depth of 1.5 cm (YSI Inc., Yellow Springs, Ohio, USA). For cold tolerance tests, mice were placed in precooled cages at 5°C and body temperatures were taken after 60 minutes.
Northern analysis.
Northern analysis was performed as described (16) using total RNA from tissues isolated from 4-month-old C57BL/6J male mice.
Indirect calorimetry.
Measurements of O2 consumption (vO2) were taken from 3-month-old males using a single-chamber Oxymax system (Columbus Instruments International Corporation, Columbus, Ohio, USA) with an O2 flow rate of 0.75 l/min. Measurements were taken for 1 minute at 7-minute intervals. Total vO2 corresponds to 30 measurements taken after animals were allowed to calm down for a period of 140 minutes. Resting vO2 was calculated by averaging the lowest five readings over this same interval.
Results
Decreased fat accumulation in Mstn–/– mice.
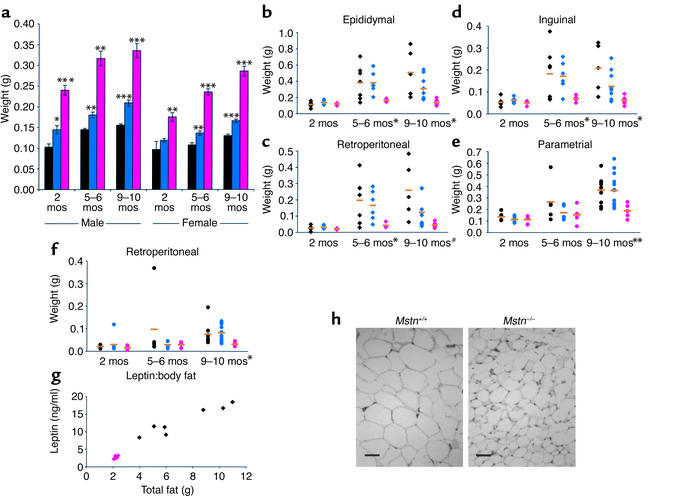
We previously reported that Mstn knockout mice have a widespread increase in skeletal muscle mass, leading to a 25–30% increase in overall body weight at 3–6 months of age (3). A comparison of Mstn+/+ and Mstn–/– male mice at older ages, however, revealed that, unlike Mstn+/+ mice, Mstn–/– mice did not continue to gain weight beyond 6 months of age, so that by 9–10 months of age, the total body weights of Mstn+/+ mice were comparable to those of Mstn–/– mice (data not shown). In order to determine whether the normalization of body weights between the two genotypes resulted from a normalization of muscle weights, we compared muscle weights of Mstn+/+ and Mstn–/– mice in the C57BL/6J background at various ages. As shown in Figure 1a for the triceps muscle (similar results were obtained for the pectoralis, quadriceps, gastrocnemius/plantaris, and tibialis anterior), differences in muscle weights were evident even at the youngest age examined (2 months) and were maintained in older animals. In addition, at all ages examined, mice heterozygous for the Mstn mutation had muscle weights that were intermediate between those of Mstn+/+ and Mstn–/– mice, suggesting that the effect of myostatin on muscle mass is dose-dependent.
Figure 1.
Mstn deletion suppresses fat accumulation. (a) Increased mass of triceps muscle in Mstn–/– mice at different ages (n = 4–13). Black, Mstn+/+; blue, Mstn+/–; pink, Mstn–/–. Data are expressed as mean ± SEM. (b–f) Mass of male epididymal (b), retroperitoneal (c), and inguinal (d), and female parametrial (e) and retroperitoneal (f) fat pads at different ages (n = 4–13). Orange bars designate the mean, and symbols designate individual animals colored as in a, with diamonds for males and circles for females. #P = 0.05, *P < 0.05, **P < 0.01, ***P < 0.001, Student’s t test. (g) Serum concentration of leptin to mass of total body fat in individual 8-month-old male mice. (h) Fat cell histology in epididymal fat pads. Scale bar = 50 μm.
Because normalization of body weights occurred even though differences in skeletal muscle weights continued to be maintained throughout the life of the animals, we investigated the possibility that the increase in body weight in older Mstn+/+ mice was due to a higher rate of fat accumulation. As shown in Figure 1, b–f, an analysis of individual fat pad weights revealed no differences between Mstn+/+ and Mstn–/– mice at 2 months of age. By 5–6 months, however, there was a significant difference in males, with individual fat pads of Mstn+/+ mice weighing on average 2.4–4.4 times those of Mstn–/– mice. By 9–10 months, fat pad weights in both male and female Mstn+/+ mice were spread over a large range, with fat pad weights in some animals increasing up to ninefold compared with those at 2 months of age. In contrast, every Mstn–/– mouse examined at 9–10 months remained lean with relatively little fat pad weight gain over the 7- to 8-month interval. In order to rule out the possibility that fat stores were simply redistributed in Mstn–/– mice, we measured total body fat. As shown in Figure 1g, the mean total body fat mass was reduced by 70% in Mstn–/– mice compared with Mstn+/+ mice. Serum leptin levels correlated with the amount of total body fat in individual animals and were therefore significantly lower in Mstn–/– mice (13.0 ± 1.6 ng/ml, Mstn+/+; 2.6 ± 0.2 ng/ml, Mstn–/–; P < 0.001) (Figure 1g). Hence, the differences in total body weight gain over time appeared to result from differences in fat accumulation.
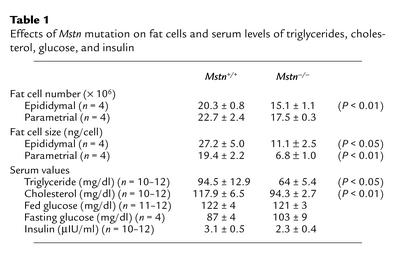
In order to determine whether the differences in fat pad weights reflected differences in fat cell number or cell size, we carried out a more detailed analysis of the gonadal fat pads. Mstn–/– mice had approximately 25% fewer gonadal fat pad cells than Mstn+/+ mice (Table 1). Cell size, however, was also affected, with the average weight of cells in the genital fat pad of Mstn–/– mice being approximately 40% that of Mstn+/+ mice (Table 1; Figure 1h). In addition to lower fat pad weights, adult male Mstn–/– mice also had significantly lower serum triglyceride and cholesterol levels than Mstn+/+ mice (Table 1). Blood glucose control seemed to be unaffected, however, as Mstn+/+ and Mstn–/– mice had similar insulin, fed glucose, and fasting glucose levels (Table 1). They also showed similar responses in glucose tolerance tests, with each reaching a maximum serum glucose value of approximately 220 mg/dl after 15 minutes and returning to base line 2 hours after glucose administration (data not shown).
Table 1.
Effects of Mstn mutation on fat cells and serum levels of triglycerides, cholesterol, glucose, and insulin
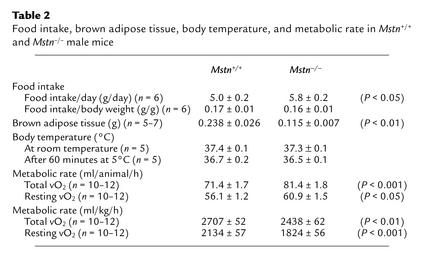
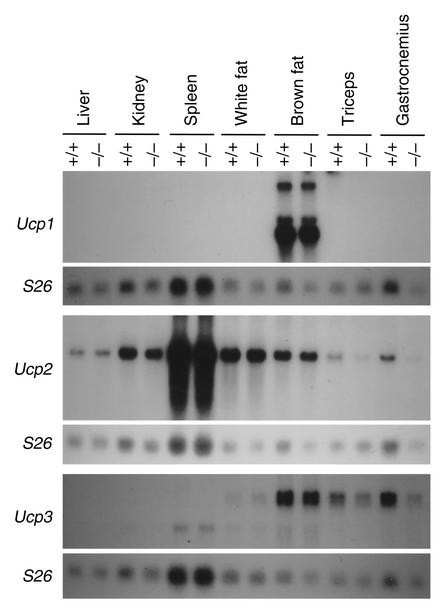
Mstn–/– mice failed to accumulate fat despite the fact that they did not have a decreased rate of food consumption. Food consumption in 5.5-month-old Mstn–/– mice was actually 16% greater than that in age-matched Mstn+/+ mice, although, when expressed as a percentage of body weight, food consumption was very similar between Mstn–/– and Mstn+/+ mice (Table 2). Body temperatures of Mstn–/– and Mstn+/+ mice either under normal conditions or in response to a 60-minute cold tolerance test were also similar, even though brown fat weights were reduced by approximately 50% in Mstn–/– mice (Table 2). We also examined expression levels of mRNAs encoding the uncoupling proteins, Ucp1, Ucp2, and Ucp3. The UCP proteins are mitochondrial inner membrane proteins that uncouple the proton gradient from ATP synthesis and have been implicated in thermogenesis (17). As shown in Figure 2, expression levels of each of these mRNAs were not increased in Mstn–/– mice as compared with Mstn+/+ mice. Expression levels of Ucp2 and Ucp3 in skeletal muscle were actually slightly decreased in Mstn–/– mice. Finally, we investigated the possibility that the reduced fat pad weights could be caused by an increase in metabolic rate in the knockout mice. As shown in Table 2, analysis of 6-month-old animals in a metabolic chamber revealed that Mstn–/– mice had higher rates of total and resting O2 consumption compared with Mstn+/+ mice (14% and 8% higher, respectively), which is expected given the higher body weights of Mstn–/– mice. If the data are expressed as a function of body weight, however, Mstn–/– mice actually had lower rates of total and resting O2 consumption compared with Mstn+/+ mice (10% and 15% lower, respectively) (Table 2). The respiratory exchange ratio, the ratio of CO2 produced to O2 consumed, in Mstn–/– mice was identical to that of Mstn+/+ mice (data not shown).
Table 2.
Food intake, brown adipose tissue, body temperature, and metabolic rate in Mstn+/+ and Mstn–/– male mice
Figure 2.
Expression of uncoupling proteins. Fifteen micrograms of total RNA isolated from various tissues in Mstn+/+ and Mstn–/– mice was electrophoresed, blotted, and probed with Ucp1, Ucp2, and Ucp3. Each blot was also hybridized with an S26 ribosomal protein probe as a loading control.
Suppression of obesity and glucose metabolism in Ay, Mstn–/– mice.
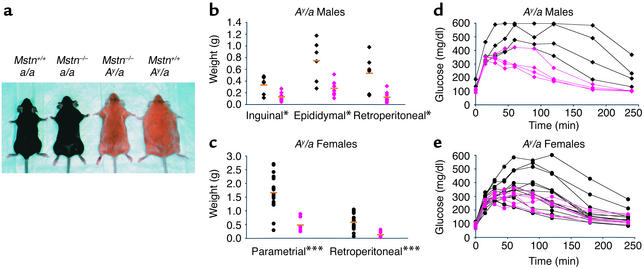
The lack of fat accumulation in Mstn–/– mice raised the possibility that inhibition of myostatin might be an effective method of suppressing the development of obesity in settings of abnormal fat accumulation. Therefore, we analyzed the effect of the Mstn mutation in mouse genetic models of obesity. Ay is a dominant mutation that causes obesity by increasing food intake and fuel efficiency (18, 19). The Ay mutation causes abnormal expression of agouti protein, which antagonizes melanocortin receptors in the hypothalamus (18, 19). As in a/a animals, individual muscle weights of Ay/a, Mstn–/– mice were approximately twice as high as those of Ay/a, Mstn+/+ mice (data not shown). Despite the increase in muscle mass, total body weights of Ay/a, Mstn–/– mice at 7 months of age were either comparable to (in the case of males) or actually lower than (in the case of females) those of age-matched Ay/a, Mstn+/+ mice (data not shown). As shown in Figure 3a, the appearance of adult female Ay/a, Mstn–/– mice was more similar to that of a/a, Mstn–/– mice than to that of Ay/a, Mstn+/+ mice. The reduced body weights and altered appearance of Ay/a, Mstn–/– mice resulted from a reduction in fat accumulation. Although individual fat pad weights were higher in Ay/a, Mstn–/– mice than in a/a, Mstn–/– mice, fat pads weighed less than half as much in Ay/a, Mstn–/– mice than in Ay/a, Mstn+/+ mice (Figure 3, b and c). Hence, the presence of the Mstn mutation partially suppressed the development of obesity in Ay/a mice.
Figure 3.
Mstn deletion partially suppresses fat accumulation and glucose intolerance in Ay mice. (a) Effect of Mstn deletion on appearance of a/a and Ay/a female mice. (b and c) Effects of Mstn deletion on fat pad weights in 7-month-old Ay male (b) (n = 6–9) and female (c) (n = 8–20) mice. Orange bars designate the mean, and symbols designate individual animals. Black, Ay/a, Mstn+/+; pink, Ay/a, Mstn–/–. Diamonds, males; circles, females. (d and e) Suppression of abnormality of glucose tolerance tests in male (d) (n = 4) and female (e) (n = 5–13) Mstn–/– mice. Symbols are as in b and c. Some measurements exceeded the upper detection limit of the glucose test (600 mg/dl). *P < 0.05, ***P < 0.001, Student’s t test.
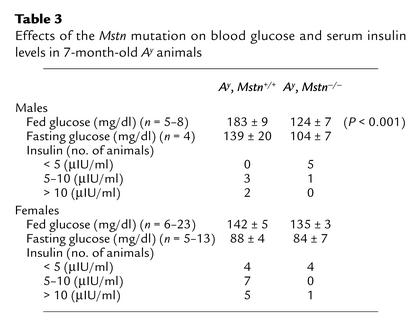
Loss of myostatin also affected glucose metabolism in Ay/a mice. Ay/a mice have been shown to develop insulin resistance and have therefore been used as a model for type 2 diabetes (18, 19). As described previously (18, 20, 21), male Ay/a, Mstn+/+ mice had elevated fed glucose and insulin levels (Table 3) compared with normal mice (Table 1) and had grossly abnormal serum glucose levels in response to a glucose tolerance test (Figure 3d). In contrast, virtually all Ay/a male mice that were also Mstn–/– had normal fed glucose and insulin levels (Table 3) and had dramatically lower glucose levels following an exogenous glucose load than Ay/a, Mstn+/+ mice (Figure 3d). Similar effects were also observed in female mice (Table 3; Figure 3e), although the abnormalities in glucose metabolism are known to be less severe in female Ay/a mice than in male Ay/a mice (20). Although the Mstn mutation did not completely eliminate the effects of the Ay/a mutation on glucose metabolism (glucose tolerance tests of Ay/a, Mstn–/– mice were still abnormal relative to those of a/a, Mstn+/+ and a/a, Mstn–/– mice), these results suggest that the Mstn mutation can have beneficial effects with respect to the development of type 2 diabetes in Ay/a mice.
Table 3.
Effects of the Mstn mutation on blood glucose and serum insulin levels in 7-month-old Ay animals
Suppression of obesity and glucose metabolism in Lepob/ob, Mstn–/– mice.
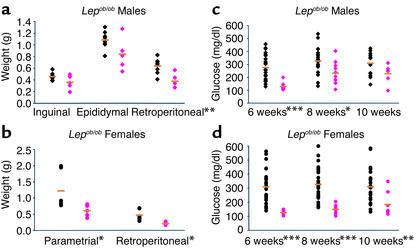
We also investigated the effects of the Mstn mutation in Lepob/ob mice. Loss of leptin signaling in Lepob/ob mice causes severe obesity as a result of improper regulation of food intake and energy expenditure (22, 23). Although some of the effects of leptin are known to be mediated through melanocortin receptor pathways, leptin is also known to have effects that are melanocortin-independent (24–26). The increase in muscle mass due to loss of myostatin was delayed in Lepob/ob mice as compared with Lep+/+ mice. Individual muscles were only 35–72% heavier in Lepob/ob, Mstn–/– mice than in Lepob/ob, Mstn+/+ mice at 8 weeks of age, although they were 100% heavier at 3 months of age (data not shown). Nevertheless, as in Ay/a mice, the Mstn mutation also suppressed fat accumulation in Lepob/ob mice, which was evident upon examination of individual fat pad weights. At 8 weeks of age, Lepob/ob, Mstn–/– mice had a statistically significant reduction in retroperitoneal and parametrial fat pad weights compared with Lepob/ob, Mstn+/+ mice (Figure 4, a and b). The Lepob/ob mutation is also known to cause abnormalities in glucose metabolism, which is most prominent in young mice (22). The Mstn deletion delayed the development of hyperglycemia in Lepob/ob mice of both sexes (Figure 4, c and d). In female Lepob/ob mice, the Mstn mutation completely suppressed the development of hyperglycemia in animals at 6 and 8 weeks of age, whereas the effect in male mice was most prominent at the youngest age examined (6 weeks).
Figure 4.
Mstn deletion partially suppresses fat accumulation and delays hyperglycemia in Lepob/ob mice. (a and b) Decrease in fat pad weights in male (a) (n = 5–8) and female (b) (n = 5–6) Lepob/ob, Mstn–/– 8-week-old mice. Orange bars designate the mean, and symbols designate individual animals. Black, Lepob/ob, Mstn+/+; pink, Lepob/ob, Mstn–/–. Diamonds, males; circles, females. (c and d) Suppression of abnormal fed glucose levels in Lepob/ob, Mstn–/– male (c) (n = 6–22) and female (d) (n = 8–26) mice. Symbols are as in a and b. *P < 0.05, **P < 0.01, ***P < 0.001, Student’s t test.
Discussion
Myostatin is a TGF-β family member that acts as a negative regulator of muscle growth. We previously showed that mice lacking myostatin have a dramatic and widespread increase in skeletal muscle growth (3). Here we have shown that deletion of Mstn affects adipose tissue mass in addition to skeletal muscle mass. Specifically, myostatin-deficient mice have a significant reduction in fat accumulation with increasing age, despite the fact that they have normal food intake, normal body temperature, and a slightly reduced metabolic rate.
Additional experiments will be required to elucidate the precise mechanism by which myostatin regulates fat metabolism. One possibility is that myostatin acts directly on adipose tissue. In support of a direct mechanism for myostatin action is the recent report that myostatin can inhibit differentiation of adipocytes in vitro (27). If myostatin is acting directly on adipocytes in vivo, myostatin could be acting either systemically or locally. Myostatin mRNA is known to be expressed in fat, although the expression levels are substantially lower in adipose tissue than in skeletal muscle (3).
A second possibility is that the effects of the myostatin mutation in adipose tissue are an indirect effect of the lack of myostatin signaling in skeletal muscle. It is possible, for example, that the anabolic effects of the Mstn mutation on skeletal muscle tissue per se may shift energy metabolites in such a manner as to prevent fat accumulation elsewhere in the body. Another possibility is that lack of myostatin signaling in muscle affects the activity of hypothetical second messengers (28) released by muscle that act on adipose tissue. Also, we cannot rule out the possibility that myostatin acts, directly or indirectly, on other tissues such as the CNS that then regulate adipose tissue.
In support of an indirect mechanism, similar effects on fat accumulation have been reported in other genetically altered mice that have increases in muscle mass. For example, transgenic mice overexpressing either IGF-1 (29) or ski (30) in skeletal muscle have been described as being virtually devoid of fat, although quantitative analyses were not reported. The opposite effect, namely, an increase in fat accumulation, has been reported in mice having decreased muscle mass as a result of a muscle-specific knockout of the insulin receptor gene (31).
An elucidation of the mechanism by which myostatin regulates fat metabolism in vivo ultimately will require the analysis of genetically manipulated animals in which components of the myostatin signaling pathway have been blocked specifically in either skeletal muscle or adipose tissue. In this regard, we have shown that myostatin can bind to the activin type II receptors, Act RIIA and Act RIIB, in vitro and that transgenic mice expressing a dominant negative form of Act RIIB in skeletal muscle have dramatic increases in skeletal muscle mass comparable to those seen in myostatin knockout mice (32). Preliminary analysis of fat pads has shown that these transgenic mice also have decreased fat accumulation, which would be consistent with an indirect effect of myostatin on adipose tissue (our preliminary results). However, the interpretation of these data is complicated by the fact that although a skeletal muscle–specific myosin light chain promoter/enhancer was used to drive expression of the mutant receptor, expression of the transgene was also detected in adipose tissue (our preliminary results). Although the expression level of the transgene in adipose tissue was extremely low compared with the level in skeletal muscle, it is possible that this low-level expression was sufficient to block myostatin signaling in fat.
Whatever the mechanism by which myostatin regulates fat metabolism, we have demonstrated that loss of myostatin activity can have beneficial metabolic effects in two genetic models of obesity and type 2 diabetes. Specifically, we have shown that the myostatin mutation can partially suppress both fat accumulation and the development of hyperglycemia in both Ay and Lepob/ob mice. Although the role of myostatin in humans has yet to be elucidated, our findings raise the possibility that myostatin inhibitors may be useful agents for the prevention or treatment of metabolic disorders such as obesity and type 2 diabetes.
Acknowledgments
This work was supported by NIH grant R01HD35887 and by a grant from American Home Products (to S.-J. Lee). We thank Paul Dunlap for assistance with the metabolic rate determinations and Dan Lane, Monica Kumar, Randall Reed, and Mosi Beckett for the Ucp3 and S26 probes. Myostatin was licensed by Johns Hopkins University to MetaMorphix Inc. (MMI) and sublicensed to American Home Products. The authors are entitled to a share of sales royalty received by the University from sales of this factor. The authors and the University own MMI stock, which is subject to certain restrictions under University policy. S.-J. Lee is a consultant to MMI. The terms of these arrangements are being managed by the University in accordance with its conflict-of-interest policies.
References
- 1.McPherron, A.C., and Lee, S.-J. 1996. The transforming growth factor β superfamily. In Growth factors and cytokines in health and disease. Volume 1B. D. LeRoith and C. Bondy, editors. JAI Press Inc. Greenwich, Connecticut, USA. 357–393.
- 2.Massagué J, Blain SW, Lo RS. TGFβ signaling in growth control, cancer, and heritable disorders. Cell. 2000;103:295–309. doi: 10.1016/s0092-8674(00)00121-5. [DOI] [PubMed] [Google Scholar]
- 3.McPherron AC, Lawler AM, Lee S-J. Regulation of skeletal muscle mass in mice by a new TGF-β superfamily member. Nature. 1997;387:83–90. doi: 10.1038/387083a0. [DOI] [PubMed] [Google Scholar]
- 4.McPherron AC, Lee S-J. Double muscling in cattle due to mutations in the myostatin gene. Proc Natl Acad Sci USA. 1997;94:12457–12461. doi: 10.1073/pnas.94.23.12457. [DOI] [PMC free article] [PubMed] [Google Scholar]
- 5.Kambadur R, Sharma M, Smith TPL, Bass JJ. Mutations in myostatin (GDF8) in double-muscled Belgian Blue and Piedmontese cattle. Genome Res. 1997;7:910–915. doi: 10.1101/gr.7.9.910. [DOI] [PubMed] [Google Scholar]
- 6.Grobet L, et al. A deletion in the bovine myostatin gene causes the double-muscled phenotype in cattle. Nat Genet. 1997;17:71–74. doi: 10.1038/ng0997-71. [DOI] [PubMed] [Google Scholar]
- 7.Grobet L, et al. Molecular definition of an allelic series of mutations disrupting the myostatin function and causing double-muscling in cattle. Mamm Genome. 1998;9:210–213. doi: 10.1007/s003359900727. [DOI] [PubMed] [Google Scholar]
- 8.Kadowaki T. Insights into insulin resistance and type 2 diabetes from knockout mouse models. J Clin Invest. 2000;106:459–465. doi: 10.1172/JCI10830. [DOI] [PMC free article] [PubMed] [Google Scholar]
- 9.Mueckler M. Insulin resistance and the disruption of Glut4 trafficking in skeletal muscle. J Clin Invest. 2001;107:1211–1213. doi: 10.1172/JCI13020. [DOI] [PMC free article] [PubMed] [Google Scholar]
- 10.Reaven G. Pathophysiology of insulin resistance in human disease. Physiol Rev. 1995;75:473–486. doi: 10.1152/physrev.1995.75.3.473. [DOI] [PubMed] [Google Scholar]
- 11.Martin BC, et al. Role of glucose and insulin resistance in development of type 2 diabetes mellitus: results of a 25-year follow-up study. Lancet. 1992;340:925–929. doi: 10.1016/0140-6736(92)92814-v. [DOI] [PubMed] [Google Scholar]
- 12.Lillioja S, et al. Insulin resistance and insulin secretory dysfunction as precursors of non-insulin-dependent diabetes mellitus. N Engl J Med. 1993;329:1988–1992. doi: 10.1056/NEJM199312303292703. [DOI] [PubMed] [Google Scholar]
- 13.Kahn CR. Insulin action, diabetogenes, and the cause of type II diabetes. Diabetes. 1994;43:1066–1084. doi: 10.2337/diab.43.8.1066. [DOI] [PubMed] [Google Scholar]
- 14.Johnson PR, Hirsch J. Cellularity of adipose depots in six strains of genetically obese mice. J Lipid Res. 1972;13:2–11. [PubMed] [Google Scholar]
- 15.Leshner AI, Littwin VA, Squibb RL. A simple method for carcass analysis. Physiol Behav. 1972;9:281–282. doi: 10.1016/0031-9384(72)90251-x. [DOI] [PubMed] [Google Scholar]
- 16.McPherron AC, Lee S-J. GDF-3 and GDF-9: two new members of the transforming growth factor-β superfamily containing a novel pattern of cysteines. J Biol Chem. 1993;268:3444–3449. [PubMed] [Google Scholar]
- 17.Lowell BB, Spiegelman BM. Towards a molecular understanding of adaptive thermogenesis. Nature. 2000;404:652–660. doi: 10.1038/35007527. [DOI] [PubMed] [Google Scholar]
- 18.Moustaïd Moussa N, Claycombe KJ. The yellow mouse obesity syndrome and mechanisms of agouti-induced obesity. Obes Res. 1999;7:506–514. doi: 10.1002/j.1550-8528.1999.tb00440.x. [DOI] [PubMed] [Google Scholar]
- 19.Dinulescu DM, Cone RD. Agouti and agouti-related protein: analogies and contrasts. J Biol Chem. 2000;275:6695–6698. doi: 10.1074/jbc.275.10.6695. [DOI] [PubMed] [Google Scholar]
- 20.Carpenter KJ, Mayer J. Physiologic observations on yellow obesity in the mouse. Am J Physiol. 1958;193:499–504. doi: 10.1152/ajplegacy.1958.193.3.499. [DOI] [PubMed] [Google Scholar]
- 21.Masuzaki J, et al. Glucose metabolism and insulin sensitivity in transgenic mice overexpressing leptin with lethal yellowagouti mutation. Diabetes. 1999;48:1615–1622. doi: 10.2337/diabetes.48.8.1615. [DOI] [PubMed] [Google Scholar]
- 22.Coleman DL. Obese and diabetes: two mutant genes causing diabetes-obesity syndromes in mice. Diabetologia. 1978;14:141–148. doi: 10.1007/BF00429772. [DOI] [PubMed] [Google Scholar]
- 23.Schwartz MW, et al. Central nervous system control of food intake. Nature. 2000;404:661–671. doi: 10.1038/35007534. [DOI] [PubMed] [Google Scholar]
- 24.Boston BA, Blaydon KM, Varnerin J, Cone RD. Independent and additive effects of central POMC and leptin pathways on murine obesity. Science. 1997;278:1641–1644. doi: 10.1126/science.278.5343.1641. [DOI] [PubMed] [Google Scholar]
- 25.Friedman JM, Halaas JL. Leptin and the regulation of body weight in mammals. Nature. 1998;395:763–770. doi: 10.1038/27376. [DOI] [PubMed] [Google Scholar]
- 26.Marsh DJ, et al. Response of melanocortin-4 receptor-deficient mice to anorectic and orexigenic peptides. Nat Genet. 1999;21:119–122. doi: 10.1038/5070. [DOI] [PubMed] [Google Scholar]
- 27.Kim HS, et al. Inhibition of preadipocyte differentiation by myostatin treatment in 3T3-L1 cultures. Biochem Biophys Res Commun. 2001;281:902–906. doi: 10.1006/bbrc.2001.4435. [DOI] [PubMed] [Google Scholar]
- 28.Mauvais-Jarvis F, et al. A model to explore the interaction between muscle insulin resistance and β-cell dysfunction in the development of type 2 diabetes. Diabetes. 2000;49:2126–2134. doi: 10.2337/diabetes.49.12.2126. [DOI] [PubMed] [Google Scholar]
- 29.Musarò A, et al. Localized Igf-1 transgene expression sustains hypertrophy and regeneration in senescent skeletal muscle. Nat Genet. 2001;27:195–200. doi: 10.1038/84839. [DOI] [PubMed] [Google Scholar]
- 30.Sutrave P, Kelly AM, Hughes SH. skican cause selective growth of skeletal muscle in transgenic mice. Genes Dev. 1990;4:1462–1472. doi: 10.1101/gad.4.9.1462. [DOI] [PubMed] [Google Scholar]
- 31.Brüning JC, et al. A muscle-specific insulin receptor knockout exhibits features of the metabolic syndrome of NIDDM without altering glucose tolerance. Mol Cell. 1998;2:559–569. doi: 10.1016/s1097-2765(00)80155-0. [DOI] [PubMed] [Google Scholar]
- 32.Lee S-J, McPherron AC. Regulation of myostatin activity and muscle growth. Proc Natl Acad Sci USA. 2001;98:9306–9311. doi: 10.1073/pnas.151270098. [DOI] [PMC free article] [PubMed] [Google Scholar]


