Abstract
Acyl coenzyme A:diacylglycerol acyltransferase 1 (DGAT1) is one of two known DGAT enzymes that catalyze the final step in mammalian triglyceride synthesis. DGAT1-deficient mice are resistant to diet-induced obesity through a mechanism involving increased energy expenditure. Here we show that these mice have decreased levels of tissue triglycerides, as well as increased sensitivity to insulin and to leptin. Importantly, DGAT1 deficiency protects against insulin resistance and obesity in agouti yellow mice, a model of severe leptin resistance. In contrast, DGAT1 deficiency did not affect energy and glucose metabolism in leptin-deficient (ob/ob) mice, possibly due in part to a compensatory upregulation of DGAT2 expression in the absence of leptin. Our results suggest that inhibition of DGAT1 may be useful in treating insulin resistance and leptin resistance in human obesity.
Introduction
Because obesity results from an imbalance between energy input and output, with most of the excess calories stored as triglycerides (or triacylglycerols), inhibition of triglyceride synthesis may prevent or reverse obesity (1). One of the key enzymes in triglyceride synthesis is acyl coenzyme A:diacylglycerol acyltransferase (acyl CoA:diacylglycerol acyltransferase, or DGAT), which catalyzes the final step in mammalian triglyceride synthesis. Two DGAT enzymes (DGAT1 and DGAT2) have been identified (2, 3). DGAT1 activity is widely distributed, and its gene (Dgat1) is expressed in all tissues examined (2). To investigate the effects of disrupting triglyceride synthesis on energy and glucose metabolism, we generated DGAT1-deficient (Dgat1–/–) mice (4). Dgat1–/– mice have triglycerides in their adipose tissue and normal plasma triglyceride levels. The residual triglyceride synthesis presumably occurs through the actions of DGAT2 and perhaps additional mechanisms of triglyceride synthesis (5). Dgat1–/– mice are resistant to diet-induced obesity because of increased energy expenditure. This increase is partially mediated by a twofold increase in physical activity in Dgat1–/– mice fed a high-fat diet. These mice also tend to have enhanced glucose disposal after a glucose load on either a chow or a high-fat diet (4).
How does DGAT1 deficiency affect energy and glucose metabolism? One plausible mechanism is by modulating tissue triglyceride metabolism. Increased triglyceride content in tissues such as skeletal muscle and liver correlates with insulin resistance (6–8). Moreover, increased adiposity is associated with resistance to leptin, an adipocyte-derived hormone that enhances energy expenditure and insulin sensitivity (9, 10). Because DGAT1 deficiency in mice is not associated with a compensatory increase in DGAT2 mRNA expression (3), we hypothesized that Dgat1–/– mice have reduced levels of tissue triglycerides and that these reductions are associated with increased sensitivity to insulin and to leptin. To test this hypothesis, we measured tissue triglyceride levels in Dgat1–/– mice, and we performed hyperinsulinemic-euglycemic clamp and leptin infusion studies. We also studied the effects of DGAT1 deficiency on energy and glucose metabolism in agouti yellow (AY/a) and leptin-deficient (ob/ob) mice, two genetic models of obesity and insulin resistance. Our findings provide new insights into how alterations in triglyceride synthesis affect insulin and leptin sensitivity.
Methods
Mice.
Dgat1–/– mice (∼95% C57BL/6 and 5% 129/SvJae background) were generated previously (4). Wild-type (Dgat1+/+), ob/+, and AY/a mice (all in C57BL/6 background) were from the The Jackson Laboratory (Bar Harbor, Maine, USA). AY/a mice are obese and insulin resistant, reflecting the antagonism of melanocyte-stimulating hormone in the hypothalamus (11). They are also severely leptin resistant (12). Genotyping for Dgat1 and ob was performed as described (4, 13). AY/a mice were identified by their yellow fur. Mice were housed in a pathogen-free barrier facility (12-hour light/12-hour dark cycle) and fed rodent chow (Ralston Purina Co., St. Louis, Missouri, USA). For high-fat diet experiments, mice were fed a Western-type diet containing 21% fat by weight (Harlan Teklad Laboratory, Madison, Wisconsin, USA) for 4 weeks unless stated otherwise. All experiments were approved by the Committee on Animal Research of the University of California, San Francisco.
Tissue lipid analysis.
Tissue lipids were extracted and separated by TLC as described (4). Triglycerides and diacylglycerol were scraped from the TLC plate, and heptadecanoic acid (∼10% of total fatty acids) was added as an internal standard. Methyl esters were synthesized with the addition of methanolic HCl/toluene (4:1 vol/vol) to the TLC adsorbent for 12 hours at 37°C, extracted with hexane, and analyzed with gas-liquid chromatography (HP6890 Gas Chromatograph; Hewlett-Packard, Palo Alto, California, USA). Methyl esters were separated with a 10-ft glass column (10% SP-2330 on 100/120 Chromosorb WAW; Supelco, St. Louis, Missouri, USA) at 175°C for 5 minutes and increasing to 210°C at a rate of 2.5°C/min. The weight of triglycerides and diacylglycerol in the samples was calculated with reference to the internal standard.
Adipocyte size determination.
Adipose tissue was obtained from the reproductive fat pads of 14-week-old male mice. The samples were fixed in paraformaldehyde, embedded in paraffin, cut into 5-μm sections, and stained with hematoxylin and eosin. Images of the histology sections were analyzed with Adobe Photoshop 5.0.1 (Adobe Systems Inc., San Jose, California, USA) and Image Process Tool Kit (Reindeer Games, Gainesville, Florida, USA) as described (14).
Glucose metabolism studies.
Glucose (1 g/kg body wt) or bovine insulin (1 U/kg body wt; Sigma Chemical Co., St. Louis, Missouri, USA) was injected intraperitoneally, and glucose concentrations were measured with a glucometer (Accu-Chek; Roche Diagnostics Corp., Indianapolis, Indiana, USA). The hyperinsulinemic-euglycemic clamp studies were performed as described (15) with slight modifications. Weight-matched 10- to 14-week-old male mice were fasted for 4 hours before the clamp studies. Insulin was infused at 20 mU/kg/min, and plasma glucose concentration was clamped at 120 mg/dl. For ob/ob and AY/a mice, nonfasting blood samples for glucose and insulin measurements were obtained at noon. Insulin was measured with a rat insulin RIA kit (Linco Research Inc., St. Charles, Missouri, USA).
Leptin infusion studies.
Mice were infused with recombinant human leptin (gift from F. Chehab, University of California, San Francisco) with a microosmotic pump (Alza model 1002; DURECT Corp., Cupertino, California, USA) inserted subcutaneously into the interscapular region. Plasma leptin levels were measured by AniLytics Inc. (Gaithersburg, Maryland, USA).
Northern blots.
White adipose tissue (WAT) was obtained from the reproductive fat pads and brown adipose tissue (BAT) from the interscapular region of 10- to 14-week-old male mice. Total RNA was isolated, and pooled RNA samples (10 μg) were subjected to electrophoresis and blot hybridization with 32P-labeled cDNA probes. Blots were rehybridized with a β-actin probe (Ambion Inc., Austin, Texas, USA) for loading normalization. Probes for uncoupling protein 2 (UCP-2) and UCP-3 were generated by PCR with WAT cDNA and the following primers: 5′-GTCGATTCCGCCCTCGGTG-3′, 5′-GAGGGAAAGTGATGAGATCT-3′ (UCP-2); 5′-GTCGGACACAGCCTTCTGC-3′, 5′-ACCTTGGACCGCCAGCCGG-3′ (UCP-3). The remaining probes were gifts from M. Reitman, NIH, Bethesda, Maryland, USA (UCP-1); B. Staels, Institut National de la Santé et de la Recherche Médicale (Lille, France) (acyl CoA oxidase); B. Spiegelman, Dana-Farber Cancer Institutes, Boston, Massachusetts, USA (peroxisome proliferator-activated receptor γ); and I. Shimomura, M. Brown, and J. Goldstein, University of Texas Southwestern, Dallas, Texas, USA (fatty acid synthase). Signals were quantified with a PhosphorImager (Bio-Rad Laboratories, Hercules, California, USA).
Real-time PCR.
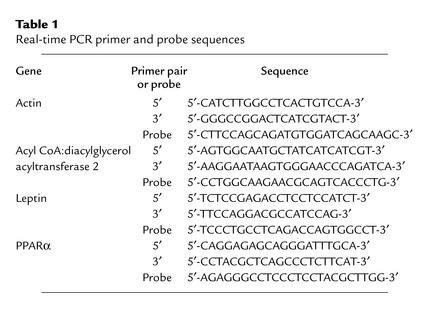
Tissues were homogenized, and total RNA was extracted. RNA (1 μg) was reverse-transcribed in a 20-μl reaction containing oligo(dT)12–18 primer and Superscript II enzyme (Invitrogen Corp., Carlsbad, California, USA). Primer and probe sequences (Table 1) were selected with Primer Express (Perkin-Elmer Applied Biosystems, Foster City, California, USA). The PCR reaction (50 μl) contained 1 μl of cDNA, 1× Gold buffer, 4 mM MgCl2, 500 μM dNTP, primers (200 nM), 100 nM probe (labeled with 6-carboxyfluorescein), and 1.25 U of AmpliTaq Gold DNA polymerase (Perkin-Elmer Applied Biosystems). Real-time PCR was performed with the ABI Prism 7700 System (Perkin-Elmer Applied Biosystems). Expression levels were calculated by the comparative cycle of threshold detection method, according to the manufacturer. Expression of β-actin was used for loading normalization.
Table 1.
Real-time PCR primer and probe sequences
Statistical methods.
Data are shown as mean ± SD unless stated otherwise. Measurements were compared with the t test or Mann-Whitney rank-sum test. Differences in body weight or food intake were compared with ANOVA, followed by the Tukey-Kramer test.
Results
Altered lipid composition in tissues of Dgat1–/– mice.
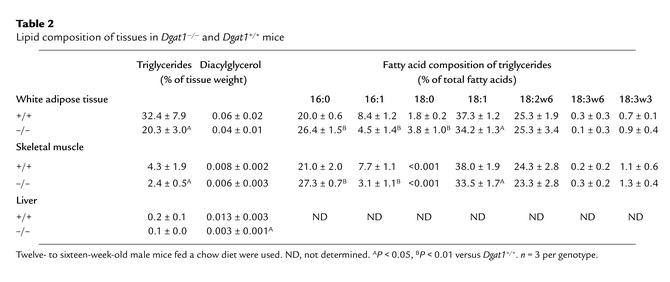
We hypothesized that DGAT1 deficiency results in decreased tissue triglyceride content. Indeed, Dgat1–/– mice had a 30–40% reduction of triglyceride levels in WAT and skeletal muscle (Table 2). Liver triglyceride levels trended lower in chow-fed Dgat1–/– mice, although the difference was not statistically significant. On a high-fat diet, however, Dgat1–/– mice had significantly lower liver triglyceride levels than Dgat1+/+ mice (28 ± 16 versus 157 ± 28 mg/g tissue weight, P < 0.05). Unexpectedly, levels of diacylglycerol, a substrate for the DGAT reaction, were not elevated, and in fact tended to be lower in Dgat1–/– tissues (Table 2). DGAT1 deficiency also altered the fatty acid composition of triglycerides in WAT and skeletal muscle, resulting in a relative decrease in monounsaturated (16:1 and 18:1) fatty acids and a relative increase in saturated (16:0 and 18:0) fatty acids (Table 2).
Table 2.
Lipid composition of tissues in Dgat1–/– and Dgat1+/+ mice
Decreased adipocyte size in Dgat1–/– mice.
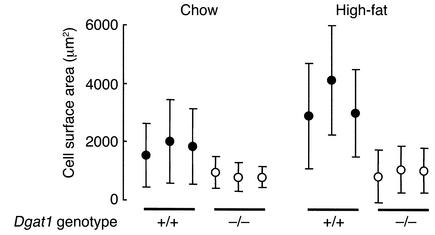
Concomitant with the decreased triglyceride levels in WAT, Dgat1–/– mice had smaller adipocytes than Dgat1+/+ mice on both chow and high-fat diets (Figure 1). Adipocytes from Dgat1–/– mice developed minimal hypertrophy in response to a high-fat diet, whereas those from Dgat1+/+ mice doubled in size. This protection from diet-induced adipocyte hypertrophy in Dgat1–/– mice mirrored their weight response to a high-fat diet (4). In addition to having smaller adipocytes, male Dgat1–/– mice had a lower mean DNA content in reproductive fat pads than Dgat1+/+ mice (169 ± 36 versus 273 ± 50 μg/fat pad, P < 0.05), suggesting that Dgat1–/– mice also had fewer adipocytes.
Figure 1.
Decreased adipocyte size in Dgat1–/– mice. Each circle represents the mean adipocyte surface area of one female mouse. More than 100 adipocytes were measured per mouse. For high-fat experiments, mice were fed a high-fat diet for 10 weeks.
Increased insulin sensitivity in Dgat1–/– mice.
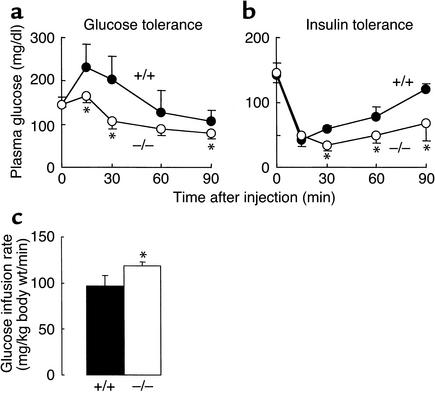
Previous studies in Dgat1–/– mice suggested that they have enhanced glucose disposal (4). To address this further, we performed glucose- and insulin-tolerance tests. Dgat1–/– mice had lower plasma glucose concentrations than Dgat1+/+ mice after a glucose load (Figure 2a) or an insulin injection (Figure 2b), suggesting that Dgat1–/– mice have increased insulin sensitivity. This was confirmed in hyperinsulinemic-euglycemic clamp studies, which showed that Dgat1–/– mice required an approximately 20% higher glucose infusion rate than Dgat1+/+ mice to maintain euglycemia (Figure 2c).
Figure 2.
Increased insulin sensitivity in Dgat1–/– mice. (a) Glucose tolerance test. (b) Insulin tolerance test. (c) Hyperinsulinemic-euglycemic clamp study. n = 5–6 chow-fed male mice per genotype in each experiment. *P < 0.05 versus Dgat1+/+ mice.
Increased weight loss in response to leptin infusion in Dgat1–/– mice.
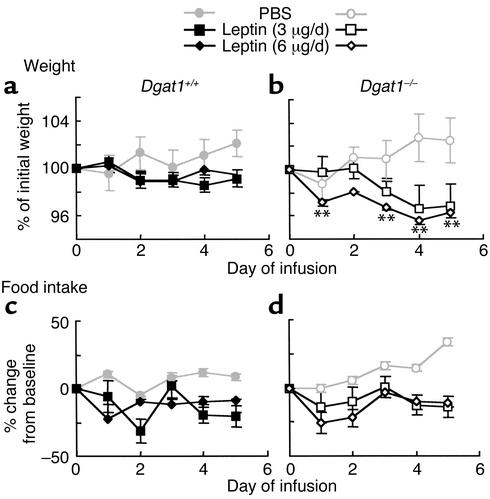
We hypothesized that the decreased tissue triglyceride content in Dgat1–/– mice resulted in an increased sensitivity to leptin. To test this hypothesis, we infused leptin subcutaneously into Dgat1+/+ mice and Dgat1–/– mice and measured their response in body weight and food intake. Leptin infusion achieved comparable levels of increase in plasma leptin levels in Dgat1+/+ and Dgat1–/– mice (0.7 ± 0.1 versus 0.5 ± 0.2 ng/ml for 6 μg/day, P > 0.05). In young (10- to 14-week-old) Dgat1+/+ mice, leptin administration suppressed the normal weight gain seen in control (PBS-infused) mice (Figure 3a). The same doses of leptin caused an additional 3% weight loss in age-matched Dgat1–/– mice (Figure 3b), indicating an enhanced response to leptin.
Figure 3.
Increased weight loss in response to leptin infusion in Dgat1–/– mice. (a and b) Body weight. (c and d) Food intake. Sex-, age-, and weight-matched mice were used. n = 6–8 chow-fed mice per genotype. Error bars represent SEM. **P < 0.01 versus Dgat1+/+ mice receiving the same dose of leptin.
Dgat1–/– mice consistently ate more than Dgat1+/+ mice at baseline (25.3% ± 1.6% versus 19.5% ± 3.2% of body weight, P < 0.05). During leptin infusion, Dgat1–/– mice continued to eat more than Dgat1+/+ mice (19.8% ± 3% versus 15.8% ± 2.4% of body weight after 5 days of leptin (6 μg/day) infusion, P < 0.05). Expressed as percentage of change from baseline, reduction in food intake in response to leptin infusion was comparable in Dgat1–/– and Dgat1+/+ mice (Figure 3, c and d). Similarly, the absolute reduction in food intake per day was similar in Dgat1+/+ and Dgat1–/– mice in response to leptin infusion in several different experiments (not shown). These results imply that the increased weight loss in leptin-treated Dgat1–/– mice resulted from increased energy expenditure rather than reduced food intake.
Expression of leptin-regulated genes in Dgat1–/– mice.
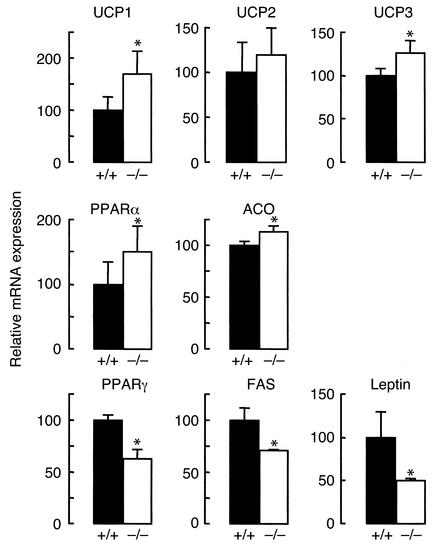
The enhanced response to leptin in Dgat1–/– mice suggested that the leptin pathway was activated in these mice at baseline. To examine this possibility, we measured the expression of several leptin-regulated genes in BAT and WAT of Dgat1–/– mice (Figure 4). In Dgat1–/– BAT, UCP1 expression was increased by approximately 70% versus controls. In WAT, Dgat1–/– mice had increased levels of UCP3 expression, and UCP2 expression levels trended higher. The expression of genes involved in fatty acid oxidation (peroxisome proliferator-activated receptor α [PPARα] and acyl CoA oxidase) was also higher in Dgat1–/– WAT. In contrast, Dgat1–/– mice had decreased levels of expression for genes involved in adipogenesis (PPARγ) and lipid synthesis (fatty acid synthase) in WAT. Dgat1–/– mice also had an approximate 50% reduction in leptin (ob) mRNA expression. These results are consistent with those observed in rodents with leptin overexpression (16–18), suggesting that Dgat1–/– mice have increased leptin sensitivity at baseline.
Figure 4.
Expression of leptin-regulated genes in Dgat1–/– mice. The expression of UCP1 was examined in BAT. The expression of other genes was examined in WAT. For PPARα and leptin, results were obtained with real-time PCR. For other genes, results were obtained with Northern blotting. n = 4–6 chow-fed male mice per genotype. *P < 0.05 versus Dgat1+/+ mice.
DGAT1 deficiency protects against obesity and insulin resistance in AY/a mice but not in ob/ob mice.
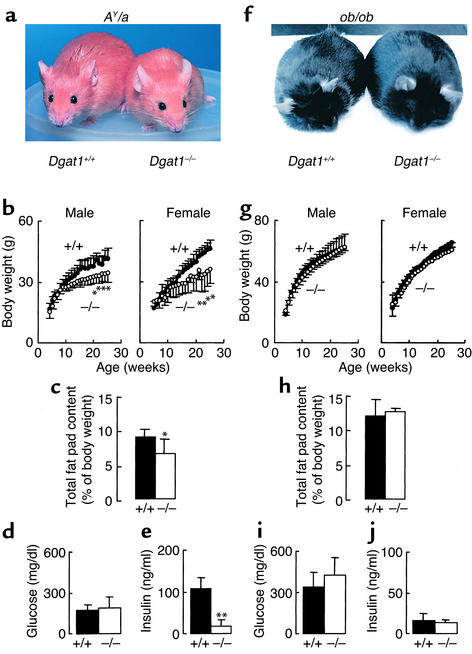
DGAT1 deficiency protects against obesity and insulin resistance induced by high-fat feeding (4). To determine whether DGAT1 deficiency had similar effects in genetic models of obesity and insulin resistance, we introduced DGAT1 deficiency into AY/a and ob/ob mice through breeding. DGAT1 deficiency protected against obesity in AY/a mice (Figure 5a), decreasing body weight (Figure 5b) and fat pad content (Figure 5c) by approximately 20% at 25 weeks. AY/a Dgat1–/– and AY/a Dgat1+/+ mice had similar plasma glucose levels (Figure 5d), but DGAT1 deficiency reduced plasma insulin levels by approximately 80% in AY/a mice (Figure 5e), most likely by increasing their insulin sensitivity. In contrast, DGAT1 deficiency had no apparent effects in ob/ob mice. In the setting of leptin deficiency, both Dgat1–/– and Dgat1+/+ mice became obese (Figure 5f) and diabetic, with similar growth curves (Figure 5g), fat pad content (Figure 5h), and plasma glucose (Figure 5i) and insulin (Figure 5j) levels. DGAT1 deficiency also had no apparent effect on the obesity and diabetes of mice lacking functional leptin receptors (db/db mice, not shown).
Figure 5.
Effects of DGAT1 deficiency on energy and glucose metabolism in Agouti yellow (AY/a) and leptin-deficient (ob/ob) mice. n = 8–12 mice per genotype for growth curves, n = 5 chow-fed male mice per genotype for fat pad content, and n = 4–6 chow-fed male mice per genotype for plasma glucose and insulin concentrations. *P < 0.05, **P < 0.01 versus Dgat1+/+ mice.
Increased DGAT2 mRNA expression in WAT of leptin-deficient Dgat1–/– mice.
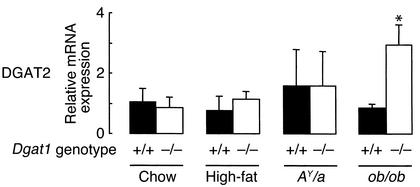
One possible explanation for the lack of effect of DGAT1 deficiency in ob/ob mice is that an alternative pathway for triglyceride synthesis is upregulated in leptin-deficient Dgat1–/– mice. To test this hypothesis, we measured DGAT2 mRNA expression in WAT of Dgat1–/– mice in different backgrounds and conditions (Figure 6). DGAT2 expression was not increased in Dgat1–/– mice at baseline (chow) or after 15 weeks of a high-fat diet. DGAT2 expression was also not increased in AY/a Dgat1–/– mice. In contrast, DGAT2 expression was elevated approximately threefold in leptin-deficient Dgat1–/– mice. This suggests that leptin normally downregulates DGAT2 expression in WAT and that the upregulation of DGAT2 expression may compensate for the loss of DGAT1 in leptin-deficient Dgat1–/– mice.
Figure 6.
Increased DGAT2 mRNA expression in WAT of leptin-deficient Dgat1–/– mice. Results were obtained with real-time PCR. n = 4–6 male mice per genotype. *P < 0.05 versus ob/ob Dgat1+/+ mice.
Discussion
This study demonstrates that mice lacking DGAT1, one of two known enzymes that catalyze the final step in mammalian triglyceride synthesis, have reduced levels of tissue triglycerides. More significantly, these reductions in tissue triglycerides were associated with increased sensitivity to insulin and to leptin. These mechanisms appear to underlie the increased energy expenditure and protection against diet-induced obesity and insulin resistance in Dgat1–/– mice (4).
One potential mechanism for the increased insulin sensitivity in Dgat1–/– mice is their decreased tissue levels of triglycerides. Recent studies have provided a strong correlation between tissue triglyceride content and insulin resistance (6, 14, 19, 20). Thus, the reduced triglyceride content in the skeletal muscle and liver of Dgat1–/– mice may enhance the insulin sensitivity of these tissues. Because we performed the hyperinsulinemic-euglycemic clamp studies with an insulin infusion rate that suppresses hepatic gluconeogenesis, further studies will be required to determine the relative contribution of the liver to the increased systemic insulin sensitivity in Dgat1–/– mice.
Several additional features of the Dgat1–/– phenotype have been associated with, and may contribute to, the increased insulin sensitivity in these mice. Decreased adipocyte size, as we observed in Dgat1–/– mice, is associated with increased insulin sensitivity (21). Because muscle contraction enhances the insulin sensitivity of skeletal muscles, the increased physical activity in Dgat1–/– mice (4) may contribute to their enhanced glucose disposal during high-fat feeding. Finally, leptin enhances insulin action in several murine models of diabetes (10, 22, 23), and DGAT1 deficiency appears to increase activation of the leptin pathway.
The marked reduction of plasma insulin levels in AY/a mice clearly demonstrates that DGAT1 deficiency enhances insulin sensitivity and may provide insight into the underlying molecular mechanism. The ratio of plasma insulin to glucose levels, a simple estimation of insulin resistance, is approximately 0.67 in AY/a Dgat1+/+ mice, whereas it is 0.13 in AY/a Dgat1–/– mice. Thus, a relatively small change in body weight (∼20%) is associated with a remarkable reduction in insulin resistance (∼80%). This finding suggests that DGAT1 deficiency may directly enhance insulin signaling in target tissues. Interestingly, the levels of diacylglycerol, a molecule thought to antagonize insulin signaling by activating isoforms of typical protein kinase C (24), tended to be decreased in Dgat1–/– tissues. Thus, changes in diacylglycerol levels, or perhaps fatty acyl CoAs, may alter intracellular signaling pathways to enhance insulin signaling. It will be of interest to examine the activities of protein kinase C-θ (7) and IκB kinase-β (25), which may have important roles in the regulation of insulin signaling by intracellular lipids. Our findings do not exclude a hormonal effect of DGAT1 deficiency on insulin sensitivity. For example, adipocytes secrete several proteins that modulate glucose metabolism, for example, adiponectin (26, 27), TNF-α (28), and resistin (29). DGAT1 deficiency in WAT could alter the secretion of one or more of these molecules, thereby affecting systemic glucose metabolism.
The findings of enhanced weight loss in response to leptin infusion and changes in the expression of leptin-regulated genes that are consistent with increased activation of the leptin pathway indicate that Dgat1–/– mice have increased leptin sensitivity. Although obesity is clearly associated with leptin resistance in both humans and animal models (9, 30), less evidence exists to indicate that decreasing adiposity and, specifically, decreasing tissue triglyceride content, can increase leptin sensitivity. To our knowledge, our findings are among the first to indicate that decreased tissue triglyceride content is associated with increased leptin sensitivity.
The increased leptin sensitivity in Dgat1–/– mice appears primarily to affect energy expenditure without a comparable effect on food intake. In response to leptin infusion, Dgat1–/– mice lost more weight but did not eat less than Dgat1+/+ mice. One possible explanation for these findings is that leptin sensitivity in Dgat1–/– mice is increased predominantly in peripheral tissues. There is accumulating evidence that leptin has direct, peripheral effects on lipolysis (18), adipogenesis (17), and fatty acid oxidation (31). Because DGAT1 is highly expressed in peripheral tissues that have important roles in energy and lipid metabolism (e.g., skeletal muscle, liver, and WAT) (2), DGAT1 deficiency may somehow enhance peripheral leptin sensitivity without affecting the hypothalamic leptin pathway. It would be of interest to determine whether other murine models of increased leanness and obesity resistance (e.g., mice lacking protein tyrosine phosphatase-1B) (32, 33, reviewed in ref. 34) have a similar response to leptin infusion (i.e., increased weight loss without an enhanced decrease in food intake). If not, it would suggest that DGAT1 deficiency might be unique in selectively enhancing the peripheral effects of leptin.
Although the increased physical activity in Dgat1–/– mice (4) may contribute to their enhanced insulin sensitivity on a high-fat diet, it is less clear whether this finding can help to explain their increased leptin sensitivity. To our knowledge, no studies have directly examined the effects of physical activity on leptin sensitivity. Recent findings, however, suggest that physical activity could enhance peripheral leptin sensitivity. Muscle contraction, for example, activates 5′-AMP–activated protein kinase, which mediates the effects of leptin on fatty acid oxidation (31). Thus, the increased physical activity in Dgat1–/– mice fed a high-fat diet may help to enhance leptin-mediated fatty acid oxidation.
DGAT1 deficiency protected against obesity and insulin resistance in mice fed a high-fat diet and in AY/a mice, but had no apparent effect in ob/ob mice. The lack of phenotypic effects of DGAT1 deficiency in the setting of leptin deficiency is similar to what we observed for changes of sebaceous gland atrophy and hair loss in Dgat1–/– mice (35). Why is the phenotype of DGAT1 deficiency not apparent in the setting of leptin deficiency? One possibility is that the effects of DGAT1 deficiency are masked by the severe metabolic derangement of leptin deficiency. This seems unlikely, however, because several other murine models of decreased adiposity, for example, mice lacking perilipin (36) or high-mobility group protein I-C (37), can counter the obesity of ob/ob mice. A more likely explanation is that the effects of DGAT1 deficiency on energy and glucose metabolism require a functional leptin pathway. In the absence of leptin, for example, an alternative pathway of triglyceride synthesis may be upregulated to compensate for the loss of DGAT1, thereby eliminating the effects of DGAT1 deficiency on energy and glucose metabolism. Indeed, as we found previously in the skin of Dgat1–/– mice (35), DGAT2 mRNA expression was upregulated approximately threefold in WAT of leptin-deficient ob/ob mice. Importantly, this upregulation was not observed in high-fat feeding and in AY/a mice, conditions in which DGAT1 deficiency confers protection against insulin resistance and obesity. This increase in DGAT2 mRNA expression may adequately compensate for DGAT1 deficiency in the absence of leptin.
In conclusion, DGAT1 deficiency reduced tissue triglyceride levels, and these reductions were associated with increased insulin and leptin sensitivity. Moreover, DGAT1 deficiency protected against insulin resistance and obesity in agouti yellow mice, a model of severe leptin resistance. Because most human obesity is associated with insulin and leptin resistance, understanding the potential mechanisms of enhancing insulin and leptin sensitivity has significant medical relevance. Our findings suggest that pharmacological inhibition of DGAT1, by reversing insulin and leptin resistance, may represent an effective therapy for diabetes and obesity.
Acknowledgments
We thank J. Raber for assistance with hypothalamic block isolation; J. Kropp, R. Woodward, and S. Wen for assistance with real-time PCR; S. Ordway and G. Howard for editorial assistance; B. Taylor for manuscript preparation; R. Bituin for weight and food intake measurements; and M. Schambelan, C. Vaisse, and F. Chehab for comments on the manuscript. This work was supported by the NIH (DK-56804 to R.V. Farese; DK-26356 to R.H. Eckel), the Sandler Family Supporting Foundation, the Endocrine Fellows Foundation, the CardioFellows Foundation, and the J. David Gladstone Institutes.
References
- 1.Chen HC, Farese RV., Jr DGAT and triglyceride synthesis: a new target for obesity treatment? Trends Cardiovasc Med. 2000;10:188–192. doi: 10.1016/s1050-1738(00)00066-9. [DOI] [PubMed] [Google Scholar]
- 2.Cases S, et al. Identification of a gene encoding an acyl CoA:diacylglycerol acyltransferase, a key enzyme in triacylglycerol synthesis. Proc Natl Acad Sci USA. 1998;95:13018–13023. doi: 10.1073/pnas.95.22.13018. [DOI] [PMC free article] [PubMed] [Google Scholar]
- 3.Cases S, et al. Cloning of DGAT2, a second mammalian diacylglycerol acyltransferase, and related family members. J Biol Chem. 2001;276:38870–38876. doi: 10.1074/jbc.M106219200. [DOI] [PubMed] [Google Scholar]
- 4.Smith SJ, et al. Obesity resistance and multiple mechanisms of triglyceride synthesis in mice lacking DGAT. Nat Genet. 2000;25:87–90. doi: 10.1038/75651. [DOI] [PubMed] [Google Scholar]
- 5.Farese RV, Jr, Cases S, Smith SJ. Triglyceride synthesis: insights from the cloning of diacylglycerol acyltransferase. Curr Opin Lipidol. 2000;11:229–234. doi: 10.1097/00041433-200006000-00002. [DOI] [PubMed] [Google Scholar]
- 6.Boden G. Obesity, free fatty acids, and insulin resistance. Curr Opin Endocrinol. 2001;8:235–239. doi: 10.1097/MED.0b013e3283444b09. [DOI] [PMC free article] [PubMed] [Google Scholar]
- 7.Shulman GI. Cellular mechanisms of insulin resistance. J Clin Invest. 2000;106:171–176. doi: 10.1172/JCI10583. [DOI] [PMC free article] [PubMed] [Google Scholar]
- 8.Kahn BB, Flier JS. Obesity and insulin resistance. J Clin Invest. 2000;106:473–481. doi: 10.1172/JCI10842. [DOI] [PMC free article] [PubMed] [Google Scholar]
- 9.Friedman JM, Halaas JL. Leptin and the regulation of body weight in mammals. Nature. 1998;395:763–770. doi: 10.1038/27376. [DOI] [PubMed] [Google Scholar]
- 10.Shimomura I, Hammer RE, Ikemoto S, Brown MS, Goldstein JL. Leptin reverses insulin resistance and diabetes mellitus in mice with congenital lipodystrophy. Nature. 1999;401:73–76. doi: 10.1038/43448. [DOI] [PubMed] [Google Scholar]
- 11.Fan W, Boston BA, Kesterson RA, Hruby VJ, Cone RD. Role of melanocortinergic neurons in feeding and the agoutiobesity syndrome. Nature. 1997;385:165–168. doi: 10.1038/385165a0. [DOI] [PubMed] [Google Scholar]
- 12.Halaas JL, et al. Physiological response to long-term peripheral and central leptin infusion in lean and obese mice. Proc Natl Acad Sci USA. 1997;94:8878–8883. doi: 10.1073/pnas.94.16.8878. [DOI] [PMC free article] [PubMed] [Google Scholar]
- 13.Chehab FF, Lim ME, Lu R. Correction of the sterility defect in homozygous obese female mice by treatment with the human recombinant leptin. Nat Genet. 1996;12:318–320. doi: 10.1038/ng0396-318. [DOI] [PubMed] [Google Scholar]
- 14.Chen, H.C., and Farese, R.V., Jr. 2002. Determination of adipocyte size by computer image analysis. J. Lipid. Res. In press. [PubMed]
- 15.Ferreira LDMC-B, Pulawa LK, Jensen DR, Eckel RH. Overexpressing human lipoprotein lipase in mouse skeletal muscle is associated with insulin resistance. Diabetes. 2001;50:1064–1068. doi: 10.2337/diabetes.50.5.1064. [DOI] [PubMed] [Google Scholar]
- 16.Chen G, et al. Disappearance of body fat in normal rats induced by adenovirus-mediated leptin gene therapy. Proc Natl Acad Sci USA. 1996;93:14795–14799. doi: 10.1073/pnas.93.25.14795. [DOI] [PMC free article] [PubMed] [Google Scholar]
- 17.Zhou Y-T, Wang Z-W, Higa M, Newgard CB, Unger RH. Reversing adipocyte differentiation: implications for treatment of obesity. Proc Natl Acad Sci USA. 1999;96:2391–2395. doi: 10.1073/pnas.96.5.2391. [DOI] [PMC free article] [PubMed] [Google Scholar]
- 18.Wang M-Y, Lee Y, Unger RH. Novel form of lipolysis induced by leptin. J Biol Chem. 1999;274:17541–17544. doi: 10.1074/jbc.274.25.17541. [DOI] [PubMed] [Google Scholar]
- 19.Kim JK, et al. Tissue-specific overexpression of lipoprotein lipase causes tissue-specific insulin resistance. Proc Natl Acad Sci USA. 2001;98:7522–7527. doi: 10.1073/pnas.121164498. [DOI] [PMC free article] [PubMed] [Google Scholar]
- 20.Boden G, Lebed B, Schatz M, Homko C, Lemieux S. Effects of acute changes of plasma free fatty acids on intramyocellular fat content and insulin resistance in healthy subjects. Diabetes. 2001;50:1612–1617. doi: 10.2337/diabetes.50.7.1612. [DOI] [PubMed] [Google Scholar]
- 21.Kubota N, et al. PPARγ mediates high-fat diet–induced adipocyte hypertrophy and insulin resistance. Mol Cell. 1999;4:597–609. doi: 10.1016/s1097-2765(00)80210-5. [DOI] [PubMed] [Google Scholar]
- 22.Chinookoswong N, Wang J-L, Shi Z-Q. Leptin restores euglycemia and normalizes glucose turnover in insulin-deficient diabetes in the rat. Diabetes. 1999;48:1487–1492. doi: 10.2337/diabetes.48.7.1487. [DOI] [PubMed] [Google Scholar]
- 23.Ogawa Y, et al. Increased glucose metabolism and insulin sensitivity in transgenic skinny mice overexpressing leptin. Diabetes. 1999;48:1822–1829. doi: 10.2337/diabetes.48.9.1822. [DOI] [PubMed] [Google Scholar]
- 24.Farese RV. Insulin-sensitive phospholipid signaling systems and glucose transport. Update II. Exp Biol Med. 2001;226:283–295. doi: 10.1177/153537020122600404. [DOI] [PubMed] [Google Scholar]
- 25.Yuan M, et al. Reversal of obesity- and diet-induced insulin resistance with salicylates or targeted disruption of Ikkβ. Science. 2001;293:1673–1677. doi: 10.1126/science.1061620. [DOI] [PubMed] [Google Scholar]
- 26.Yamauchi T, et al. The fat-derived hormone adiponectin reverses insulin resistance associated with both lipoatrophy and obesity. Nat Med. 2001;7:941–946. doi: 10.1038/90984. [DOI] [PubMed] [Google Scholar]
- 27.Berg AH, Combs TP, Du X, Brownlee M, Scherer PE. The adipocyte-secreted protein Acrp30 enhances hepatic insulin action. Nat Med. 2001;7:947–953. doi: 10.1038/90992. [DOI] [PubMed] [Google Scholar]
- 28.Hotamisligil GS, Shargill NS, Spiegelman BM. Adipose expression of tumor necrosis factor-α: direct role in obesity-linked insulin resistance. Science. 1993;259:87–91. doi: 10.1126/science.7678183. [DOI] [PubMed] [Google Scholar]
- 29.Steppan CM, et al. The hormone resistin links obesity to diabetes. Nature. 2001;409:307–312. doi: 10.1038/35053000. [DOI] [PubMed] [Google Scholar]
- 30.Friedman JM. Obesity in the new millennium. Nature. 2000;404:632–634. doi: 10.1038/35007504. [DOI] [PubMed] [Google Scholar]
- 31.Minokoshi Y, et al. Leptin stimulates fatty-acid oxidation by activating AMP-activated protein kinase. Nature. 2002;415:339–343. doi: 10.1038/415339a. [DOI] [PubMed] [Google Scholar]
- 32.Elchebly M, et al. Increased insulin sensitivity and obesity resistance in mice lacking the protein tyrosine phosphatase-1B gene. Science. 1999;283:1544–1548. doi: 10.1126/science.283.5407.1544. [DOI] [PubMed] [Google Scholar]
- 33.Klaman LD, et al. Increased energy expenditure, decreased adiposity, and tissue-specific insulin sensitivity in protein-tyrosine phosphatase 1B-deficient mice. Mol Cell Biol. 2000;20:5479–5489. doi: 10.1128/mcb.20.15.5479-5489.2000. [DOI] [PMC free article] [PubMed] [Google Scholar]
- 34.Chen HC, Farese RV., Jr Turning WAT into BAT gets rid of fat. Nat Med. 2001;7:1102–1103. doi: 10.1038/nm1001-1102. [DOI] [PubMed] [Google Scholar]
- 35.Chen HC, Smith SJ, Tow B, Elias PM, Farese RV., Jr Leptin modulates the effects of acyl CoA:diacylglycerol acyltransferase deficiency on murine fur and sebaceous glands. J Clin Invest. 2002;109:175–181. DOI:10.1172/JCI1200213880. doi: 10.1172/JCI13880. [DOI] [PMC free article] [PubMed] [Google Scholar]
- 36.Martinez-Botas J, et al. Absence of perilipin results in leanness and reverses obesity in Leprdb/dbmice. Nat Genet. 2000;26:474–479. doi: 10.1038/82630. [DOI] [PubMed] [Google Scholar]
- 37.Anand A, Chada K. In vivo modulation of Hmgicreduces obesity. Nat Genet. 2000;24:377–380. doi: 10.1038/74207. [DOI] [PubMed] [Google Scholar]


