Abstract
While the pathologic mechanisms responsible for organ-specific tissue damage in primary biliary cirrhosis (PBC) remain an enigma, it has been suggested that the pathology is mediated by autoreactive T cells infiltrating the intrahepatic bile ducts. Previously, we have documented that there is 100-fold enrichment in the frequency of CD4+ autoreactive T cells in the liver that are specific for peptides encoded by the E2 components of the pyruvate dehydrogenase complexes (PDC-E2). We have also recently characterized the first MHC class I–restricted epitope for PDC-E2, namely amino acid 159–167, a region very similar to the epitope recognized by MHC class II–restricted CD4+ cells and by autoantibodies. The effector functions of these PDC-E2159-167–specific CD8+ cytotoxic T lymphocytes (CTLs) are not well understood. We have taken advantage of tetramer technology and report herein that there is tenfold increase in the frequency of PDC-E2159-167–specific CTLs in the liver as compared with the blood in PBC. In addition, the precursor frequency of the CTLs in blood was significantly higher in early-stage PBC. Of interest was the fact that, upon stimulation with the peptide, the response of PDC-E2159-167 tetramer-positive cells is heterogeneous with respect to IFN-γ synthesis. These data, we believe for the first time, document the enrichment of autoantigen-specific CD8+ T cells in the PBC liver, suggesting that CD8+ T cells play a significant role in the immunopathogenesis of PBC.
Introduction
Primary biliary cirrhosis (PBC) is an autoimmune cholestatic liver disease characterized by the presence of antimitochondrial Ab’s (AMAs) and intense biliary inflammatory response. The major mitochondrial antigen recognized by AMAs has been defined as the E2 component of the pyruvate dehydrogenase complex (PDC-E2) (1). Several lines of evidence suggest that T cells are implicated in the pathogenesis of PBC (2). This is exemplified by the presence of CD4+ and CD8+ T cell infiltrates within the portal tracts of the liver in PBC patients (3). MHC class II–restricted autoreactive CD4+ T cells specific for PDC-E2 have been identified from both peripheral blood and liver and the immunodominant target epitope has been defined to be amino acids 163-176 of PDC-E2 (4, 5). Moreover, we have recently identified an MHC class I–restricted CD8+ epitope of PDC-E2. This peptide, amino acid 159-167 of PDC-E2, can specifically induce CD8+ cytotoxic T lymphocyte (CTL) lines from the PBMCs of HLA-A*0201+ patients with PBC (6). These data suggest that much of the T cell and the autoantibody responses in this disease are directed against PDC-E2.
Although autoreactive CD8+ T cells are thought to be involved in the pathogenesis of several autoimmune diseases (7–9), the role of PDC-E2–specific CD8+ T cells in the pathogenesis of PBC remains elusive. Previous investigations have demonstrated the accumulation of antigen-reactive T cells at the site of the inflammation in several human autoimmune diseases as well as in murine models of human autoimmune diseases (9–12). It was thus reasoned that a comparative analysis of the precursor frequencies of PDC-E2–specific T cells isolated from the peripheral blood and from the liver of PBC patients would provide important information as to the relevance of such T cells in the pathogenesis of disease. In a previous report from our laboratory, 100-fold increase in the precursor frequency of PDC-E2–specific CD4+ T cells in the hilar lymph nodes and liver compared with PBMCs from patients with PBC has been documented (13). The recent advances in the identification of antigen-specific T cells with peptide-MHC tetramers, coupled with our identification of a HLA-A*0201–restricted immunodominant MHC class I epitope in PDC-E2, prompted us to use this technique and knowledge to determine whether there is a similar selective enrichment of autoreactive MHC class I–restricted CD8+ CTLs in the diseased liver.
Materials
Patients and cells.
The present study involved blood from 18 HLA-A*0201+ patients with PBC (PBC 1 to PBC 18; four at stage I, five at stage II, four at stage III, and five at stage IV), four HLA-A*0201+ healthy controls (normal 1 to 4), and four HLA-A*0201+ patients with other chronic liver diseases (chronic liver disease1 to 4; three alcoholic hepatitis and one granulomatous hepatitis), and four HLA-A2– patients with PBC (A2 negative PBC 25 to 28). The HLA-A*0201 haplotype of the subjects was determined initially by using HLA-A2–specific mAbs MA2.1 and BB7.2 as described previously (14) and confirmed by standard molecular MHC class I typing. PBMCs were purified from venous blood using standard Ficoll-Histopaque gradient centrifugation techniques. Liver-infiltrating lymphocytes (LILs) were harvested from explanted liver tissue of six HLA-A*0201+ PBC patients undergoing liver transplantation (PBC 19 to PBC 24), as described (13). LILs were also harvested from excess liver tissue of two HLA-A*0201+ normal adult livers donated for transplantation (normal 5 to 6). The PBMCs and LILs were cryopreserved in 10% DMSO/90% FCS and stored in liquid nitrogen until used.
Synthetic peptides.
A synthetic peptide corresponding to the previously defined immunodominant HLA-A*0201–restricted CTL epitope of the autoantigen, amino acid 159-167 of the PDC-E2 (PDC-E2159-167), was prepared (6). A previously defined HLA-A*0201–restricted CTL epitope, amino acid 18-27 of the hepatitis B virus core protein (HBc18-27) (15), and amino acid 58-66 of influenza matrix protein (Flu MP58-66) (16) were also used as negative controls. All peptides were synthesized with a free NH2 and a free COOH terminus and their purity confirmed by HPLC. Lyophilized peptides were reconstituted at 10 mg/ml in DMSO and diluted in the appropriate medium before use.
Synthesis of peptide-MHC tetramers.
PDC-E2159-167-HLA A2 tetramers were generated as described (17). In brief, recombinant HLA-A*0201 with a 15-amino acid substrate peptide for BirA-dependent biotinylation at its C terminus was expressed in Escherichia coli BL21(DE3)pLysS (Promega Corp., Madison, Wisconsin, USA) carrying pET-HLA-A*0201 plasmid (Promega Corp.) and isolated from inclusion bodies. Recombinant β2 microglobulin was also expressed in the same way using a plasmid carrying β2 microglobulin (pHN1-β2m), which was a gift from D.C. Wiley (Harvard University, Cambridge, Massachusetts, USA). The inclusion bodies were purified and dissolved in a urea-denaturing buffer. The monomeric MHC-peptide complexes were formed by combining the recombinant HLA-A*0201, recombinant β2-microglobulin, and the nonapeptide PDC-E2159-167 in an arginine-folding buffer. HLA-A*0201 was folded in the presence of β2-microglobulin and a specific peptide to form a peptide-MHC complex, following the procedure of Garboczi et al. (16). The complex was purified using a Sephacryl S100 column (Pharmacia Biotech Inc., Piscataway, New Jersey, USA). The MHC-peptide complexes were biotinylated enzymatically with BirA enzyme (Avidity, Denver, Colorado, USA), mixed with phycoerythrin-labeled Extraavidin (Sigma Chemical Co., Saint Louis, Missouri, USA) at a molar ratio of 4:1 to form the tetrameric peptide-MHC complex. Similarly prepared Flu MP58-66-HLA-A*0201 tetramers were used as controls.
Generation of peptide-induced CTL lines.
Peptide-specific CTL lines were generated as described previously (6). Dendritic cells (DCs) were generated from PBMCs of HLA-A*0201–positive donors as described (18) and used as antigen-presenting cells (APCs). In brief, PBMCs were resuspended in RPMI-1640 (Life Technologies Inc., Grand Island, New York, USA) supplemented with 10% heat-inactivated FCS, penicillin (50 U/ml), and streptomycin (50 μg/ml) (FCS medium), seeded in a 250-ml culture flask, and incubated at 37°C for 1.5 hours. After removing nonadherent cells in the medium, the adherent cells were fed with FCS medium supplemented with GM-CSF (1,000 U/ml) (PreproTech Inc., Rocky Hill, New Jersey, USA) and IL-4 (1,000 U/ml) (PreproTech Inc.) and cultured at 37°C. On day 7, cells were harvested and incubated overnight in FCS medium containing PDC-E2159-167 peptide (10 μM). The cells were then washed and γ irradiated (5,000 gy). Cryopreserved PBMCs or LILs were thawed, washed twice with HBSS, resuspended in FCS medium, and seeded in 24-well plates at 2 × 10⁶ cells per well along with 2 × 10⁵ peptide-pulsed APCs. Cells were cultured at 37°C for a total of 14 days, with appropriate feeding of the cultures with media. On day three, recombinant human IL-2 (PeproTech) was added to each well at a final concentration of 10 U/ml. In select experiments, PBMCs or LILs were labeled with 5-carboxyfluorescein diacetate succinimidyl ester (CFSE; Molecular Probes Inc., Eugene, Oregon, USA) prior to coculture with APCs. In these experiments the cryopreserved cells were thawed, washed twice with serum-free PBS, and labeled with 0.5 μM CFSE for 10 minutes at 37°C. The labeling was terminated by the addition of FCS, and subsequently the cells were washed six times with FCS medium. The CFSE-stained cells were seeded in 24-well plates at 2 × 10⁶ cells per well, along with 2 × 10⁵ peptide-pulsed APCs, and cultured for 14 days as described above.
Flow-cytometric analysis and cell sorting.
Peptide-specific CTL lines were prepared as described above, resuspended in 50 μl of FACS buffer (0.5% BSA and 0.05% sodium azide in PBS), and incubated at 4°C with Fcγ receptor Ab (Miltenyi Biotec, Auburn, California, USA) and NeutrAvidin (Molecular Probes Inc.) for 15 minutes. Cells were stained with the appropriate peptide-loaded PE-labeled HLA-A*0201 tetramer for 30 minutes at room temperature in the dark, washed, and subsequently incubated with FITC-labeled anti-CD8 Ab’s (Caltag Laboratories Inc., Burlingame, California, USA) and tri-color (TC)-labeled anti-CD4 Ab’s (Caltag Laboratories Inc.) for 30 minutes at 4°C in the dark. After incubation, the cells were washed twice with FACS buffer, fixed with 1% paraformaldehyde in PBS, and analyzed by three-color flow cytometry using a FACScan (Becton Dickinson Immunocytometry Systems, San Jose, California, USA). The acquired data were analyzed with CELLQUEST software (BD Biosciences, San Jose, California, USA). In some experiments, both tetramer-positive and negative populations were sorted with a MoFlo cell sorter (Cytomation Inc., Fort Collins, Colorado, USA).
Intracellular cytokine analysis using flow cytometry.
Peptide-induced CTL lines were incubated in fresh FCS medium with peptide (10 μM) and brefeldin A (10 μg/ml) (Sigma Chemical Co.) at 37°C for 4 hours. Cells were harvested and treated first with FACS lysing solution and then with FACS permeabilizing solution (BD Biosciences). The processed cells were resuspended in 50 μl of FACS buffer and stained with PE-labeled anti-CD8 (Caltag Laboratories Inc.), TC-labeled anti-CD4 (Caltag Laboratories Inc.), and FITC-labeled Ab’s against one of the following cytokines: IFN-γ, TNF-α, or IL-2 (BD Biosciences). An aliquot of the cells was also stained with FITC-labeled anti-CD8 (Caltag Laboratories Inc.), TC-labeled anti-CD4 (Caltag Laboratories Inc.), and PE-labeled Ab’s against one of the following cytokines: IL-4 or IL-10 (BD Biosciences). In some experiments, IFN-γ production of tetramer-binding cells was directly assessed by a combination of tetramer staining and intracellular staining for IFN-γ, as described (14, 19), with some modifications. The cells were incubated in fresh FCS medium with peptide (10 μM) and brefeldin A (10 μg/ml) at 37°C for 4 hours. Cells were harvested and resuspended in 50 μl of FACS buffer and stained with PE-labeled tetramer for 30 minutes at room temperature in the dark, washed, and subsequently treated with FACS lysing solution and FACS permeabilizing solution. The processed cells were stained with FITC-labeled anti–IFN-γ Ab’s and TC-labeled anti-CD8 Ab’s as described above. The stained cells were analyzed on a FACScan flow cytometer with CELLQUEST software (BD Biosciences).
Cytotoxicity assay.
The HLA-A*0201+ lymphoblastoid T2 cell line was pulsed with appropriate peptides (10 μM) at 37°C overnight and used as target cells. To assess the antigen-specific cytolytic activity of the CTL lines, a fluorescence-based cytotoxicity assay was carried out with DELFIA EuTDA cytotoxicity assay reagents (Wallac Oy, Turku, Finland), as described (6). In brief, the peptide-pulsed target cells were washed, labeled with TDA (2,2′:6′,2′′-terpyridine-6,6′′-dicarboxylic acid), washed again, and resuspended in FCS medium. Five thousand target cells in a volume of 0.1 ml were plated into each well of a 96-well round-bottom plate, followed by the addition of varying numbers of effector cells in 0.1 ml of medium. After a 4-hour incubation at 37°C, the plates were centrifuged and a 20-μl portion of the supernatant from each well was transferred to a 96-well microtiter plate containing 200 μl of DELFIA europium (Eu) solution in each well. The Eu forms a stable complex with released TDA in the mixture and generates fluorescence. The fluorescence of EuTDA was measured by a time-resolved fluorometer (1420 VECTOR; Wallac Oy). Percentage of cytotoxicity was calculated by the formula: 100 × (release in assay – spontaneous release)/(maximum release – spontaneous release). Maximum release was determined by the lysis of target cells in triplicate wells with DELFIA lysis buffer (Wallac Oy). Spontaneous release was measured by incubating target cells in triplicate wells in the absence of effector cells. In all experiments, spontaneous release was less than 15% of maximum release. Results are reported herein as the mean of triplicate values.
Estimation of specific T cell frequency based on the number of cell division.
The frequency of peptide-specific CD8+ T cells was analyzed as described previously (20), with some modification. In brief, an aliquot of CFSE-stained cells were suspended into the FCS medium and cultured at 37°C. On day 7, the cells were stimulated with 5 μM of phytohemagglutinin-P (PHA-P) and 10 U/ml of rIL-2 and further incubated at 37°C for another 7 days. Polyclonal stimulation of CFSE-stained cells with PHA-P and IL-2 results in cell division accompanied by 50% dilution of CFSE per cell division in the cells, allowing determination of the mean CFSE intensity of each generation. These values were used to calculate the average number of cell division(s) in cell cultures stimulated with peptides. Precursor frequency was estimated by dividing the number of amplified tetramer-positive cells by 2x, where x is the average number of cell divisions, to determine the absolute number of tetramer-positive precursors and then dividing this value by the total number of cells analyzed.
Statistical analysis.
Values were statistically analyzed using the unpaired t test.
Results
Peptide-loaded HLA-A*0201 tetramers bind specifically to HLA-A*0201–restricted CTLs.
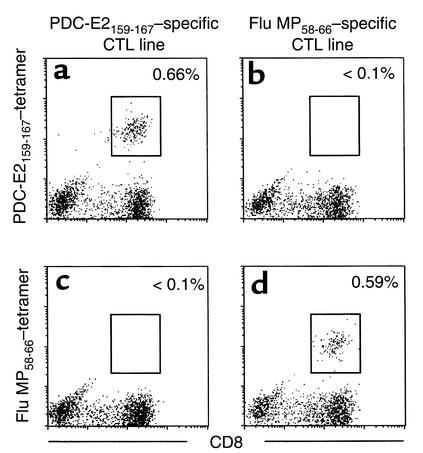
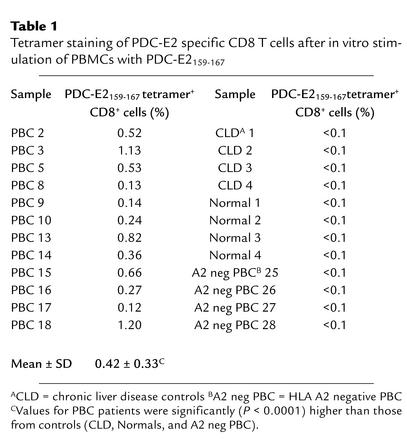
The specificity of tetramers binding to Ag-specific TCRs was verified using specific CTL lines induced by in vitro stimulation of PBMCs with peptide antigens. Aliquots of PBMCs from an HLA-A*0201+ PBC patient were cocultured with APCs pulsed with either PDC-E2159-167 peptide or Flu MP58-66 peptide for 14 days to expand peptide-specific CD8+ T cells in vitro. The peptide-specific CTL activity of the respective CTL lines was confirmed by a cytotoxicity assay (data not shown). Aliquots of these in vitro–expanded CTL lines were stained with either PE-labeled PDC-E2159-167 tetramer or PE-labeled Flu MP58-66 tetramer, along with FITC-labeled anti-CD8 Ab’s and TC-labeled anti-CD4 Ab’s and analyzed by flow cytometry (Figure 1). In the PDC-E2 peptide–primed CTL line, there was a distinct population (0.66%) of CD8+ T cells that stained positively with PDC-E2159-167 tetramer, while no (<0.1%) Flu MP58-66 tetramer–binding population was detected (Figure 1, a and c). On the other hand, in the Flu MP peptide–primed CTL lines, there was a distinct population (0.59%) of CD8+ T cells positively stained with Flu MP58-66 tetramer, while no (<0.1%) binding was observed by the PDC-E2159-167 tetramer (Figure 1, b and d). These experiments were repeated for both tetramers with independently generated CTL lines from six different HLA-A*0201+ individuals, which verified the binding specificity of the tetramers. The frequencies of the PDC-E2159-167 tetramer–positive CD8+ cells after in vitro stimulation of PBMCs from 12 PBC patients with PDC-E2159-167 are summarized in Table 1. It is important to note that the frequency of PDC-E2159-167 tetramer–positive CD8+ cells were below the level of detection in the ex vivo–obtained PBMCs from all 12 PBC patients. The frequency of PDC-E2159-167 tetramer–positive CD8+ cells after in vitro stimulation with PDC-E2159-167 was below the level of detection in PBMCs from all 12 control individuals, including four HLA-A*0201+ healthy controls, four HLA-A*0201+ patients with other chronic liver diseases, and four HLA-A2– patients with PBC (Table 1). The frequencies of Flu MP58-66 tetramer–positive CD8+ cells after in vitro stimulation of PBMCs with Flu MP58-66 peptide were between less than 0.1% and 10%, presumably reflecting a history of infection or immunization in each patient with PBC. The frequency of Flu MP58-66 tetramer–positive CD8+ cells in the ex vivo–obtained PBMCs were between less than 0.1% and 0.2%, similar to the healthy donors in a previous report (21).
Figure 1.
Verification of the binding specificity of peptide-MHC tetramers. PBMCs from an HLA-A*0201+ PBC patient were cocultured with PDC-E2159-167–loaded APCs (a and c) or Flu MP58-66–loaded APCs (b and d) for 14 days. The cells were stained with the HLA-A*0201 tetramer loaded with PDC-E2159-167 (a and b) or the HLA-A*0201 tetramer loaded with Flu MP58-66 (c and d) in addition to anti-CD4 and anti-CD8 Ab’s, followed by flow cytometric analysis. Displayed in the dot plots are cells gated at lymphocyte population by forward scattering and side scattering and the CD4– population. The cells within the box are considered positive. The number next to the box is the percentage of positively stained cells in the lymphocyte population.
Table 1.
Tetramer staining of PDC-E2 specific CD8 T cells after in vitro stimulation of PBMCs with PDC-E2159-167
Effector functions of PDC-E2159-167.peptide–induced CTL lines.
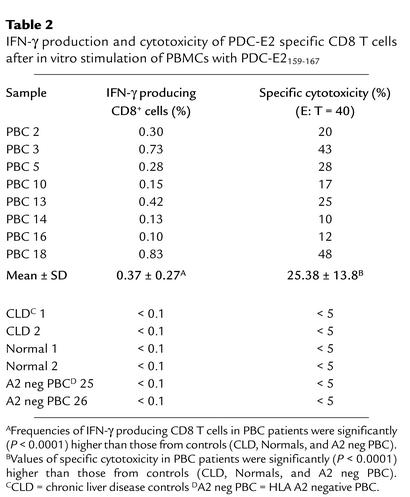
To more fully characterize the autoreactive CTL lines specific for PDC-E2, a CTL line was prepared by stimulating PBMCs from an HLA-A*0201+ PBC patient with PDC-E2159-167 peptide–pulsed APCs in vitro. The cells were split into aliquots and assessed for cytotoxicity, cytokine production, and tetramer binding, respectively. Target cells loaded with PDC-E2159-167, but not with a control peptide, were lysed by the CTL lines at an effector/target (E/T) ratio as low as 10:1 (Figure 2a). When the cells were restimulated with PDC-E2159-167 peptide in the presence of brefeldin A, followed by intracellular staining for IFN-γ, a distinct population (0.42%) of IFN-γ–producing cells was detected within the CD8+ T cell population (Figure 2b). The peptide-induced T cell lines were also stained with the PDC-E2159-167 tetramer along with mAb to CD8 and CD4 and analyzed by flow cytometry. A distinct tetramer-positive CD8+ population (0.82%) was detected in PDC-E2 peptide-specific CTL lines (Figure 2c). The frequencies of the tetramer-positive CD8+ cells, IFN-γ–producing CD8+ cells, and percentage of cytotoxicity of the CTL lines from eight HLA-A*0201+ patients with PBC are summarized in Tables 1 and 2. The frequency of the tetramer-positive cells was always higher than that of the IFN-γ–producing cells in each of the CTL lines studied.
Figure 2.
Identification and functional analysis of PDC-E2159-167–specific CD8+ T cells in the peptide-induced CTL line. PBMCs from an HLA-A*0201+ PBC patient were cocultured with PDC-E2159-167–loaded APCs for 14 days to generate a CTL line. (a) The CTL line was tested for cytotoxicity against PDC-E2159-167 peptide– or control peptide–loaded T2 targets at different E/T ratios. HBc18-27, an HLA-A*0201–restricted irrelevant epitope, was used as control. Displayed are the mean specific lysis of triplicate testing. (b) The CTL line was restimulated with PDC-E2159-167 peptide or control peptide in the presence of brefeldin A, followed by intracellular staining for IFN-γ. Displayed in the dot plots are cells gated at lymphocyte population by forward scattering and side scattering and the CD4– population. The number next to the box is the percentage of IFN-γ–producing cells in the lymphocyte population. (c) The CTL line was stained with PDC-E2159-167 tetramer and Ab’s against CD4 and CD8, followed by flow cytometric analysis. Displayed in the dot plots are cells gated at lymphocyte population by forward scattering and side scattering and the CD4– population. The number next to the box is the percentage of positively stained cells in the lymphocyte population.
Table 2.
IFN-γ production and cytotoxicity of PDC-E2 specific CD8 T cells after in vitro stimulation of PBMCs with PDC-E2159-167
Specific cytotoxicity of the PDC-E2159-167 tetramer-reactive cells.
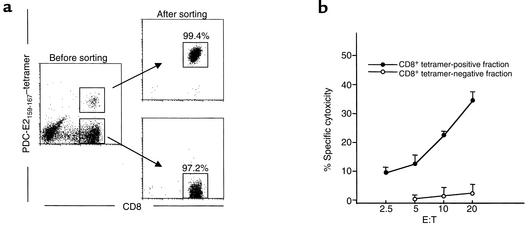
In efforts to confirm that the tetramer-reactive cells represent true MHC class I–restricted autoreactive cytotoxic T cells, highly enriched populations of both PDC-E2159-167 tetramer–positive and –negative CD8+ T cells were obtained by flow-cytometric sorting from PDC-E2159-167 peptide–induced CTL lines. The sorted cells were used as effector cells in a cytotoxicity assay. PDC-E2159-167–specific lytic activity was detected only in the tetramer-positive population, not in the tetramer-negative population. Representative data from a PBC patient are shown in Figure 3. A highly enriched population of Flu MP58-66 tetramer–positive CD8+ T cells, prepared in the same way from Flu MP58-66 peptide–induced CTL lines, showed greater than 80% of Flu MP58-66–specific lytic activity at an E/T ratio of 10 (data not shown).
Figure 3.
The specific cytotoxicity of PDC-E2159-167 peptide–induced cell line is mediated by tetramer-positive CD8+ T cells. PBMCs from an HLA-A*0201+ PBC patient were cocultured with PDC-E2159-167–loaded APCs for 14 days to generate a CTL line. (a) Cells were stained with the PDC-E2159-167 tetramer and Ab’s against CD4 and CD8, followed by flow cytometric cell sorting to isolate tetramer-positive CD8+ and tetramer-negative CD8+ populations. (b) The sorted cells were tested for their cytotoxicity against T2 target cells loaded with PDC-E2159-167 peptide or a control peptide HBc18-27 at different E/T ratios. Displayed is the mean specific lysis of triplicate testing.
Cytokine production of the PDC-E2159-167 tetramer-reactive cells.
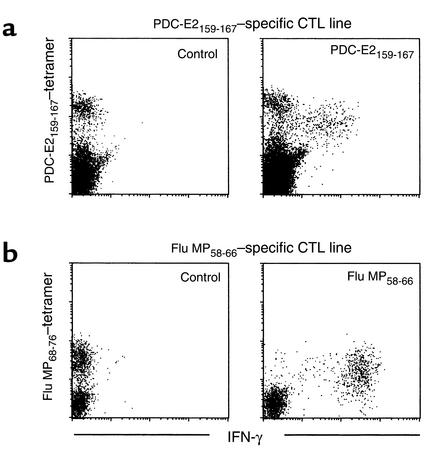
The frequency of PDC-E2159-167 tetramer-positive cells was constantly higher than IFN-γ–producing cells in response to restimulation with PDC-E2159-167 peptide; this suggests the presence of PDC-E2159-167 tetramer–reactive cells that do not respond with IFN-γ production after short-term restimulation with the PDC-E2159-167 peptide. Thus, the ability of individual tetramer-binding cells to produce IFN-γ in response to the PDC-E2159-167 peptide stimulation was assessed. PDC-E2159-167–specific CTL lines from HLA-A*0201+ PBC patients were restimulated with PDC-E2159-167 or a control peptide in the presence of brefeldin A, stained with the PDC-E2159-167 tetramer, fixed and permeabilized, and stained for intracellular IFN-γ along with mAb against CD8. For purposes of control, aliquots of the same PBMCs were cocultured w ith APCs pulsed with Flu MP58-66 peptide for 14 days to expand Flu MP58-66 peptide–specific CD8+ T cells in vitro. When the Flu MP58-66–specific CTL lines were restimulated with Flu MP58-66 peptide, virtually all (> 99%) the Flu MP58-66 tetramer–positive cells produced high levels of IFN-γ (Figure 4b). On the other hand, when the PDC-E2159-167–specific CTL lines were stimulated with PDC-E2159-167 peptide, two distinct tetramer-positive populations with different intensity of tetramer staining were identified. One of them was responsive to the specific peptide stimulation, as indicated by the downmodulated tetramer staining (14, 19) as well as production of IFN-γ. However, the level of IFN-γ production by these cells was lower than that of the Flu MP58-66 tetramer–positive cells. The other tetramer-positive population was nonresponsive to peptide stimulation, as indicated by the unchanged tetramer-staining intensity and the lack of IFN-γ production (Figure 4a). Similar results were reproduced in six patients with PBC (data not shown). These results suggest that the capability of IFN-γ production was lower and heterogeneous within the PDC-E2159-167 tetramer–positive population. It is also important to note that the mean density of tetramer-positive cells for the Flu MP peptide was lower than the PDC-E2 peptide–specific CD8+ T cells, denoting differences in the relative downregulation of TCRs in the two antigen-specific CTL lines. These data also suggest that part of the PDC-E2159-167 tetramer–positive population is anergized. The ability of the PDC-E2159-167 peptide-specific CTLs to produce other cytokines in response to the PDC-E2159-167 peptide stimulation was also assessed. However, no detectable level of cells producing TNF-α, IL-2, IL-4, or IL-10 was observed in any of four patients studied (data not shown).
Figure 4.
Antigen specificity of IFN-γ production by CD8+ T cells for PDC-E2 autoantigen or influenza viral antigen. (a) PDC-E2159-167 peptide–induced CTL lines derived from a PBC patient was restimulated with PDC-E2159-167 peptide or a control peptide in the presence of brefeldin A. The cells were first stained with the PDC-E2159-167 tetramer, followed by intracellular staining for IFN-γ. Displayed in the dot plots are cells gated at lymphocyte population by forward scattering and side scattering and the CD8+ population. (b) Flu MP58-66 peptide-induced CTL lines derived from the same PBC patient was restimulated with Flu MP58-66 peptide or a control peptide in the presence of brefeldin A. The cells were first stained with the Flu MP58-66 tetramer, followed by intracellular staining for IFN-γ. Displayed in the dot plots are cells gated at lymphocyte population by forward scattering and side scattering and the CD8+ population.
PDC-E2159-167 tetramer–reactive cells in the liver.
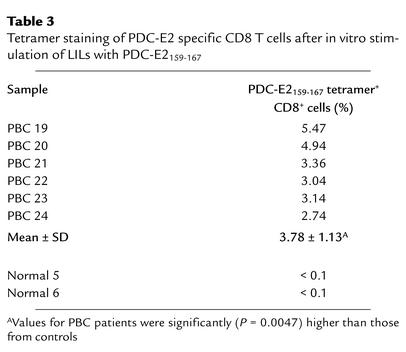
To assess whether PDC-E2159-167–specific CD8+ T cells exist in end-stage PBC livers, LILs were isolated from explanted liver tissue of six HLA-A*0201+ patients (PBC 19 to 24) undergoing liver transplantation. There were undetectable levels of PDC-E2159-167 tetramer–positive CD8+ T cells in uncultured LIL samples. However, when the LILs from the explanted livers of the PBC patients were stimulated with APCs pulsed with PDC-E2159-167 peptide for 14 days to expand peptide-specific CD8+ T cells in vitro, tetramer-binding CD8+ T cells were readily detectable in each of the six PBC patients (Table 3). For comparison, LILs were isolated from the excess liver tissues donated by two healthy HLA-A*0201+ individuals (normal 5 to 6) intended for transplantation. These cells were also stimulated with APCs pulsed with PDC-E2159-167 peptide for 14 days, followed by tetramer staining. No tetramer-positive CD8+ T cells were detected in the in vitro–cultured LILs from either donor (Table 3).
Table 3.
Tetramer staining of PDC-E2 specific CD8 T cells after in vitro stimulation of LILs with PDC-E2159-167
The frequency of PDC-E2159-167 tetramer–reactive cells in the blood and liver.
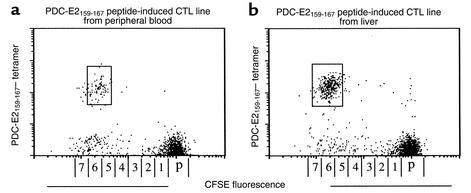
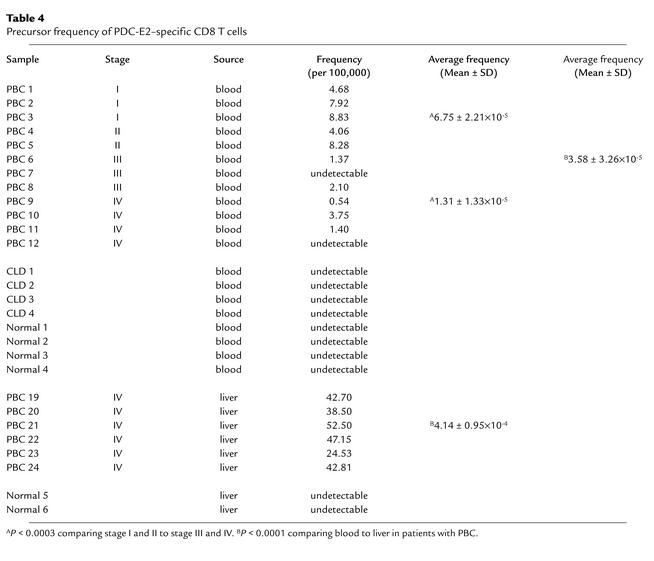
To estimate the frequency of PDC-E2159-167–specific CD8+ T cells in the peripheral blood and liver, PBMCs from 12 HLA-A*0201+ patients with PBC at different stages (PBC 1 to 12) and LILs from end-stage PBC liver of six HLA-A*0201+ PBC patients (PBC 19 to 24) were first stained with CFSE, then cocultured with APCs pulsed with PDC-E2159-167 peptide for 14 days, to expand peptide-specific CD8+ T cells. The induced CTL lines were stained with PDC-E2159-167 tetramer, along with mAb to CD8, and analyzed by flow cytometry. A distinct population of CD8+ T cells positively stained with the PDC-E2159-167 tetramer was detected in 10 of 12 of PBMCs and each of the six cases of LILs studied. Representative results of a PBMC sample and a LIL sample are shown in Figure 5, a and b. The number of cell divisions undergone by the tetramer-positive cells was quantitated relative to the intensity of CFSE fluorescence and was similar in PBMCs and LILs, with values of 6.20 ± 0.79 compared with 6.50 ± 0.55, respectively. The frequencies of the PDC-E2159-167 tetramer–positive cells in the uncultured PBMCs were calculated as described above. More than 90% of the tetramer-positive cells was identified within the single peak of the cell division in all cases studied. The results for 12 PBMC samples and six LIL samples from HLA-A2*0201+ PBC patients, as well as eight PBMC samples and two LIL samples from HLA- A2*0201+ control, are summarized in Table 4. The average frequency of PDC-E2159-167 tetramer–positive CD8 T cells in peripheral blood from 12 PBC patients was 3.58 ± 3.26 ×10⁻⁵, while that in the six end-stage PBC liver was 4.14 ± 0.95 × 10⁻⁴, over tenfold and significantly higher than that in the peripheral blood (P < 0.0001) (Table 4). These data suggest that PDC-E2159-167–specific CTLs are markedly enriched in the liver. In addition, it is important to note that the frequency of PDC-E2159-167–specific CD8+ T cells from peripheral blood were significantly higher in earlier stages I and II of PBC (6.75 ± 2.21 ×10⁻⁵) as compared with later stages III and IV (1.31 ± 1.33 ×10⁻⁵, P < 0.0003).
Figure 5.
In vitro expansion of PDC-E2159-167 tetramer–reactive cells. PBMCs (a) and LILs (b) from HLA-A*0201+ PBC patients were stained with CFSE and cocultured with PDC-E2159-167–loaded APCs for 14 days. The cells were stained with the PDC-E2 tetramer and anti-CD8 Ab’s, followed by flow cytometric analysis. Displayed in the dot plots are cells gated at lymphocyte population by forward scattering and side scattering and the CD8+ population. The number next to the box is the percentage of tetramer-stained cells in the lymphocyte population. The horizontal axis is labeled with numbers corresponding to cell divisions and with “p” depicting the undivided parent cell population. This scale was calculated from the distinct CFSE fluorescence peaks produced by polyclonal stimulation with PHA-P and IL-2.
Table 4.
Precursor frequency of PDC-E2–specific CD8 T cells
Discussion
CTLs play a pivotal role in host defense against viral infections and tumor development. In addition, several lines of evidence suggest that autoreactive CTLs are involved in the pathogenesis of human autoimmune diseases as well as animal models of autoimmune diseases (22–26). In a previous study we demonstrated that PDC-E2159-167–specific CTL lines can be induced from PBMCs in HLA-A*0201+ PBC patients (6). In the present study, we have further characterized the peptide-induced CTLs using a PDC-E2159-167-HLA-A*0201 tetramer reagent. Our results indicate that a distinct population of PDC-E2159-167 tetramer–reactive cells can be detected after in vitro stimulation of PBMCs from HLA-A*0201+ PBC patients, but not from controls. These tetramer-reactive cells demonstrate specific cytotoxicity against PDC-E2159-167–pulsed target cells, as shown by CTL assays using purified tetramer-positive and -negative cells. The in vitro–expanded PDC-E2–specific CD8+ T cells synthesized IFN-γ but not TNF-α and IL-2, the other two major type 1 cytokines produced by CD4+ Th1 cells and CD8+ CTLs specific for viral antigens. In addition, the synthesis of IL-4 and IL-10, major type 2 cytokines, were not observed in these cells.
In the present study, we demonstrate that the ability of the PDC-E2–specific CTLs detected by PDC-E2159-167 tetramer to produce IFN-γ is lower and heterogeneous as compared with influenza-specific CTLs. One possible explanation is that some of the peptide-specific CD8+ T cells may lose their capability to synthesize cytokines during in vitro culturing. However, our finding that virtually all of the Flu MP58-66–specific CD8+ T cells from the same patients were capable of producing IFN-γ argues against this explanation, suggesting that heterogeneity in cytokine profile may be an intrinsic character of the autoantigen-specific CD8+ T cells that is different from virus-specific CD8+ T cells. In contrast to virus-specific immunity, the immune response to tumor cells is often less vigorous and results in CTLs characterized by lower avidity and decreased functional capacity, especially when the tumor Ags are normal self proteins (27–29). Tumor-specific CTLs and autoreactive CTLs may share common features because they both recognize self-antigen. In fact, it is plausible that the epitope derived from endogenous PDC-E2 could be expressed in association with the MHC molecule on all cells, even at a low level, which may lead autoreactive T cells to anergy. There is a relatively small increase in cytotoxicity by PDC-E2159-167–specific CTLs after enrichment of the tetramer-positive cells, probably in part because of the modulation of the effector function of the cells by PDC-E2159-167 tetramer directly bound on cells. The low lytic activity of highly enriched CD8+ cell line specific for PDC-E2159-167, compared with highly enriched Flu MP58-66–specific CTLs, may be explained by the functional impairment of the PDC-E2159-167–specific CTLs.
An alternate interpretation of the functional impairment, in terms of cytokine production, is that the autoantigen-derived peptide-specific PDC-E2159-167 is not identical to the epitope that induces the primary CD8+ T cell response, but a molecular mimic of the original immunogen. The primary CD8+ response may be elicited by an epitope of an unknown xenobiotic agent, such as a chemical or a virus (30). In this case, the PDC-E2159-167 epitope may actually be recognized by the xenobiotic-specific CD8+ T cells as an altered peptide ligand, which is known to be able to induce differential effector functions on the CD8+ T cells (31). This interpretation is consistent with the view that molecular mimicry may be operating in PBC.
Characterization of the intrahepatic T cell response is important for our understanding of the mechanisms underlying liver pathology. In the present study, PDC-E2159-167–specific CTL lines have also been successfully induced from LILs of HLA-A*0201+ patients with end-stage PBC. By combination of CFSE staining and tetramer staining, we estimate that the frequency of PDC-E2159-167–specific CD8 T cells in the end-stage PBC liver is 4.14 × 10⁻⁴, while that in the periphery of PBC patients is 3.58 × 10⁻⁵. These data suggest that PDC-E2159-167–specific CD8+ T cells are enriched approximately tenfold in the liver. There is also the possibility that part of the PDC-E2159-167–specific CTLs may stop dividing during in vitro culture due to anergy. However, most of the tetramer-positive cells were identified within a single peak of cell division, suggesting that PDC-E2159-167–specific CTLs may undergo similar division. In an earlier study using limiting dilution analysis, the frequency of peripheral CD4+ helper T cells specific for the PDC-E2163-176 epitope in PBC patients was estimated to be 3.66 × 10⁻⁷, while that in the liver was 1.66 × 10⁻⁵ to 4.13 × 10⁻⁵, 100-fold enrichment in the liver as compared with PBMC’s (13). Taken together, these studies indicate that there is selective enrichment for both PDC-E2–specific CD4+ and CD8+ autoreactive T cells localized to the site of tissue injury in patients with PBC. The discrepancy of the level of frequency between autoreactive CD4+ and CD8+ T cells could be due to the difference of the methods of detection (32, 33). Interestingly, the extent of enrichment in the PDC-E2–specific autoreactive CD4+ T cells is higher than CD8+ T cells. This difference cannot be readily explained by the differences in the techniques used in the previous and present study. On the other hand, if indeed the values are, in fact, true differences, this could reflect a more important role for CD4+ T cells in the pathogenesis of PBC in late disease. Further study of CD4+ T cells using class II tetramer is warranted and may provide additional information about the nature of the autoreactive CD4+ T cells.
The estimated frequency of PDC-E2–specific CD8+ T cells from peripheral blood was significantly higher in early stages of PBC than in the more advanced disease stages. This is in agreement with a previous report showing that the frequency of peripheral blood CD4+ T cells that respond to the helper T cell epitope 163–176 was significant higher in the early stage of PBC as compared with the advanced stage (13). In previous studies directly comparing the frequency of hepatitis C virus–specific (HCV-specific) CD8+ T cells in peripheral blood and liver, higher frequencies of HCV-specific CD8+ T cells were found in liver biopsies than in the blood of patients with chronic HCV infection (14, 34). In another study using end-stage cirrhotic liver, the HCV-specific T cell could not be found in the liver (35), suggesting that the level of virus-specific intrahepatic CTLs declines as the viral hepatitis progress. Supposing that declination of the disease-specific CTL with the disease progression occurs in PBC, the PDC-E2–specific CD8+ T cells in the liver may be even more abundant during the earlier stages of PBC and be playing an important role in disease development. In addition, the autoreactive CTL response in PBC may also involve other epitopes restricted by HLA-A*0201, as well as epitopes restricted by other HLA molecules. Identification and characterization of these epitopes is required to generate a more complete picture of the overall CTL response in PBC during different disease stages.
In conclusion, this study provides evidence that PDC-E2–specific CD8+ T cells are enriched in the liver. In addition to our data on CD8+ T cells, previous studies have shown that high numbers of PDC-E2–specific CD4+ helper T cells, as well as B cells that produce PDC-E2 autoantibodies, are enriched in the PBC liver (13, 36). We believe that anti–PDC-E2 Ab’s may form immune complexes with antigens and be taken up by APCs, including DCs (6). In addition, autoreactive B cells may be efficient APCs for priming T cells by specific uptake of the autoantigen via surface Ig receptor as reported in other autoimmune diseases (37, 38). These cells may lead to the activation of autoreactive CD4+ and CD8+ T cells, which in turn mediate damage on bilary epithelial cells (BECs) as well as activating autoreactive B cells to produce autoantibodies. Therefore the autoreactive B cells, CD4+ T cells, and CD8+ T cells may collectively form an orchestrated autoimmune effector response that leads to the pathogenesis of PBC. More importantly, the response is focused on PDC-E2, the major mitochondrial antigen, lending further weight to the argument that either native modified PDC-E2 and/or a mimeotope resembling PDC-E2 is instrumental in the etiology of disease.
Acknowledgments
This study was funded by NIH grant DK-39588.
References
- 1.Coppel RL, Gershwin ME. Primary biliary cirrhosis: the molecule and the mimic. Immunol Rev. 1995; 144:17–49. doi: 10.1111/j.1600-065x.1995.tb00064.x. [DOI] [PubMed] [Google Scholar]
- 2.Van de Water J, et al. The role of T cells in primary biliary cirrhosis. Semin Liver Dis. 1997; 17:105–113. doi: 10.1055/s-2007-1007188. [DOI] [PubMed] [Google Scholar]
- 3.Colucci G, Schaffner F, Paronetto F. In situ characterization of the cell-surface antigens of the mononuclear cell infiltrate and bile duct epithelium in primary biliary cirrhosis. Clin Immunol Immunopathol. 1986; 41:35–42. doi: 10.1016/0090-1229(86)90049-8. [DOI] [PubMed] [Google Scholar]
- 4.Van de Water J, et al. Heterogeneity of autoreactive T cell clones specific for the E2 component of the pyruvate dehydrogenase complex in primary biliary cirrhosis. J Exp Med. 1995; 181:723–733. doi: 10.1084/jem.181.2.723. [DOI] [PMC free article] [PubMed] [Google Scholar]
- 5.Shimoda S, Nakamura M, Ishibashi H, Hayashida K, Niho Y. HLA DRB4 0101-restricted immunodominant T cell autoepitope of pyruvate dehydrogenase complex in primary biliary cirrhosis: evidence of molecular mimicry in human autoimmune diseases. J Exp Med. 1995; 181:1835–1845. doi: 10.1084/jem.181.5.1835. [DOI] [PMC free article] [PubMed] [Google Scholar]
- 6.Kita H, et al. Identification of HLA-A2-restricted CD8(+) cytotoxic T cell responses in primary biliary cirrhosis: T cell activation is augmented by immune complexes cross-presented by dendritic cells. J Exp Med. 2002; 195:113–123. doi: 10.1084/jem.20010956. [DOI] [PMC free article] [PubMed] [Google Scholar]
- 7.Huseby ES, et al. A pathogenic role for myelin-specific CD8(+) T cells in a model for multiple sclerosis. J Exp Med. 2001; 194:669–676. doi: 10.1084/jem.194.5.669. [DOI] [PMC free article] [PubMed] [Google Scholar]
- 8.Sun D, et al. Myelin antigen-specific CD8+ T cells are encephalitogenic and produce severe disease in C57BL/6 mice. J Immunol. 2001; 166:7579–7587. doi: 10.4049/jimmunol.166.12.7579. [DOI] [PubMed] [Google Scholar]
- 9.Wong FS, et al. Identification of an MHC class I-restricted autoantigen in type 1 diabetes by screening an organ-specific cDNA library. Nat Med. 1999; 5:1026–1031. doi: 10.1038/12465. [DOI] [PubMed] [Google Scholar]
- 10.Chou YK, et al. Frequency of T cells specific for myelin basic protein and myelin proteolipid protein in blood and cerebrospinal fluid in multiple sclerosis. J Neuroimmunol. 1992; 38:105–113. doi: 10.1016/0165-5728(92)90095-3. [DOI] [PubMed] [Google Scholar]
- 11.Zhang J, et al. Increased frequency of interleukin 2-responsive T cells specific for myelin basic protein and proteolipid protein in peripheral blood and cerebrospinal fluid of patients with multiple sclerosis. J Exp Med. 1994; 179:973–984. doi: 10.1084/jem.179.3.973. [DOI] [PMC free article] [PubMed] [Google Scholar]
- 12.Link H, et al. Virus-reactive and autoreactive T cells are accumulated in cerebrospinal fluid in multiple sclerosis. J Neuroimmunol. 1992; 38:63–73. doi: 10.1016/0165-5728(92)90091-x. [DOI] [PubMed] [Google Scholar]
- 13.Shimoda S, et al. Identification and precursor frequency analysis of a common T cell epitope motif in mitochondrial autoantigens in primary biliary cirrhosis. J Clin Invest. 1998; 102:1831–1840. doi: 10.1172/JCI4213. [DOI] [PMC free article] [PubMed] [Google Scholar]
- 14.He XS, et al. Quantitative analysis of hepatitis C virus-specific CD8(+) T cells in peripheral blood and liver using peptide-MHC tetramers. Proc Natl Acad Sci USA. 1999; 96:5692–5697. doi: 10.1073/pnas.96.10.5692. [DOI] [PMC free article] [PubMed] [Google Scholar]
- 15.Nayersina R, et al. HLA A2 restricted cytotoxic T lymphocyte responses to multiple hepatitis B surface antigen epitopes during hepatitis B virus infection. J Immunol. 1993; 150:4659–4671. [PubMed] [Google Scholar]
- 16.Garboczi DN, Hung DT, Wiley DC. HLA-A2-peptide complexes: refolding and crystallization of molecules expressed in Escherichia coliand complexed with single antigenic peptides. Proc Natl Acad Sci USA. 1992; 89:3429–3433. doi: 10.1073/pnas.89.8.3429. [DOI] [PMC free article] [PubMed] [Google Scholar]
- 17.Altman JD, et al. Phenotypic analysis of antigen-specific T lymphocytes. Science. 1996; 274:94–96. [PubMed] [Google Scholar]
- 18.Sallusto F, Lanzavecchia A. Efficient presentation of soluble antigen by cultured human dendritic cells is maintained by granulocyte/macrophage colony-stimulating factor plus interleukin 4 and downregulated by tumor necrosis factor alpha. J Exp Med. 1994; 179:1109–1118. doi: 10.1084/jem.179.4.1109. [DOI] [PMC free article] [PubMed] [Google Scholar]
- 19.He XS, et al. Direct functional analysis of epitope-specific CD8+ T cells in peripheral blood. Viral Immunol. 2001; 14:59–69. doi: 10.1089/08828240151061400. [DOI] [PubMed] [Google Scholar]
- 20.Novak EJ, Liu AW, Nepom GT, Kwok WW. MHC class II tetramers identify peptide-specific human CD4(+) T cells proliferating in response to influenza A antigen. J Clin Invest. 1999; 104:R63–67. doi: 10.1172/JCI8476. [DOI] [PMC free article] [PubMed] [Google Scholar]
- 21.Dunbar PR, et al. Direct isolation, phenotyping and cloning of low-frequency antigen-specific cytotoxic T lymphocytes from peripheral blood. Curr Biol. 1998; 8:413–416. doi: 10.1016/s0960-9822(98)70161-7. [DOI] [PubMed] [Google Scholar]
- 22.Panina-Bordignon P, et al. Cytotoxic T cells specific for glutamic acid decarboxylase in autoimmune diabetes. J Exp Med. 1995; 181:1923–1927. doi: 10.1084/jem.181.5.1923. [DOI] [PMC free article] [PubMed] [Google Scholar]
- 23.Tsuchida T, et al. Autoreactive CD8+ T-cell responses to human myelin protein-derived peptides. Proc Natl Acad Sci USA. 1994; 91:10859–10863. doi: 10.1073/pnas.91.23.10859. [DOI] [PMC free article] [PubMed] [Google Scholar]
- 24.Pender MP, Csurhes PA, Houghten RA, McCombe PA, Good MF. A study of human T-cell lines generated from multiple sclerosis patients and controls by stimulation with peptides of myelin basic protein. J Neuroimmunol. 1996; 70:65–74. doi: 10.1016/s0165-5728(96)00105-1. [DOI] [PubMed] [Google Scholar]
- 25.D’Elios MM, et al. H(+),K(+)-atpase (proton pump) is the target autoantigen of Th1-type cytotoxic T cells in autoimmune gastritis. Gastroenterology. 2001; 120:377–386. doi: 10.1053/gast.2001.21187. [DOI] [PubMed] [Google Scholar]
- 26.Fiorillo MT, Maragno M, Butler R, Dupuis ML, Sorrentino R. CD8(+) T-cell autoreactivity to an HLA-B27-restricted self-epitope correlates with ankylosing spondylitis. J Clin Invest. 2000; 106:47–53. doi: 10.1172/JCI9295. [DOI] [PMC free article] [PubMed] [Google Scholar]
- 27.Houghton AN. Cancer antigens: immune recognition of self and altered self. J Exp Med. 1994; 180:1–4. doi: 10.1084/jem.180.1.1. [DOI] [PMC free article] [PubMed] [Google Scholar]
- 28.Boon T, et al. Genes coding for tumor-specific rejection antigens. Cold Spring Harb Symp Quant Biol. 1994; 59:617–622. doi: 10.1101/sqb.1994.059.01.070. [DOI] [PubMed] [Google Scholar]
- 29.Lee PP, et al. Characterization of circulating T cells specific for tumor-associated antigens in melanoma patients. Nat Med. 1999; 5:677–685. doi: 10.1038/9525. [DOI] [PubMed] [Google Scholar]
- 30.Long SA, et al. Immunoreactivity of organic mimeotopes of the E2 component of pyruvate dehydrogenase: connecting xenobiotics with primary biliary cirrhosis. J Immunol. 2001; 167:2956–2963. doi: 10.4049/jimmunol.167.5.2956. [DOI] [PubMed] [Google Scholar]
- 31.Evavold BD, Allen PM. Separation of IL-4 production from Th cell proliferation by an altered T cell receptor ligand. Science. 1991; 252:1308–1310. doi: 10.1126/science.1833816. [DOI] [PubMed] [Google Scholar]
- 32.Murali-Krishna K, et al. Counting antigen-specific CD8 T cells: a reevaluation of bystander activation during viral infection. Immunity. 1998; 8:177–187. doi: 10.1016/s1074-7613(00)80470-7. [DOI] [PubMed] [Google Scholar]
- 33.Callan MF, et al. Direct visualization of antigen-specific CD8+ T cells during the primary immune response to Epstein-Barr virus in vivo. J Exp Med. 1998; 187:1395–1402. doi: 10.1084/jem.187.9.1395. [DOI] [PMC free article] [PubMed] [Google Scholar]
- 34.Grabowska AM, et al. Direct ex vivo comparison of the breadth and specificity of the T cells in the liver and peripheral blood of patients with chronic HCV infection. Eur J Immunol. 2001; 31:2388–2394. doi: 10.1002/1521-4141(200108)31:8<2388::aid-immu2388>3.0.co;2-l. [DOI] [PubMed] [Google Scholar]
- 35.Valiante NM, et al. Life, activation and death of intrahepatic lymphocytes in chronic hepatitis C. Immunol Rev. 2000; 174:77–89. doi: 10.1034/j.1600-0528.2002.017417.x. [DOI] [PubMed] [Google Scholar]
- 36.Bjorkland A, Loof L, Mendel-Hartvig I, Totterman TH. Primary biliary cirrhosis. High proportions of B cells in blood and liver tissue produce anti-mitochondrial antibodies of several Ig classes. J Immunol. 1994; 153:2750–2757. [PubMed] [Google Scholar]
- 37.Falcone M, Lee J, Patstone G, Yeung B, Sarvetnick N. B lymphocytes are crucial antigen-presenting cells in the pathogenic autoimmune response to GAD65 antigen in nonobese diabetic mice. J Immunol. 1998; 161:1163–1168. [PubMed] [Google Scholar]
- 38.Serreze DV, et al. B lymphocytes are critical antigen-presenting cells for the initiation of T cell-mediated autoimmune diabetes in nonobese diabetic mice. J Immunol. 1998; 161:3912–3918. [PubMed] [Google Scholar]


