Abstract
Lipodystrophy is a rare disorder that is characterized by selective loss of subcutaneous and visceral fat and is associated with hypertriglyceridemia, hepatomegaly, and disordered glucose metabolism. It has recently been shown that chronic leptin treatment ameliorates these abnormalities. Here we show that chronic leptin treatment improves insulin-stimulated hepatic and peripheral glucose metabolism in severely insulin-resistant lipodystrophic patients. This improvement in insulin action was associated with a marked reduction in hepatic and muscle triglyceride content. These data suggest that leptin may represent an important new therapy to reverse the severe hepatic and muscle insulin resistance and associated hepatic steatosis in patients with lipodystrophy.
Introduction
Lipodystrophy is a rare disorder that is characterized by selective loss of subcutaneous and visceral fat. This disease is associated with hypertriglyceridemia, hepatic steatosis, and severe insulin resistance that often results in diabetes (1–3). Shimomura et al. have demonstrated that leptin treatment reversed insulin resistance in a fat-specific aP2-SREBP-1c knockout mouse model of congenital generalized lipodystrophy (4). More recently, Arioglu Oral et al. found that human recombinant leptin therapy reduced hyperglycemia and hypertriglyceridemia and increased the rate of glucose disappearance during an intravenous insulin tolerance test in nine lipodystrophic patients (5). In order to definitively examine whether or not leptin treatment might improve insulin sensitivity in these patients, as well as the potential mechanism, we studied a subset of three of these patients before and after leptin treatment. Insulin sensitivity in liver and muscle was assessed by a hyperinsulinemic-euglycemic clamp study performed in conjunction with [6,6-2H2]glucose turnover measurements, and patient responses were compared with those of a group of age- and weight-matched control subjects. In addition, the effects of leptin treatment on fat me-tabolism were assessed by measuring rates of whole-body lipolysis, as assessed by [2H5]glycerol turnover measurements before and after leptin treatment, along with 1H NMR measurements of liver and muscle triglyceride content.
Methods
Subjects.
Three patients with severe, generalized lipodystrophy (fasting leptin concentration less than 4 ng/ml) associated with diabetes were studied. Six healthy nonsmoking women of similar age, weight, and body mass index were studied as normal control subjects (Table 1).
Table 1.
Clinical characteristics of subjects following an overnight fast
Lipodystrophic patient NIH-1.
The patient designated NIH-1 was a 17-year-old Caucasian female with a severe form of acquired lipodystrophy associated with type 2 diabetes and severe hypertriglyceridemia (plasma triglyceride concentrations greater than 15,000 mg/dl). She exhibited hyperphagia, irregular menses, massive hepatomegaly, multiple xanthomas, and lack of any subcutaneous fat or features of secondary sexual development.
Lipodystrophic patient NIH-3.
A 26-year-old Caucasian female with congenital generalized lipodystrophy and moderate hypertriglyceridemia (plasma triglycerides approximately 1,200 mg/dl). Her diabetes was treated with metformin (500 mg twice a day) and insulin (25 units Humulin 70/30 subcutaneously at bed time). She had no history of hyperphagia and reported normal menstrual periods.
Lipodystrophic patient NIH-6.
A 35-year-old African-American female with a congenital form of lipodystrophy. The patient was diagnosed with lipodystrophy at age 9 and with type 2 diabetes at age 12. Two siblings were also diagnosed with lipodystrophy. The patient’s diabetes was treated with metformin (850 mg three times a day). She had a history of hyperphagia and reported irregular menses as a teenager prior to undergoing partial hysterectomy for uterine fibroids.
The experimental protocol was reviewed and approved by the Yale University Human Investigation Committee and the Institutional Review Board of the National Institutes of Health. Informed written consent (and parental assent for patient NIH-1, who was 17 years old) was obtained from all subjects. After inclusion in the study, the subjects were admitted to the Yale–New Haven Hospital General Clinical Research Center. In order to assess the effects of leptin treatment on energy intake, patient NIH-6 was given free access to food, and a dietitian monitored caloric intake by weighing the food before and after each meal. In order to assess the effects of chronic leptin treatment on intramuscular fatty acyl coenzyme A (fatty acyl CoA) concentrations, a punch biopsy was performed on the vastus lateralis muscle in the same patient before and after leptin treatment.
Recombinant methionyl human leptin was given subcutaneously every 12 hours in doses to achieve near-physiological plasma concentrations of leptin (5). The treatment was given to all patients for 3 months and to patient NIH-1 for an additional 5 months.
Experimental procedures.
On the morning of the study, following an overnight fast, catheters were placed in an antecubital vein for infusion of glucose and isotopes, and a retrograde catheter was placed in a hand vein for blood withdrawal; the hand was kept warm in a heated box at 70°C. Basal rates of glucose and glycerol turnover were assessed after 180 minutes of infusion of [2H5]glycerol (at a rate of ap-proximately 1.8 mg/min) and [6,6-2H2]glu-cose (prime: 1015 ± 35 μmol/m2; continuous: 10 μmol/m2/min) (Cambridge Isotope Laboratories, Cambridge, Massachusetts, USA). Next, a hyperinsulinemic-euglycemic clamp was initiated in which a primed-con-stant infusion of insulin (120 mU/m2/min) (Humulin R; Eli Lilly and Co., Indianapolis, Indiana, USA) was given and plasma glucose concentrations were maintained at 110 ± 5 mg/dl for 200 minutes by a vari-able infusion of glucose, as previously described (6).
1H NMR measurement of liver and muscle triglyceride content.
Following an overnight fast, the subjects were brought to the Yale Magnetic Resonance Center and positioned in a 2.1 T BioSpec MR spectrometer (Bruker Medical Inc., Billerica, Massachusetts, USA) for measurement of lipid content in the liver and the right calf muscles. After percussion of the liver borders, a 1H surface observation coil (12 cm diameter) was placed rigidly over the lateral aspect of the abdomen, and localized 1H NMR spectra of the liver were obtained. The localization of the observation volume (15 mm3) within the liver was confirmed by imaging the liver with a multislice gradient echo sequence. Prior to each measurement, the water signal was optimized during a shimming procedure, and localized 1H spectra were collected using a PRESS sequence (repetition time of 3 s, echo time of 24.1 ms, 8,192 data points over 5,000 Hz spectral width and 64 scans) complemented by a spatially localized suppression pulse centered in the adipose tissue (7, 8). A Lorentzian filter of 5 Hz was applied before Fourier transformation and manual phase correction. Hepatic triglyceride content was calculated from the area of intrahepatic CH2 resonance relative to the area of the water resonance, using the integration routine of ParaVision software (Bruker Medical Inc.), and was then expressed as a percentage of water content.
Lipids localized in the intramyocellular (IMCL) and extramyocellular (EMCL)space were measured as previously described (9).
Body fat composition.
Body fat composition was determined using a dual-energy x-ray absorptiometer (model QDR 4500; Hologic Inc., Bedford, Massachusetts, USA).
Muscle biopsy studies.
Muscle biopsy samples for fatty acyl CoA were obtained before and after leptin treatment in patient NIH-6. The biopsy was obtained after the subject had been supine and resting quietly for 60 minutes as previously described (10).
Indirect calorimetry.
Continuous indirect calorimetry was performed with a calorimeter (SensorMedics Corp., Anaheim, California, USA) as previously described (11, 12).
Analytical procedures.
Plasma glucose concentrations were measured by the glucose oxidase method (Glucose Analyzer II; Beckman Instruments Inc., Fullerton, California, USA). Plasma immunoreactive insulin, glucagon, and leptin concentrations were measured using antibody radioimmunoassay kits (Linco Research Inc., St. Charles, Missouri, USA). Plasma concentrations of fatty acids were determined using a microfluorometric method (13).
Gas chromatography/mass spectrometry analysis.
2H percent enrichment in plasma glucose and glycerol was determined by gas chromatography/mass spectrometry using a Hewlett-Packard 5890 gas chromatograph interfaced with a Hewlett-Packard 5971A mass selective detector (Hewlett-Packard Co., Palo Alto, California, USA) as described (14).
Liquid chromatography tandem mass spectrometry.
Long-chain fatty acyl CoA’s were extracted from the biopsy sample by solid-phase extraction, and C17 CoA was added as an internal standard, as previously described (15). A tandem mass spectrometer (API 3000; PE Applied Biosystems, Foster City, California, USA) interfaced with a TurboIonspray (PE Applied Biosystems) ionization source in negative electrospray mode was used for LC/MS/MS analysis. Doubly charged ions and corresponding product ions (precursor minus phosphate group) were chosen as a transition pair for multiple-reaction monitoring for quantitation.
Data analysis.
Differences between the control subjects and the lipodystrophic subjects were assessed by the Student t test, and differences before and after leptin treatment were assessed by paired Student t tests. All data are presented as mean ± SEM.
Results
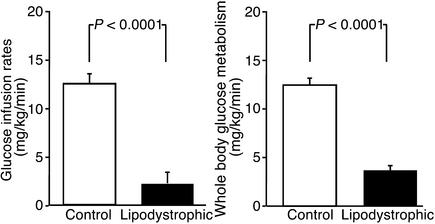
Prior to leptin treatment, all patients had poorly controlled diabetes (as reflected by fasting hyperglycemia and increased glycosylated hemoglobin), and hyperlipidemia (Table 1). Rates of fasting glucose production were higher in the lipodystrophic subjects than in the control subjects (lipodystrophic, 3.6 ± 0.8 mg/kg/min versus control, 1.9 ± 0.1 mg/kg/min; P = 0.019) (Figure 1). The lipodystrophic patients were severely insulin resistant, as reflected by the very low rates of glucose infusion required to maintain euglycemia during the hyperinsulinemic-euglycemic clamp (lipodystrophic, 1.2 ± 0.2 mg/kg/min versus control, 12.7 ± 0.9 mg/kg/min; P < 0.0001) as well as a marked reduction in insulin-stimulated whole-body glucose metabolism (Figure 2). Furthermore, the lipodystrophic patients had severe hepatic insulin resistance, as reflected by decreased insulin suppression of glucose production during the hyperinsulinemic clamp (40% ± 6%) compared with the control subjects (92% ± 7% suppression, P = 0.0004) (Figure 1). These alterations were associated with severe hepatic steatosis in all of the patients: NIH-1, 48% liver triglyceride content, NIH-3, 4.6% liver triglyceride content, and NIH-6, 26% liver triglyceride content. In the control subjects, liver triglyceride content was less than 1%.
Figure 1.
Basal rates of glucose production and percent suppression of hepatic glucose production in subjects during hyperinsulinemic-euglycemic clamp.
Figure 2.
Rates of glucose infusion and whole-body glucose metabolism during the hyperinsulinemic-euglycemic clamp study.
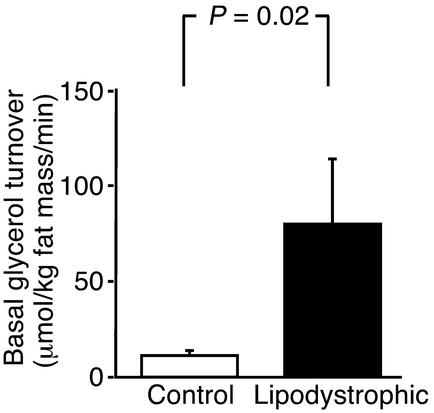
Basal rates of glycerol turnover were markedly increased in the lipodystrophic patients, reflecting very high rates of lipolysis per kg fat tissue (Figure 3), and there was a tendency for energy expenditure to be higher in the lipodystrophic subjects (lipodystrophic, 1,660 ± 108 kcal/day versus control subjects, 1,368 ± 96 kcal/day; P = 0.10), which is consistent with the findings in a previous case report (16). There was a marked reduction in the fasting plasma glucose concentration in patients NIH-3 and NIH-6 after 3 months of leptin treatment and in NIH-1 after 8 months of leptin treatment (Table 1).
Figure 3.
Basal rates of glycerol turnover.
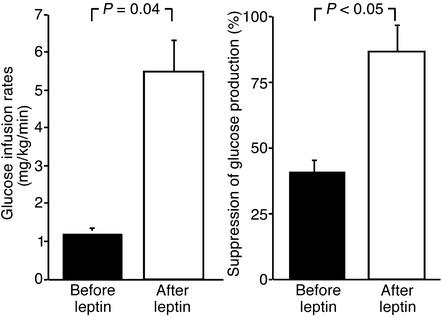
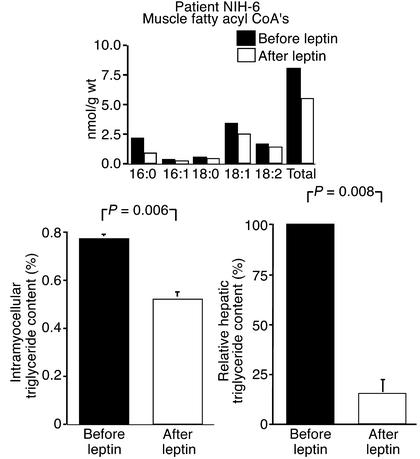
At the time of the postleptin treatment study, all patients had their antidiabetic medication discontinued (5). This improvement in glycemic control could be attributed to a large increase in whole-body insulin sensitivity, as reflected by an approximately fourfold increase in the rate of glucose infusion required to maintain euglycemia (5.4 ± 0.9 mg/kg/min after treatment versus 1.2 ± 0.2 mg/kg/min before treatment; P = 0.04) (Figure 4) and an almost twofold increase in the rate of insulin-stimulated whole-body glucose metabolism (6.1 ± 1.0 mg/kg/min after leptin versus 3.5 ± 0.3 before leptin; P = 0.08). Hepatic insulin responsiveness also improved, as reflected by an increase of insulin suppression of glucose production during the clamp to 82% ± 5% compared with 40% ± 6% prior to leptin treatment (P < 0.05) (Figure 4). These changes in hepatic and peripheral insulin sensitivity were associated with an 86% ± 8% reduction in hepatic triglyceride content (P = 0.008 compared with before leptin treatment) and a 33% ± 3% decrease in muscle triglyceride content (P = 0.006 compared with before leptin treatment) (Figure 5). The leptin treatment–induced reduction in muscle triglyceride content was matched by an approximately 30% decrease in muscle total fatty acyl CoA concentrations (Figure 5, inset). Leptin treatment also had a tendency, but not significant (refer to P value), to decrease glycerol turnover (78 ± 36 μmol/kg fat mass/min before leptin treatment versus 25 ± 7 μmol/kg fat mass/min after leptin treatment; P = 0.23).
Figure 4.
Effect of recombinant leptin treatment on glucose infusion rates and percent suppression of glucose production in lipodystrophic subjects during the hyperinsulinemic-euglycemic clamp study.
Figure 5.
Effect of recombinant leptin treatment on muscle and hepatic triglyceride content (relative to baseline) in lipodystrophic subjects. Inset above: Effect of recombinant leptin treatment on intramyocellular triglyceride content and muscle fatty acyl CoA concentrations in a lipodystrophic subject (NIH-6).
Energy expenditure was assessed by indirect calorimetry in all patients before and after leptin treatment and was found to be slightly, but not significantly, lower in all patients after leptin treatment (1,660 ± 108 kcal/day before treatment versus 1,403 ± 62 kcal/day after treatment, P = 0.08). The fasting respiratory quotient was also unaffected by leptin treatment (0.85 ± 0.06 before treatment versus 0.90 ± 0.03 after treatment; P = 0.1). Energy intake was monitored in patient NIH-6, and leptin treatment caused an approximately 50% reduction in energy intake, from 2,017 kcal/day before treatment to 962 kcal/day after 3 months of treatment.
Discussion
The lipodystrophic patients manifested severe hepatic and peripheral insulin resistance associated with diabetes, hyperlipidemia, and hepatic steatosis. These patients also had increased rates of glycerol turnover, reflecting increased rates of lipolysis in their residual fat mass. Given their almost complete lack of subcutaneous and visceral fat, these data suggest that there is a significant amount of intrahepatic or intravascular triglyceride lipolysis occurring in these individuals. Chronic leptin treatment caused a marked improvement in glycemic control in all three lipodystrophic patients and reduced their need for both oral hypoglycemic agents and insulin, and is con-sistent with the results of Shimomura et al. in aP2-SREBP-1c knockout lipodystrophic mice (4). The improved glycemic control could be attributed to a marked increase in their insulin responsiveness, as reflected by an almost fourfold increase in the rate of glucose infusion required to maintain euglycemia during the clamp, and these data are consistent with the improved response to insulin tolerance testing seen in an entire cohort (5). In order to ascertain the mechanism for the improved insulin responsiveness, we also assessed rates of hepatic and peripheral glucose metabolism and found that leptin therapy caused an approximately twofold increase in insulin suppression of hepatic glucose production and an almost twofold increase in insulin-stimulated peripheral glucose disposal. These changes were associated with an approximately 85% reduction of hepatic triglyceride content and an approximately 30% reduction in intramyocellular triglyceride and fatty acyl CoA content.
Previous studies by our group (9, 17–20) and others (7, 21, 22) have demonstrated a strong relationship between triglyceride content in liver and muscle and insulin resistance in these tissues. These data support the hypothesis that a similar mechanism for insulin resistance might occur in patients with severe lipodystrophy and more common forms of insulin resistance associated with obesity and type 2 diabetes (23).
The mechanism by which fat causes insulin resistance in human skeletal muscle remains controversial. Previous in vitro studies by Randle and colleagues have suggested that fat induces insulin resistance by increasing the NADH/NAD and fatty acyl CoA/CoA ratios, leading to a reduction in pyruvate dehydrogenase activity and an increase in citrate concentration (24). The increase in citrate concentration leads to a decrease in phosphofructokinase activity, leading to an accumulation of glucose-6-phosphate, which in turn inhibits hexokinase. However, recent studies by our group have challenged this hypothesis and found evidence to suggest that intracellular accumulation of fatty acid–derived metabolites, such as fatty acyl CoA’s, leads to activation of protein kinase C-θ, resulting in activation of a serine/threonine cascade that leads to increased serine phosphorylation of insulin receptor substrate-1 (IRS-1). IRS-1 in turn interferes with IRS-1 tyrosine phosphorylation, resulting in decreased activation of phosphatidylinositol 3-kinase, a key step in activating glucose transporter-4 translocation in skeletal muscle (17, 18). Hepatic accumulation of triglyceride and fatty acid-derived metabolites is likely to cause insulin resistance in the liver by a similar mechanism. In the livers of both lipodystrophic mice (19) and transgenic mice with steatosis due to over-expression of lipoprotein lipase (20), decreased insulin activation of IRS-2–associated phosphatidylinositol 3-kinase activity was observed. In addition, fatty acids have been shown to increase hepatic gluconeogenesis (25, 26). While there were no appreciable differences in intramyocellular triglyceride content between the control and lipodystrophic patients, it is likely that a fatty acid–derived intermediate, rather than intramyocellular triglyceride, is responsible for mediating the insulin resistance (23).
Leptin treatment may have caused this reduction in hepatocyte and myocellular triglyceride content through decreased food intake and/or promotion of increased energy expenditure. Consistent with the former possibility, all patients reported a marked reduction in appetite following leptin treatment. Furthermore, when energy intake was carefully monitored in an inpatient setting, we found an approximately 50% reduction in the caloric intake in one patient following leptin therapy, which is similar to the self-reported observations by Arioglu Oral et al. (5) in the entire set of nine lipodystrophic patients and by Farooqi et al. (27) in a child with congenital leptin deficiency who was treated with leptin. In contrast, we found that leptin treatment tended to cause a decrease in energy expenditure, which is consistent with the observations in the entire set of lipodystrophic patients (5). Taken together, these data suggest that intrahepatic and intramyocellular lipid lowering effects of leptin were mediated mostly by a reduction in energy intake, as opposed to a leptin-induced increase in energy expenditure, although a lipolytic effect of leptin on these tissues cannot be ruled out (4, 28).
In summary, this report demonstrates that patients with severe lipodystrophy are severely insulin resistant, which can be attributed to defects in insulin action in both liver and muscle. Chronic leptin treatment caused a marked improvement in whole-body insulin-stimulated glucose metabolism, which could be attributed to both improved insulin sensitivity in the liver (as reflected by improved insulin suppression of glucose production) and in the muscle (as reflected by an increase in insulin-stimulated peripheral glucose uptake). These changes were associated with a marked reduction in hepatic and muscle triglyceride content. These data suggest that leptin therapy may represent an important new therapy to treat insulin resistance, hepatic steatosis, and the associated diabetes in patients with severe lipodystrophy.
Acknowledgments
We thank Yanna Kosover, Anthony Romanelli, and the staff of the Yale–New Haven Hospital Adult Clinical Research Center for expert technical assistance with the studies. We would also like to thank the patients and volunteers for participating in this study. This work was supported by NIH grants R01 DK-42930 (G.I. Shulman), K23 DK-02347 (K.F. Petersen), M01 RR-00125, and P30 DK-45735, and by the American Diabetes Association (K.F. Petersen).
Footnotes
See the related Commentary beginning on page 1285.
References
- 1.Rossini AA, et al. Metabolic and endocrine studies in a case of lipoatrophic diabetes. Metabolism. 1977;26:637–650. doi: 10.1016/0026-0495(77)90085-3. [DOI] [PubMed] [Google Scholar]
- 2.Reitman ML, Arioglu E, Gavrilova O, Taylor SI. Lipoatrophy revisited. Trends Endocrinol Metab. 2000;11:410–416. doi: 10.1016/s1043-2760(00)00309-x. [DOI] [PubMed] [Google Scholar]
- 3.Arioglu E, et al. Efficacy and safety of troglitazone in the treatment of lipodystrophy syndromes. Ann Intern Med. 2000;133:263–274. doi: 10.7326/0003-4819-133-4-200008150-00009. [DOI] [PubMed] [Google Scholar]
- 4.Shimomura I, Hammer RE, Ikemoto S, Brown MS, Goldstein JL. Leptin reverses insulin resistance and diabetes mellitus in mice with congenital lipodystrophy. Nature. 1999;401:73–76. doi: 10.1038/43448. [DOI] [PubMed] [Google Scholar]
- 5.Oral EA, et al. Efficacy and safety of leptin replacement in lipodystrophy. N Engl J Med. 2002;346:570–578. doi: 10.1056/NEJMoa012437. [DOI] [PubMed] [Google Scholar]
- 6.Maggs DG, et al. Metabolic effects of troglitazone monotherapy in type 2 diabetes mellitus. A randomized, double-blind, placebo-controlled trial. Ann Intern Med. 1998;128:176–185. doi: 10.7326/0003-4819-128-3-199802010-00002. [DOI] [PubMed] [Google Scholar]
- 7.Szczepaniak LS, et al. Measurement of intracellular triglyceride stores by 1H spectroscopy: validation in vivo. Am J Physiol. 1999;276:E977–E989. doi: 10.1152/ajpendo.1999.276.5.E977. [DOI] [PubMed] [Google Scholar]
- 8.Blamire AM, Graham GD, Rothman DL, Prichard JW. Proton spectroscopy of human stroke: assessment of transverse relaxation times and partial volume effects in single volume steam MRS. Magn Reson Imaging. 1994;12:1227–1235. doi: 10.1016/0730-725x(94)90087-8. [DOI] [PubMed] [Google Scholar]
- 9.Mayerson A, et al. The effects of rosiglitazone on insulin sensitivity, lipolysis, and hepatic and skeletal muscle triglyceride content in patients with type 2 diabetes. Diabetes. 2002;51:797–802. doi: 10.2337/diabetes.51.3.797. [DOI] [PMC free article] [PubMed] [Google Scholar]
- 10.Lebon V, et al. Effect of triiodothyronine on mitochondrial energy coupling in human skeletal muscle assessed by 31P/13C NMR spectroscopy. J Clin Invest. 2001;108:733–737. doi:10.1172/JCI200111775. doi: 10.1172/JCI11775. [DOI] [PMC free article] [PubMed] [Google Scholar]
- 11.Lusk G. Animal calorimetry: analysis of the oxidation of mixtures of carbohydrates and fat: a correction. J Biol Chem. 1924;59:41–42. [Google Scholar]
- 12.Petersen KF, et al. Mechanism of troglitazone action in type 2 diabetes. Diabetes. 2000;49:827–831. doi: 10.2337/diabetes.49.5.827. [DOI] [PubMed] [Google Scholar]
- 13.Miles J, Glasscock R, Aikens J, Gerich J, Haymond M. A microfluorometric method for the determination of free fatty acids in plasma. J Lipid Res. 1983;24:96–99. [PubMed] [Google Scholar]
- 14.Wolfe, R.R. 1992. Radioactive and stable isotope tracers in biomedicine: principles and practice of kinetic analysis. Wiley-Liss Inc. New York, New York, USA. 49–118.
- 15.Bligh EG, Dryer WJ. A rapid method of total lipid extraction and purification. Canadian J Biochem. 1959;37:911–917. doi: 10.1139/o59-099. [DOI] [PubMed] [Google Scholar]
- 16.Klein S, Jahoor F, Wolfe RR, Stuart CA. Generalized lipodystrophy: in vivo evidence for hypermetabolism and insulin-resistant lipid, glucose, and amino acid kinetics. Metabolism. 1992;41:893–896. doi: 10.1016/0026-0495(92)90173-8. [DOI] [PubMed] [Google Scholar]
- 17.Dresner A, et al. Effects of free fatty acids on glucose transport and IRS-1-associated phosphatidylinositol 3-kinase activity. J Clin Invest. 1999;103:253–259. doi: 10.1172/JCI5001. [DOI] [PMC free article] [PubMed] [Google Scholar]
- 18.Griffin ME, et al. Free fatty acid-induced insulin resistance is associated with activation of protein kinase C theta and alterations in the insulin signaling cascade. Diabetes. 1999;48:1270–1274. doi: 10.2337/diabetes.48.6.1270. [DOI] [PubMed] [Google Scholar]
- 19.Kim JK, Gavrilova O, Chen Y, Reitman ML, Shulman GI. Mechanism of insulin resistance in A-ZIP/F-1 fatless mice. J Biol Chem. 2000;275:8456–8460. doi: 10.1074/jbc.275.12.8456. [DOI] [PubMed] [Google Scholar]
- 20.Kim JK, et al. Tissue-specific overexpression of lipoprotein lipase causes tissue-specific insulin resistance. Proc Natl Acad Sci USA. 2001;98:7522–7527. doi: 10.1073/pnas.121164498. [DOI] [PMC free article] [PubMed] [Google Scholar]
- 21.Perseghin G, et al. Intramyocellular triglyceride content is a determinant of in vivo insulin resistance in humans: a 1H-13C nuclear magnetic resonance spectroscopy assessment in offspring of type 2 diabetic parents. Diabetes. 1999;48:1600–1606. doi: 10.2337/diabetes.48.8.1600. [DOI] [PubMed] [Google Scholar]
- 22.Ryysy L, et al. Hepatic fat content and insulin action on free fatty acids and glucose metabolism rather than insulin absorption are associated with insulin requirements during insulin therapy in type 2 diabetic patients. Diabetes. 2000;49:749–758. doi: 10.2337/diabetes.49.5.749. [DOI] [PubMed] [Google Scholar]
- 23.Shulman GI. Cellular mechanisms of insulin resistance. J Clin Invest. 2000;106:171–176. doi: 10.1172/JCI10583. [DOI] [PMC free article] [PubMed] [Google Scholar]
- 24.Randle PJ, Garland PB, Hales CN, Newsholme EA. The glucose fatty-acid cycle: its role in insulin sensitivity and the metabolic disturbances of diabetes mellitus. Lancet. 1963;1:785–789. doi: 10.1016/s0140-6736(63)91500-9. [DOI] [PubMed] [Google Scholar]
- 25.Chen X, Iqbal N, Boden G. The effect of free fatty acids on gluconeogenesis and glycogenolysis in normal subjects. J Clin Invest. 1999;103:365–372. doi: 10.1172/JCI5479. [DOI] [PMC free article] [PubMed] [Google Scholar]
- 26.Roden M, et al. Effects of free fatty acid elevation on postabsorptive endogenous glucose production and gluconeogenesis in man. Diabetes. 2000;49:701–707. doi: 10.2337/diabetes.49.5.701. [DOI] [PubMed] [Google Scholar]
- 27.Farooqi, et al. Effects of recombinant leptin therapy in a child with congenital leptin deficiency. N Engl J Med. 1999;341:879–884. doi: 10.1056/NEJM199909163411204. [DOI] [PubMed] [Google Scholar]
- 28.Unger RH, Zhou YT, Orci L. Regulation of fatty acid homeostasis in cells: novel role of leptin. Proc Natl Acad Sci USA. 1999;96:2327–2332. doi: 10.1073/pnas.96.5.2327. [DOI] [PMC free article] [PubMed] [Google Scholar]


