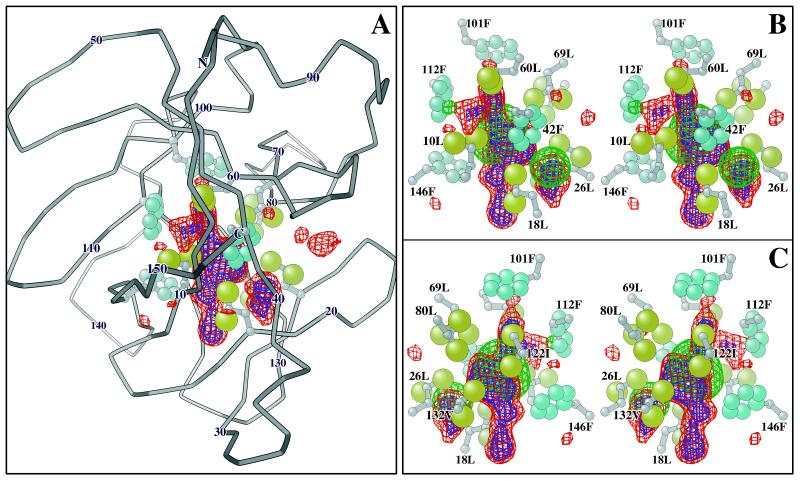
Figure 2.
Difference map of the density distribution within the cavity region of the hIL-1β molecule that is not accounted for by the refined atomic model. (A) The difference electron density map within a sphere of 10-Å radius is displayed inside the Cα trace of an hIL-1β molecule viewed from the side containing the C terminus (center) and N terminus (top), with ball and stick representations of the cavity forming residues. The methyl groups of the aliphatic residues are drawn as large tan spheres, and the aromatic carbons are smaller, light blue spheres. Every tenth Cα atom is labeled, except 120, which is obscured behind the cavity density map. The red contours contain 70% of the total of 18 solvent electrons integrated in the cavity region, and the blue contours contain 50% of these electrons. (B and C) Stereopair images of the cavity solvent density within a sphere of 6-Å radius are viewed from the front (B) and back (C) of the orientation shown in A. The six leucine (L) one isoleucine (I), one valine (V), and four phenylalanine (F) residues forming the cavity are labeled. The green contours superimposed on the solvent difference map mark the envelope of the atomic model of the partially occupied water molecules in the cavity, refined with the protein model by xplor. This model, which contains 18.5 electrons, is contoured at the 70% level. The difference in shape of the experimental solvent difference map (red and blue) based on refinement of phases for the low resolution diffraction data and the xplor model of the cavity water (green) based on refinement of a single-conformer protein model may be caused by fluctuations in the cavity shape or, alternatively, to noise in diffraction data. The graphics were created with o (28), molscript (29), and rayshade (30).

