

Abstract
Steady-state concentrations of mitochondrial Mg2+ previously have been shown to vary with the expression of Mrs2p, a component of the inner mitochondrial membrane with two transmembrane domains. While its structural and functional similarity to the bacterial Mg2+ transport protein CorA suggested a role for Mrs2p in Mg2+ influx into the organelle, other functions in cation homeostasis could not be excluded. Making use of the fluorescent dye mag-fura 2 to measure free Mg2+ concentrations continuously, we describe here a high capacity, rapid Mg2+ influx system in isolated yeast mitochondria, driven by the mitochondrial membrane potential Δψ and inhibited by cobalt(III)hexaammine. Overexpression of Mrs2p increases influx rates 5-fold, while the deletion of the MRS2 gene abolishes this high capacity Mg2+ influx. Mg2+ efflux from isolated mitochondria, observed with low Δψ only, also requires the presence of Mrs2p. Cross-linking experiments revealed the presence of Mrs2p-containing complexes in the mitochondrial membrane, probably constituting Mrs2p homo- oligomers. Taken together, these findings characterize Mrs2p as the first molecularly identified metal ion channel protein in the inner mitochondrial membrane.
Keywords: mag-fura 2/membrane potential Δψ/mitochon drial Mg2+ influx/mrs2Δ mutant/protein cross-linking
Introduction
Concentrations of free Mg2+ in the matrix of mammalian mitochondria ([Mg2+]m) have been estimated to range between 0.2 and 1.5 mM (Jung et al., 1990; Rutter et al., 1990) and are thus in the same range as in the cytoplasm. Part of the observed variation in [Mg2+]m may result from cyclic changes in the metabolic state of the mitochondria coupled with a changed availability of ligands (Pi, ADP and ATP), and are regarded as being of considerable importance for the control of respiration (Jung et al., 1990, 1997). In addition, hormone-induced changes of [Mg2+]m have been described. Mitochondrial Mg2+ pools may be mobilized to adjust cytoplasmic pools, as observed upon an increase in cytosolic cAMP levels (Romani et al., 1991; Romani and Scarpa, 2000). These observations indicate that mitochondrial Mg2+ transport processes may play an important role in the cellular Mg2+ homeostasis and in the regulation of cell and mitochondrial functions. Studies with isolated mitochondria indicated that changes in the extramitochondrial Mg2+ concentration ([Mg2+]e) elicited changes in the mitochondrial total and matrix free Mg2+ in a range that can influence the Mg2+-sensitive matrix enzymes and transporters localized in the inner mitochondrial membrane (Jung et al., 1990, 1997; Rutter et al., 1990; Rodriguez-Zavala and Moreno-Sanchez, 1998).
Flux studies with 28Mg2+ revealed the presence of a concentration-dependent and saturable Mg2+ influx mechanism (Diwan et al., 1979; Diwan, 1987). Jung et al. (1997) described a respiration-dependent uptake of Mg2+ into mitochondria, which was promoted by the membrane potential. In the absence of extramitochondrial Mg2+, a respiration-dependent Mg2+ efflux has been observed, which requires high ΔpH across the inner mitochondrial membrane (Rutter et al., 1990). From these very limited data, it has been proposed that Mg2+ enters mitochondria via a uniporter or by ‘unspecific leak’, and that efflux occurs by means of an Mg2+/H+ antiporter.
While it has not been possible yet to identify any of the eukaryotic Mg2+ transporters in molecular terms, genes for two bacterial Mg2+ transport systems have been characterized in detail. The CorA system is virtually ubiquitous in bacteria and constitutively expressed (Smith and Maguire, 1998). Additional transport systems are encoded by the bacterial MgtA and MgtB genes (Smith and Maguire, 1998). Cobalt(III)hexaammine [Co(III)Hex], an analog of the hydrated Mg2+ cation, has been shown to inhibit specifically the CorA-mediated Mg2+ influx into bacteria (Kucharski et al., 2000).
Two protein families in eukaryotes, Mrs2p in mitochondria and Alr1p in the plasma membrane, have been recognized as distant relatives of the bacterial CorA Mg2+ transport protein family (MacDiarmid and Gardner, 1998; Bui et al., 1999; Schock et al., 2000; Graschopf et al., 2001; Zsurka et al., 2001). The only apparent feature in common of all of these proteins is the presence of two predicted transmembrane domains near the C-terminus, with a conserved motif Y/F-G-M-N in the short sequence connecting them. Yet when heterologously expressed, they can functionally substitute each other at least in part (Bui et al., 1999; Graschopf et al., 2001). Whereas transport activity and ion specificity of CorA have been studied in some detail (Smith et al., 1998; Szegedy and Maguire, 1999), evidence for Mrs2p being part of the mitochondrial Mg2+ transport system is still indirect, mostly based on its effects on steady-state concentra tions of total mitochondrial Mg2+ (Bui et al., 1999; Gregan et al., 2001).
Because the short-lived radioisotope 28Mg2+ is hard to obtain and to handle, we have determined changes in free ionized Mg2+ ([Mg2+]m) by use of the Mg2+-sensitive dye mag-fura 2 (Raju et al., 1989; Rutter et al., 1990; Schweigel et al., 2000) in isolated yeast mitochondria. We obtained evidence for a rapid, high capacity Mg2+ influx into isolated mitochondria, saturating at [Mg2+]m values of 5 mM. This ion flux was found to be inhibited by Co(III)Hex and driven by the mitochondrial membrane potential. Rates of influx were found to correlate with the level of expression of the mitochondrial Mrs2 protein, consistent with its role as a major component of the mitochondrial Mg2+ influx system. Cross-linking revealed the presence of Mrs2p-containing complexes, which are likely to constitute oligomers of the Mrs2p monomer of 54 kDa. To our knowledge, this is the first molecular characterization of a mitochondrial metal ion transport system.
Results
Our previous studies had revealed that the steady-state total Mg2+ concentration of yeast mitochondria varied with the expression level of Mrs2p. Values were reduced by a factor of two or increased by 50% relative to wild-type cells when Mrs2p was absent or overexpressed, respectively (Bui et al., 1999; Gregan et al., 2001). These results did not allow us to discriminate between a direct involvement of Mrs2p in the Mg2+ influx system or an indirect role, e.g. in controlling mitochondrial Mg2+ homeostasis. By use of the Mg2+-sensitive fluorescent dye mag-fura 2, we sought here to determine Mg2+ influx rates into yeast mitochondria and to correlate them with various expression levels of Mrs2p.
Measurement of the mitochondrial [Mg2+]m by the use of mag-fura 2
Mitochondria were isolated from cells of the wild-type yeast strain DBY747 grown in standard media and transferred into a nominally Mg2+-free solution for loading with the membrane-permeant acetoxymethyl ester (AM) of the Mg2+-sensitive fluorescent dye mag-fura 2, activation of the probe and determination of the basal intramitochondrial free [Mg2+]m. Figure 1 shows the original fluorescence recordings collected at the individual 340 and 380 nm excitation wavelengths (standard excitation wavelengths for the ion-bound and the free mag-fura 2, respectively), and the corresponding 340/380 nm wavelength ratio from a representative experiment. With 5 µm mag-fura 2 in the mitochondrial suspensions, loading with and activation of the dye by intra-organellar esterases was efficient, resulting in fluorescence intensities exceeding the autofluorescence of the unloaded samples (see inset in Figure 1A) by a factor of >30.


Fig. 1. Original record of an Mg2+ measurement with yeast mitochondria and of the calibration procedure. Mag-fura 2 emission at a wavelength of 510 nm was measured upon excitation at 380 and 340 nm (standard excitation wavelength for the free mag-fura 2 and for the ion-bound mag-fura 2, respectively). (A) Single wavelength fluorescence intensities of mag-fura 2-loaded yeast mitochondria as a function of time and [Mg2+]e. Measurements were started with mag-fura 2-loaded mitochondria in essentially Mg2+-free buffer (see Materials and methods). Mg2+ was added to final concentrations of 1, 5 and 10 mM. [Mg2+]e was raised to 25 mM before the addition of SDS, resulting in Rmax, and the addition of EDTA led to Rmin values. Inset: autofluorescence of mag-fura 2-unloaded mitochondria. (B) The 340/380 nm ratio of the fluorescence intensities shown in Figure 2A. Note that increases in the ratio are caused by an increase in the 340 nm intensity and a decrease in the 380 nm intensity, indicating that changes in the ratio are due in fact to alterations in the ratio of [Mg2+:mag-fura 2]/[mag-fura 2]. (C) Effect of an increase of the extramitochondrial [Ca2+] on the 340/380 nm ratio of the fluorescence intensities.
When the [Mg2+]e was increased stepwise to 1, 5 and 10 mM, an increase of the fluorescent intensity at 340 nm and a decrease of the fluorescent intensity at 380 nm occurred (Figure 1A and B), indicating ion transients across the mitochondrial membranes. An increase of [Mg2+]e from 10 to 25 mM induced no further change in the two fluorescence intensity traces or of the 340/380 nm ratio (not shown). In contrast to the effect of increasing [Mg2+]e, externally added Ca2+ had only little influence on the 340/380 nm ratio of fluorescence intensities of intramitochondrial entrapped mag-fura 2 (Figure 1C).
For reasons of calibration of the fluorescence signals to [Mg2+], SDS was added to rupture mitochondrial membranes, thus liberating mag-fura 2 to the medium with [Mg2+]e of 25 mM, sufficient to saturate the dye and giving a maximal 340/380 nm ratio (Rmax). Finally, EDTA was added to withdraw Mg2+ from mag-fura 2, resulting in a minimal 340/380 nm ratio (Rmin) (Figure 1A and B). As revealed by confocal microscopy of mag-fura 2-loaded mitochondria and mitoplasts (with outer membranes ruptured), the dye appeared to be distributed homogenously in the matrix of the organelles (data not shown). Addition of SDS or Triton to rupture membranes, or of the ionophore A23187 to equilibrate Mg2+ across membranes, resulted in similar Rmax values, confirming that mag-fura 2 was entrapped in the organelle and liberated by these treatments. Constant steady-state plateau levels of Mg2+-loaded mitochondria excluded leakage of mag-fura 2 or of Mg2+ from the organelles. Sucrose gradient-purified mitochondrial preparations showed the same response as those from differential centrifugation (not shown). Therefore, organelles other than mitochondria apparently did not contribute significantly to the mag-fura 2 signals obtained.
[Mg2+]m of wild-type yeast mitochondria
Basal [Mg2+]m of wild-type yeast mitochondria (Figure 2A; Table I) was calculated to be 0.69 ± 0.05 mM when measured in nominally Mg2+-free medium. When the [Mg2+]e was increased stepwise to final concentrations of 1, 5 and 10 mM, [Mg2+]m increased rapidly and reached new, steady-state plateau levels within ∼50 s (Figure 2A; Table I). Maximum [Mg2+]m of ∼5 mM was reached with an [Mg2+]e of 10 mM.

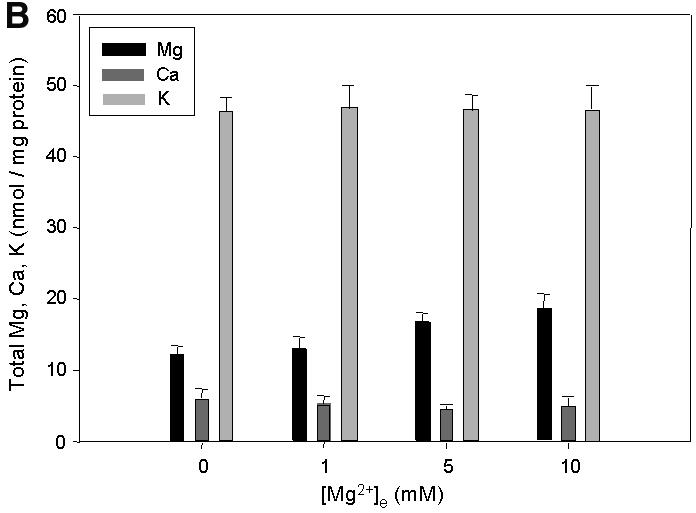

Fig. 2. Effect of the expression and functionality of Mrs2p on [Mg2+]m, total [Mg2+] and group II intron splicing. Ratios of fluorescence intensities as displayed in Figure 1A were used for the calculation of [Mg2+]m values using the formula of Grynkiewicz et al. (1985) as described in Materials and methods. Mitochondria were isolated from cells expressing a single chromosomal copy of MRS2 (WT), from cells expressing Mrs2p from multicopy vector pVT-U 103 [(MRS2)n] and from cells with a disruption in the MRS2 gene (Δmrs2). (A) Effect of variation in extramitochondrial [Mg2+] on [Mg2+]m of WT, (MRS2)n and Δmrs2 mitochondria. Representative original recordings for [Mg2+]m are shown. Inset: initial 5 s response after increasing [Mg2+]e to 1 mM. Note the differences in the slopes of the tracings from the various mitochondria types, reflecting that Mg2+ uptake rates depend on Mrs2p expression. (B) Effect of variation in extramitochondrial [Mg2+] on total Mg2+, Ca2+ and K+ concentrations of wild-type MRS2 yeast mitochondria. Atomic absorption spectroscopy was applied on mag-fura 2-loaded yeast mitochondrial suspensions without added Mg2+ and 60 s after addition of Mg2+ to final concentrations as indicated. (C) Effects of an amino acid substitution in the critical F/Y-G-M-N motif on [Mg2+]m and group II intron RNA splicing. By site-directed mutation, a base substitution G998→C998 was introduced into the MRS2 gene (mrs2-J1 allele), resulting in a glycine to alanine substitution in the F/Y-G-M-N motif, characteristic of the CorA, Mrs2 and Alr1 proteins. Cells lacking the chromosomal MRS2 copy (mrs2Δ) were transformed with pVT-U 103 multicopy plasmids lacking any insert (mrs2Δ) or expressing the wild-type MRS2 allele [mrs2Δ (MRS2)n] or the mrs2-J1 mutant allele [mrs2Δ (mrs2-J1)n]. Representative [Mg2+]m values of the three transformants are compared. Inset: RT–PCR amplification of the exon–exon B1–B2 junction from spliced RNA and of the exon–intron B1–bI1 junction from precursor RNA of the mitochondrial cytochrome b gene. Primers used, assay conditions and visualization of PCR products were as described previously by Gregan et al. (2001).
Table I. Steady-state [Mg2+]m values of isolated wild-type mitochondria at distinct [Mg2+]e, in the absence and presence of Co(III) Hex.
| [Mg2+]e (mM) | Steady-state [Mg2+]m ± SE of wild-type mitochondria (mM) |
|
|---|---|---|
| Control | After 1 mM Co(III)Hex | |
| 0 | 0.69 ± 0.05 | 0.34 ± 0.06 |
| 1 | 2.93 ± 0.37 | 0.95 ± 0.09 |
| 5 | 4.42 ± 0.43 | 1.07 ± 0.13 |
| 10 | 5.00 ± 0.54 | 1.12 ± 0.22 |
Co(III)Hex, an analog of the hydrated Mg2+ ion, has been shown to inhibit the CorA-mediated Mg2+ uptake in bacteria (Kucharski et al., 2000). When yeast mitochondria were incubated in the presence of 1 mM Co(III)Hex, steady-state [Mg2+]m of isolated mitochondria, measured 50 s after raising [Mg2+]e, was strongly reduced (Table I). Influx of Ca2+, in contrast, was not inhibited to any significant extent (data not shown). Co(III)Hex thus inhibits the influx of Mg2+ into mitochondrial preparations used here, but the inhibitor concentrations needed were higher than those used in bacterial cell suspensions (Kucharski et al., 2000).
Total Mg2+concentrations ([Mg2+]t), which are composed of a large fraction of bound Mg2+ and a small fraction of free Mg2+ (Jung et al., 1997), increased moderately with the elevation of [Mg2+]m induced by high [Mg2+]e. In contrast, total intramitochondrial potassium and calcium concentrations were not affected (Figure 2B). Thus the slopes of the Mg2+ plots represent initial rates of Mg2+ influx, Δ[Mg2+]m/dt. When [Mg2+]e was raised to 1 mM, Δ[Mg2+]m/dt was calculated to be 158 ± 27 µM/s, equivalent to an increase of 25%/s relative to the basal [Mg2+]m value. The observed flux rates were insensitive to changes in incubation temperature from 16 to 37°C (data not shown).
Taken together, these data show that under our experimental conditions, a rapid, high capacity influx of Mg2+ into yeast mitochondria takes place, which saturates at maximum [Mg2+]m of ∼5 mM with an [Mg2+]e of 10 mM. The high flux rates and their low temperature sensitivity are typical features of channel-mediated ion fluxes and contrast with observations on activities mediated by transporters or pumps. The Mg2+ influx assay with yeast mitochondria proved to be highly reproducible and adequate to characterize factors affecting Mg2+ influx.
Altered Mg2+ influx in Mrs2p-overexpressing yeast mitochondria
Yeast cells overexpressing Mrs2p can accumulate highly elevated levels of this protein in their mitochondria (Gregan et al., 2001). Expression of the protein from a multicopy plasmid resulted in a small, but significant increase of resting [Mg2+]m as compared with organelles from wild-type cells (Figure 2A and C). This is consistent with the previously observed increase of the total [Mg2+] in yeast mitochondria with high Mrs2p doses (Gregan et al. 2001; and unpublished results). Effects of Mrs2p overexpression on the rate of the initial Mg2+-dependent increase in [Mg2+]m were much more pronounced. With [Mg2+]e of 1 mM, it was 5-fold elevated in Mrs2p-overexpressing as compared with wild-type yeast mitochondria (Figure 2A). Interestingly, the steady-state plateau levels of [Mg2+]m, reached after increasing [Mg2+]e were only slightly higher than the wild-type values. As with wild-type mitochondria, the Mg2+ uptake saturates at [Mg2+]e of 10 mM. These data point to a control system maintaining the matrix free Mg2+ concentration rather independently of the expression level of Mrs2p.
Loss of high capacity Mg2+ influx in mrs2 mutant mitochondria
Next we studied whether a disruption of the MRS2 gene (mrs2Δ) affects Mg2+ influx into mitochondria isolated from such mrs2Δ mutant yeast cells. The resting [Mg2+]m of mrs2Δ mitochondria, determined in the nominally Mg2+-free solution, was significantly reduced by 38% compared with wild-type levels (Figure 2). This correlates well with the decreased [Mg2+]t in mrs2Δ mitochondria observed previously (Bui et al., 1999; Gregan et al., 2001).
Most importantly, mrs2Δ mutant mitochondria entirely lacked the rapid, Mg2+-dependent influx (Figure 2A and C). A very slow, retarded component of Mg2+ influx persisted, which after an extended period of time brought [Mg2+]m to a steady-state plateau level ∼35% of the wild-type levels. Δ[Mg2+]m/dt was reduced by a factor of six (from 158 ± 27 µM/s in wild-type to 27 ± 0.5 µM/s) in mrs2Δ mutant mitochondria. In contrast, the influx of Ca2+ into mrs2Δ and wild-type mitochondria was essentially similar (data not shown).
Two closely spaced transmembrane domains in the C-terminal part and a short motif (F/Y-G-M-N) in the sequence connecting them are characteristic of Mrs2p and related proteins CorA and Alr1 (Bui et al., 1999). In the bacterial CorA protein, this motif Y-G-M-N has been shown to be critical for CorA function because even conservative mutations abolished ion fluxes (Szegedy and Maguire, 1999). We have introduced in the MRS2 gene a mutation (mrs2-J1 G998→C998) in Mrs2p that exchanges the glycine residue of this motif by an alanine, and tested its effect on Mg2+ influx in mitochondria of cells expressing the mutant protein from a multicopy vector in an mrs2Δ background. This mutation had no apparent effect on expression and stability of the mutated Mrs2 protein (data not shown). Mg2+ influx into mrs2-J1 mutant mitochondria, however, was strongly reduced (Figure 2C). Being equivalent to the effect of mutations in this motif of the CorA protein, this finding supports the notion that CorA and Mrs2p are functionally related proteins and that the conserved motif F/Y-G-M-N is of critical functional importance.
Reduced mitochondrial Mg2+ concentrations, as found in the mrs2Δ mitochondria, have been reported previously to correlate with an arrest of group II intron RNA splicing (Gregan et al., 2001). As shown in the inset of Figure 2C, mitochondria of mrs2Δ cells expressing the mrs2-J1 mutant protein from a multicopy plasmid accumulate precursor RNA to a similar extent as mitochondria totally lacking Mrs2p (i.e. untransformed mrs2Δ cells). RNA splicing competence thus cannot be restored by expressing the full-length Mrs2 protein with mutation mrs2-J1. The defect in RNA splicing correlates with a lack of Mg2+ influx activity. This is consistent with our previous finding that not the presence of Mrs2 protein per se, but its role in providing mitochondria with standard matrix Mg2+ concentrations is critical for group II intron splicing in vivo (Gregan et al., 2001).
Dependence of Mg2+ fluxes on Δψ
To obtain information on the nature of the driving force for Mg2+ accumulation, we tested the effect of uncouplers, ionophores and agents that block respiration, or inhibit the ATP synthase or the adenine nucleotide translocase on this process. In energized mitochondria, a proton electrochemical potential (ΔµH) is generated by the membrane-bound electron transport chain, which is composed of a membrane potential (Δψ, inside negative) and a concentration gradient (ΔpH, inside alkaline). This proton motive force (PMF) is utilized for ATP synthesis via the F0F1 ATP synthase, but yeast mitochondria can also use ATP to maintain ΔµH, and then the F0F1 ATP synthase, acting in reverse mode, contributes to Δψ by mediating proton efflux, not influx (Iwatsuki et al., 2000).
Mg2+ influx into wild-type mitochondria incubated in ATP-supplemented buffers was not significantly affected by concentrations of antimycin sufficient to inhibit mitochondrial respiration (Figure 3A), or by the protonophore carbonyl cyanide p-trifluromethoxy-phenylhydrazone (FCCP, data not shown). This is consistent with the notion that yeast mitochondria can maintain ΔµH by other activities, e.g. the ATPase activity of the F0F1 synthase (Iwatsuki et al., 2000). Simultaneous inhibition of the respiratory chain complex III and the ATP synthase by use of antimycin plus oligomycin inhibited Mg2+ influx to a significant extent. Moreover, it was nearly abolished when the ADP/ATP translocation and ATP synthase-mediated ATP hydrolysis were inhibited simultaneously by atractyloside and by oligomycin, respectively (Figure 3A). In conclusion, hydrolysis of ATP by the F1F0 ATP synthase working in reverse mode is sufficient to maintain the ΔpH and hence the membrane potential in the absence of respiration.
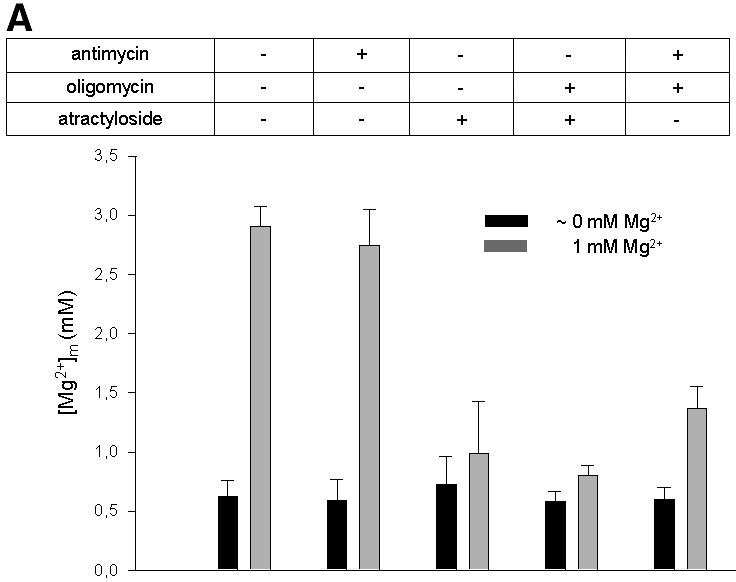
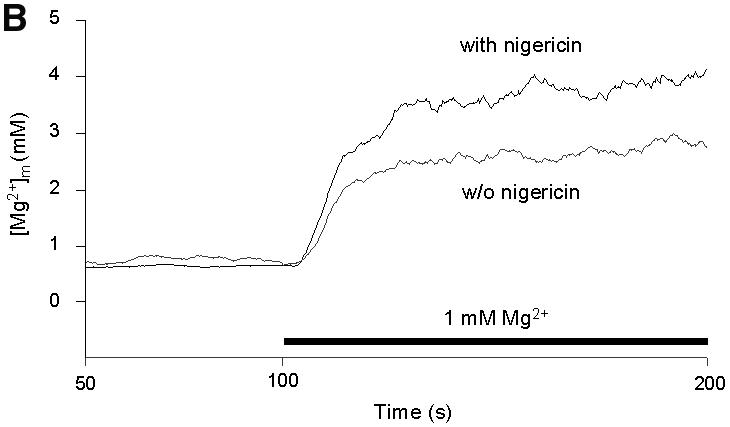
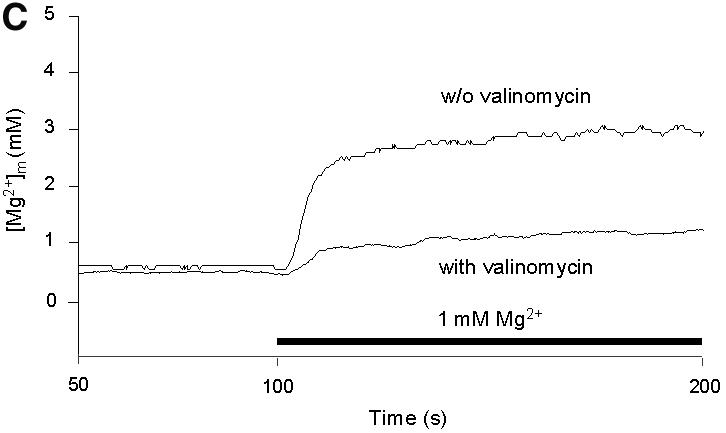
Fig. 3. Effects of inhibitors of mitochondrial functions on Mg2+ influx into wild-type mitochondria. (A) Steady-state [Mg2+]m values measured under various experimental conditions. The resting [Mg2+]m (left bars) was determined in nominally Mg2+-free buffer after pre-incubation of wild-type mitochondria in the presence of the respective compounds as indicated. Afterwards, [Mg2+]e was increased to 1 mM (uptake conditions). The 50 s plateau level of [Mg2+]m after the addition of Mg2+ (right bars) is given. (B) Effect of nigericin. Isolated mitochondria were suspended in SH buffer with or without nigericin; after a 10 min pre-incubation, Mg2+ uptake was induced by increasing [Mg2+]e to 1 mM. (C) Effect of valinomycin. Isolated mitochondria were suspended in KCl buffer with or without valinomycin; after a 30 min pre-incubation, Mg2+ uptake is induced by increasing [Mg2+]e to 1 mM.
Next, we tested the effect of the ionophores nigericin and valinomycin, which are known to affect ΔµH. The H+/K+ ionophore nigericin, which increases the membrane potential Δψ at the expense of ΔpH, increased Mg2+ influx rates and plateau levels considerably (Figure 3B). This points to a dependence of the rapid, high capacity Mg2+ influx on Δψ. It parallels findings of Jung et al. (1997) showing a similar effect on Mg2+ uptake in mammalian mitochondria.
In order to dissipate Δψ, Mg2+ influx was studied in KCl buffer (instead of sorbitol buffer used so far) in the absence or presence of valinomycin, which catalyzes electrophoretic K+ transport (Figure 3C). In the absence of valinomycin, Mg2+ influx rates were essentially similar in KCl buffer and sorbitol buffer. In the presence of valinomycin, Mg2+ influx was drastically reduced (Figure 3C), consistent with the notion that Δψ is the driving force for the major component of the Mg2+ influx system in yeast mitochondria.
The effects of the ionophores on the membrane potential were controlled by laser confocal microscopy of mitochondria stained with the fluorescent dye JC-1 (Reers et al., 1995), which aggregates in a Δψ-dependent manner and thereby changes from green to red fluorescence. As shown in Figure 4, untreated mitochondria exhibited orange to red aggregates. As observed previously (Reers et al., 1995), mitochondria do not stain homogeneously, but JC1 aggregates appear as individual foci within mitochondria, possibly pointing to heterogeneity in membrane potentials within the organelles. In the presence of nigericin, aggregates became more compact and shifted to deep red fluorescence, indicative of hyperpolarization (inside more negative). Upon addition of valinomycin, the stain became diffuse and turned to green, consistent with depolarization (inside less negative) of mitochondrial membranes.

Fig. 4. Effect of nigericin and valinomycin on the transmembrane voltage (Δψ) of wild-type and mrs2Δ mutant mitochondria. For further details, see Results.
Mutant mrs2Δ mitochondria have highly reduced cytochrome contents and hence are respiratory deficient (Wiesenberger et al., 1992). Yet, JC-1 staining of mrs2Δ mutant and wild-type mitochondria was similar, except that the appearance of mutant mitochondria in the absence of ionophores was more heterogeneous, varying between red and pale orange (Figure 4). As shown by JC-1 reaction, the ionophores nigericin and valinomycin induced the same changes in the mitochondrial inner membrane potential regardless of whether wild-type or mrs2Δ mutant mitochondria were used in the experiment. In both cases, application of nigericin led to membrane hyperpolarization and application of valinomycin to membrane depolarization. In conclusion, mrs2Δ mutant mitochondria maintain a high membrane potential in the ATP-containing buffers used here, presumably by the activity of the ATP synthase working in reverse mode. Accordingly, the loss of the rapid increase of [Mg2+]m upon addition of external Mg2+ to mrs2Δ mitochondria does not result from the lack of Δψ as a driving force, but from the absence of the Mrs2p-containing Mg2+ influx system.
When Mg2+-loaded wild-type mitochondria (incubated in [Mg2+]e = 10 mM) were transferred to Mg2+-free incubation buffer, [Mg2+]m stayed constant during 30 min of measurement (data not shown), indicating that Mg2+ efflux from mitochondria was marginal under these experimental conditions. This is consistent with a strong inward-directed driving force for Mg2+, represented by Δψ. A reversal of the electrochemical gradient should then induce Mg2+ efflux. Therefore, Mg2+-loaded wild-type mitochondria (incubation in [Mg2+]e = 10 mM) and mutant mrs2Δ mitochondria (incubation in [Mg2+]e = 10 mM in the presence of ionophore A23187) were washed and transferred in nominally Mg2+-free KCl buffer in the presence of valinomycin sufficient to depolarize them. As shown in Figure 5, [Mg2+]m of wild-type mitochondria decreased by 27% over a time period of 30 min, indicative of a slow Mg2+ efflux from wild-type mitochondria. Co(III)Hex partially inhibited this Mg2+ efflux from mitochondria. These results are consistent with our conclusion of high inward-directed forces in polarized mitochondria, driving Mg2+ influx and preventing its efflux. Mutant mrs2Δ mitochondria did not significantly lower [Mg2+]m under the same conditions, indicating that the observed efflux from depolarized mitochondria involves the presence of the Mrs2 protein (Figure 5).
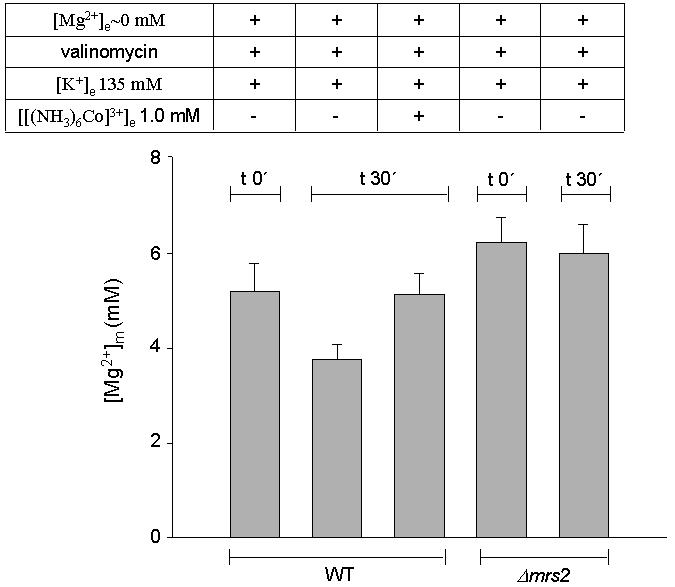
Fig. 5. Mg2+ efflux from Mg2+-loaded isolated wild-type and mrs2Δ mutant mitochondria. Mg2+ efflux was measured as the decrease in the [Mg2+]m of Mg2+-loaded mitochondria resuspended in nominally Mg2+-free, high-K+ buffer. Loading was performed by incubation of mitochondria for 35 min in high-K+ medium containing 10 mM Mg2+ (wild-type mitochondria) or 10 mM Mg2+ and the ionophore A23187 (mrs2Δ mitochondria). By this procedure, steady-state [Mg2+]m levels were raised to 5.1 and 6.2 mM in wild-type and mrs2Δ mutant mitochondria, respectively (t 0′) Mitochondria were than washed twice in high-Mg2+, high-K+ buffer, supplemented with 1.5% albumin to remove the ionophore, and resuspended in a nominally Mg2+-free KCl buffer with additions as given in the table at the top. Steady-state [Mg2+]m after 30 min in the respective solution is shown (t 30′).
Mrs2-containing complexes
The role of Mrs2p in mitochondrial Mg2+ influx as described here as well as that of its homolog CorA in bacterial Mg2+ influx (Smith and Maguire, 1998; Szegedy and Maguire, 1999) suggest that these proteins are constituents of the Mg2+ influx systems and form (or are part of) ion-specific channels. We used in situ protein– protein cross-linking of mitochondrial proteins of cells overexpressing an Mrs2-hemagglutinin (HA) fusion protein, followed by solubilization, SDS–PAGE and immunoblotting to detect Mrs2p-containing products (Figure 6). In the absence of cross-linking agents, the HA antiserum was found to react with a major product representing the Mrs2-HA monomer with an apparent mol. wt of 54 kDa. This size is consistent with the calculated molecular weight of the mitochondrially imported fusion protein Mrs2-HA lacking targeting sequences for its import into the inner mitochondrial membrane (cf. Baumann et al., 2002). Some minor bands of higher electrophoretic mobility were also apparent. They are likely to represent proteolytic degradation products of Mrs2-HA. Upon addition of the cross-linker oPDM (N,N′-1,2-phenylenedimaleimide), additional, higher molecular weight bands became visible, of which a prominent one had an apparent mol. wt of ∼110 kDa, as expected for an Mrs2-HA dimer, and further, less abundant products with estimated molecular weights consistent with tri-, tetra- and pentamers of the Mrs2-HA fusion protein (Figure 6). Additional products of low abundance and various molecular weights may constitute proteolytic degradation products of these complexes. As the control lanes in Figure 6 reveal, none of these bands was visible when proteins of mitochondria lacking an HA tag were immunoblotted, either with or without prior addition of the cross-linking agent. Other cross-linking agents, e.g. DSS (disuccinimidyl suberate), also revealed the presence of Mrs2-HA-containing complexes of high molecular weights up to ∼270 kDa (not shown). Because the Mrs2 protein was only expressed at a high rate from a multicopy plasmid (YEp351), the high molecular weight bands are interpreted to represent oligomers of the Mrs2-HA fusion protein.
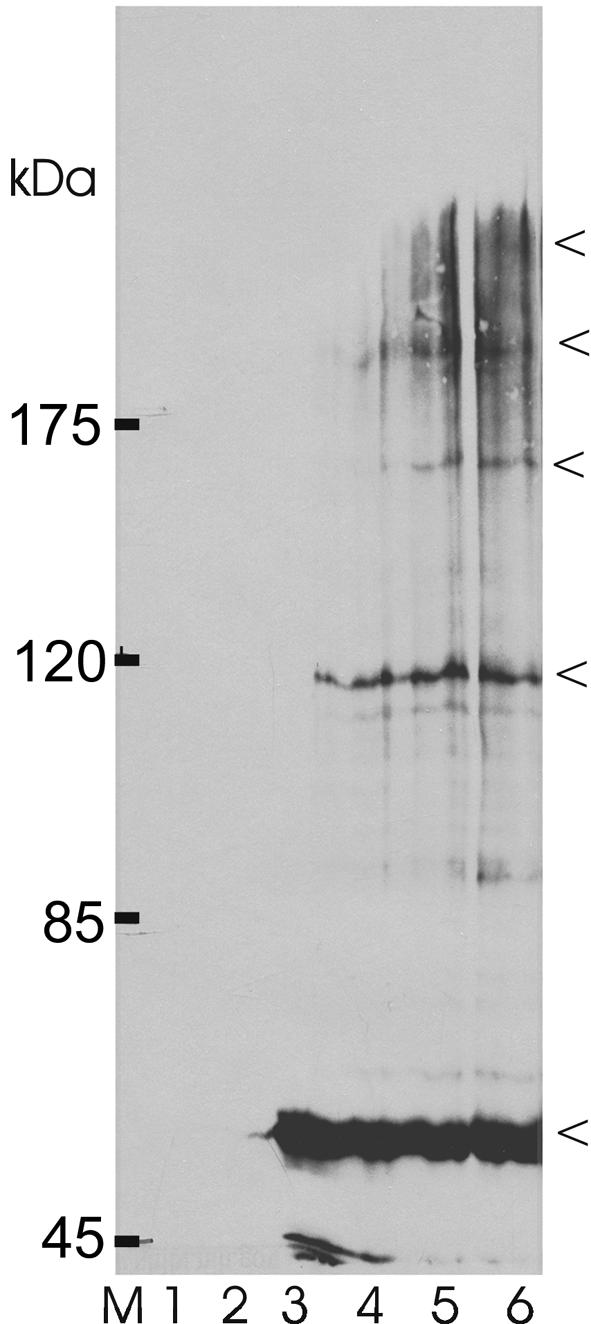
Fig. 6. Mrs2-HA products detected upon chemical cross-linking. Isolated mitochondria of wild-type cells without (lanes 1 and 2) and transformed with YEp351 MRS2-HA (lanes 3–5) were incubated in SH buffer on ice without cross-linker (lanes 1 and 3) or with the chemical cross-linker oPDM (see Materials and methods) at final concentrations of 10 µM (lane 4), 30 µM (lane 5) and 100 µM (lanes 2 and 6), separated by SDS–PAGE and analyzed by immunoblotting with an HA antiserum.
Discussion
The physiology of mitochondrial cation transport has been subject to many studies in the past, but none of the components of these systems could be identified molecularly. While the presence of a specific Mg2+ transporter has been questioned (Jung et al., 1997), a genetic screen has provided us with a first candidate gene for an Mg2+ transport protein in yeast, Mrs2p, which is well conserved among eukaryotes (Bui et al., 1999). Here we provide evidence for its role as an essential constituent of the major mitochondrial Mg2+ channel and characterize the salient features of this high capacity influx system.
Characteristics of the mitochondrial Mg2+ influx
The use of ion-sensitive fluorescent dyes entrapped in cells or organelles allows for continuous recording of changes in free ion concentrations over time, and to determine how they depended on various parameters. It constitutes a valuable alternative to measurements of ion fluxes with isotopes, especially in the case of Mg2+ whose radioisotopes (27Mg2+ and 28Mg2+) are short lived, not always available and difficult to handle. Moreover, the determination of the free ion concentrations rather than total concentrations is of particular relevance when their role in physiological processes is under study.
By using the Mg2+-sensitive fluorescent indicator mag-fura 2, we find the basal [Mg2+]m of yeast mitochondria (0.69 ± 0.05 mM) in nominally Mg2+-free medium to be within the range of 0.5–0.8 mM that has been reported for isolated beef or rat heart mitochondria (Jung et al., 1990, 1997; Rutter et al., 1990). Yeast mitochondria respond to a rise in the [Mg2+]e by a concentration-dependent increase of the free [Mg2+]m which is exceptionally rapid and pronounced, raising [Mg2+]m by as much as 25% within the first second. This process follows saturation kinetics, reaching maximal [Mg2+]m of ∼5 mM with 10 mM Mg2+ in the extramitochondrial solution. Changes in the matrix free Mg2+ concentration are paralleled by an increase in total Mg2+. Because efflux of Mg2+ under our assay conditions is minimal, the rapid change in [Mg2+]m can be assumed to be an estimate of the Mg2+ influx rate. Maximal Δ[Mg2+]m/dt of 150 and 750 µM/s as observed with mitochondria from wild-type and with Mrs2p-overexpressing strains, respectively, and the relative temperature insensitivity of Mg2+ fluxes suggests that these fluxes are mediated by a channel, not by a transporter or pump.
In the absence of the rapid, high capacity Mg2+ influx in mrs2Δ mitochondria, there remains a relatively inefficient system for Mg2+ influx into yeast mitochondria (Δ[Mg2+]m/dt of 27 mM/s). While the molecular nature and characteristics of this system remain obscure, its activity replenishes mitochondrial steady-state Mg2+ pools to about half of the level found in wild-type mitochondria. Apparently, this level is sufficient for survival of mrs2Δ cells, but not for their mitochondrial functions (Wiesenberger et al., 1992; Bui et al., 1999).
As far as the influx of Mg2+ into mammalian mitochondria had been studied by the use of either 28Mg2+ or Mg2+-sensitive fluorescent dyes, the responses of [Mg2+]m to [Mg2+]e were comparatively small and less immediate than seen here (Diwan et al., 1979; Diwan, 1987; Rutter et al., 1990; Jung et al., 1997). Limitations in the determination of ion fluxes and the lack of a specific inhibitor, or of mutants affecting Mg2+ fluxes, previously made it difficult to resolve the question of a specific mitochondrial Mg2+ influx system. There was some indirect evidence for the presence of a specific Mg2+ uptake system in mitochondria (Diwan, 1987). The operation of an uptake pathway for Mg2+ has also been assumed by Rutter et al. (1990), but a specific transport system in mitochondria has been questioned in other studies (Jung et al., 1997). It remains to be shown if the previous work refers to the same, Mrs2p-mediated system as the one studied here in yeast mitochondria.
The driving force for Mg2+ accumulation is the membrane potential (Δψ)
It has been proposed that the driving force for the uptake of mono- or divalent cations into mitochondria is the membrane potential (Δψ), which is about –130 to –160 mV (Rodriguez-Zavala and Moreno-Sanchez, 1998; Iwatsuki et al., 2000). Its maintenance rests on the presence of a proton gradient, which in yeast mitochondria can be derived from electron transport or, if defective, from ATP hydrolysis (Iwatsuki et al., 2000). Data presented here are consistent with the notion that the F1F0 ATP synthase can run in a reverse mode, i.e. hydrolyzing ATP and ejecting H+. When ATP is provided in the incubation buffer, Δψ can be maintained in mutant mrs2Δ mitochondria, although they have reduced cytochrome contents (Wiesenberger et al., 1992). It is also maintained in wild-type mitochondria in the presence of inhibitors of the respiratory chain (antimycin, CN–), and Mg2+ influx is essentially unaffected. However, when the F1F0 ATP synthase is inhibited by oligomycin, or if the ADP/ATP translocase is blocked by atractyloside, Mg2+ influx is strongly reduced.
Incubation of mitochondria with nigericin, which markedly reduces mitochondrial ΔpH by electroneutral exchange of H+ and K+, increased the membrane potential as shown here by measuring Δψ with the fluorescent dye JC-1. As a result, the rate and extent of Mg2+ influx strongly increased, consistent with an increased electrical driving force Δψ for Mg2+ uptake. The essential role of Δψ for Mg2+ influx into mitochondria is supported further by our experiments involving the K+ ionophore valinomycin, which is shown here to dissipate yeast mitochondrial Δψ as well as Mg2+ influx into the organelles in a K+-dependent manner.
In conclusion, our data show that the driving force for Mg2+ uptake is the internally negative potential of the inner mitochondrial membrane, which, under our experimental conditions, is generated mainly by the F1F0 ATP synthase working in reverse mode, hence consuming ATP and pumping protons outward. ATP is not needed directly for Mg2+ uptake, but to establish and maintain the inner membrane potential.
At a transmembrane voltage of –130 to –160 mV (Rodriguez-Zavala and Moreno-Sanchez, 1998; Iwatsuki et al., 2000) and an [Mg2+]e of 10 mM, the driving force for Mg2+ influx (ΔµMg) is extremely strong (–140 to –169 mV), and theoretically would result in [Mg2+]m values of 1450 mM instead of a value of 5 mM observed in yeast mitochondria under our assay conditions (Figure 7). Therefore, it is obvious that Mg2+ does not equilibrate freely across the mitochondrial membrane, indicating a regulation of Mg2+ influx. Essentially similar conclusions have been drawn in previous studies on human mitochondria (Jung et al., 1990, 1997). As an alternative to Mg2+ influx regulation, one might invoke that Mg2+ efflux balances Mg2+ influx. Yet this would imply a high capacity efflux system, capable of compensating for the rapid influx in Mrs2p-overproducing strains. We failed to detect indications of a high capacity efflux system.

Fig. 7. Intramitochondrial free Mg2+ concentrations [Mg2+]m as a function of [Mg2+]e as observed for yeast mitochondria (inverted triangles), and as expected (circles) when Mg2+ would come to an electrochemical equilibrium across the mitochondrial membranes with a membrane potential of 160 mV (inside negative).
Role of Mrs2p in the mitochondrial Mg2+ influx system
As previously reported, steady-state concentrations of total mitochondrial Mg2+ varied moderately with the expression of Mrs2p, indicating that this integral membrane protein is essential for mitochondrial Mg2+ homeostasis. Yet it remained to be shown whether Mrs2p mediates Mg2+ influx or regulates mitochondrial Mg2+ pools (Bui et al., 1999). Results presented here allow us now to reject a possible role for Mrs2p as a mere regulating factor and to conclude that it is a constituent of the Mg2+ flux system itself, most probably forming a homo-oligomeric Mg2+ channel, not a transporter or pump (see above).
A negative, inhibitory role for Mrs2p, keeping [Mg2+]m low in spite of a high driving force for influx, can be excluded because the lack of Mrs2p in mrs2Δ mutant mitochondria would not abolish the rapid Mg2+ influx, but rather increase it. Furthermore, its overexpression might be expected to decrease Mg2+ influx. A positive regulatory role for Mrs2p, stimulating the activity of the Mg2+ influx system, might be compatible with the strong increase in Mg2+ influx rates when overexpressed, but not with its small effects on saturating [Mg2+]m plateau levels. Moreover, in its absence (mrs2Δ or mrs2-J1 mutants), the ‘true’ Mg2+ channel would be expected to retain basic activities responding to changes in [Mg2+]e. This seems not to be the case; mrs2Δ and mrs2-J1 mutant mitochondria show as little response as wild-type mitochondria in the presence of Co(III)Hex.
The assumption of Mrs2p being an essential, probably the only constituent of an Mg2+ channel is compatible with all available results. Mg2+ influx as well as efflux are abolished when Mrs2p is absent (mrs2Δ mutant) or mutated in the conserved F/Y-M-N-G motif (mrs2-J1 mutant). Expression of the MRS2 gene from a multicopy vector provides mitochondria with a largely increased amount of Mrs2 protein (Gregan et al., 2001), resulting in a higher influx capacity than in wild-type mitochondria, without over-ruling the steady-state [Mg2+]m control system. This is most compatible with Mrs2p constituting a channel (as discussed above, a transporter or pump seems to be ruled out).
Support for a role for Mrs2p in forming a Mg2+ channel, and not of a regulatory factor of a channel, comes from previous findings that distantly related homologs such as araMrs2p, hsMrs2p or CorA can substitute for yeast Mrs2p (Bui et al., 1999; Schock et al., 2000; Zsurka et al., 2001). Having 30% (araMrs2p, hsMrs2p) or much less (CorA) sequence identity with yeast Mrs2p, or with each other, these homologs are unlikely to interact as regulatory factors with the same Mg2+ influx system when heterologously expressed in yeast. On the contrary, the functional replacement of Mrs2p by distantly related Mrs2 or CorA proteins is easily explained by the assumption that each of these different homologs assembles in the yeast mitochondrial membrane to form a channel of its own. Given that Mrs2p has only two predicted transmembrane domains, several units of this protein may form a homo-oligomeric channel.
In fact, protein–protein cross-linking experiments performed here revealed the presence of complexes up to apparent sizes five times the molecular weight of Mrs2p. The fact that only this protein had been overexpressed suggests the presence of homo-oligomeric Mrs2p complexes. CorA in bacteria has also been reported to form such complexes (Smith and Maguire, 1998; M.E.Maguire, personal communication). Finally, results from mutational studies on CorA strongly favor its role as a channel protein (Szegedy and Maguire, 1999), and the electrophysiology of Alr1p, the third representative of this highly diverged protein family, suggests that it forms an Mg2+-selective channel in the yeast plasma membrane (Liu et al., 2002).
In conclusion, mitochondria contain a rapid, high capacity Mg2+ influx system, which is driven mainly by the membrane potential. Mrs2p, an integral protein of the inner mitochondrial membrane, appears to be the only essential constituent of this system, forming a homo-oligomeric Mg2+ channel. Available data on its homologs Alr1p in the plasma membrane of lower eukaryotes and CorA in bacterial membranes are consistent with a similar structural and functional role for all members of this highly varied protein family.
Materials and methods
Yeast strains, growth media and genetic procedures
Origins of the yeast Saccharomyces cerevisiae DBY747 wild-type strain and the isogenic mrs2Δ deletion strain (DBY mrs2-1) have been described previously (Wiesenberger et al., 1992; Bui et al., 1999). Yeast cells were grown in rich medium (YPD) with 2% glucose as a carbon source to early stationary phase (OD600 of 1.8).
Plasmid constructs
The MRS2 gene was amplified by use of the following primer sequences (with introduced restriction site in italics): forward primer with BamHI restriction site 5′-AAAGGATCCAAGCATCTCATGAATCGG-3′; reverse primer with PstI restriction site 5′-TTTCTGCAGCCTTTCAAT TTTTCTTGTC-3′. In order to introduce a substitution at position 998 (G to C), which leads to substitution of Gly333 to alanine of the MRS2 gene product, by use of the overlap extension PCR according to Pogulis et al. (1996), the mutagenic forward primer 5′-GCATTCTATGCTATGAA TTTA-3′ (mismatched bases in bold) and the mutagenic reverse primer 5′-TTAATTCATAGCATAGAATGC-3′ were used in combination with the primers given above. Wild-type and mutated fragments amplified by Expand High Fidelity PCR system (Roche) were cloned into plasmid pVT-U 103 (Vernet et al., 1987) linearized by BamHI and PstI restriction enzymes. The introduced mutation, referred to as mrs2-J1, was verified by detection of the newly created MwoI restriction site. No additional mutations were found by sequencing.
Isolation of mitochondria
Cells were harvested, resuspended in Tris-SO4 pH 9.4 + 10 mM DTT (dithiothreitol) buffer and incubated for 15 min at 37°C with moderate shaking (160 r.p.m.). Cells were washed with sorbitol buffer (1.2 M sorbitol; 20 mM KPi pH 7.4) and resuspended in the sorbitol buffer containing lyticase (200 U/ml). Spheroplasts, obtained after 1 h incubation at 28°C with moderate shaking, were washed in cold sorbitol buffer, resuspended in the cold SH buffer (0.6 M sorbitol, 20 mM HEPES–KOH pH 7.4) or KCl buffer (150 mM KCl, 300 mM sucrose, 20 mM HEPES–KOH pH 7.4) and homogenized in a Dounce homogenizer on ice.
Supernatants obtained after low speed centrifugation (3500 r.p.m.) were centrifuged at 8500 r.p.m., and pelleted mitochondria were resuspended in SH buffer or KCl buffer supplemented with 0.5 mM ATP, 0.2% succinate and 0.01% pyruvate.
Measurement of [Mg2+]m and [Ca2+]m by spectrofluorometry
The AM forms of mag-fura 2 and of fura 2, as well as Pluronic F-127 were purchased from Molecular Probes Inc. (Eugene, OR). Stocks of mag-fura 2-AM (0.5 mM) and fura 2-AM (0.5 mM) were prepared in dimethylsulfoxide (DMSO) and used at a final concentration of 5 and 10 µM, respectively.
Mitochondria were loaded with either mag-fura 2 or fura 2 for the determination of the free intramitochondrial Mg2+ and Ca2+ concentration, [Mg2+]m and [Ca2+]m, respectively. Loading was performed by incubating mitochondria (0.5 mg/ml) in SH buffer with either 5 µM mag-fura 2-AM or 10 µM fura 2-AM, and 5 µl Pluronic F-127 for 35 min at 25°C. Mitochondria subsequently were washed twice in SH buffer to remove excess dye. Afterwards, the mitochondria were incubated for a further 35 min to allow for complete hydrolysis of the dyes, and washed twice before measurement of fluorescence.
Ion concentrations were determined by measuring the fluorescence of the probe-loaded mitochondria in the spectrofluorometer LS-55 (Perkin-Elmer) by using the fast filter accessory (FFA), which allowed fluorescence to be measured at 20 ms intervals with excitation for mag-fura 2 and fura 2 at 340 and 380 nm, and emission at 509 nm. All measurements were made at 25°C in 3 ml cuvettes containing 2 ml of mitochondrial suspension (0.5 mg protein/ml) with stirring of the suspensions.
To analyze [Mg2+]e-dependent changes in [Mg2+]m, external [Mg2+] was increased successively to final concentrations of 1, 5, 10 or 20 mM.
Valinomycin (30 min, 5 µM) nigericin (10 min, 2.5 µM), antimycin A (30 min, 5 µg/ml) or oligomycin (30 min, 5 µg/ml) (all from Sigma) were added to mitochondrial suspensions before the addition of Mg2+ at the times and final concentrations given in parnetheses. Co(III)Hex (Aldrich Chemicals) was added 10 min prior to the addition of Mg2+ at the concentrations given in the text.
Continuous recordings of fluorescent intensities at 340 and 380 nm were transformed into 340/380 wavelength ratios by use of the computer program FL WinLab version 3.0 or 4.0 (Perkin-Elmer), and [Mg2+]m values were calculated from the 340/380 nm ratio according to the formula of Grynkiewicz et al. (1985) with a dissociation constant of the mag-fura-2 –Mg2+ complex of 1.52 in SH buffer and 1.89 in KCl buffer. The minimum (Rmin) and maximum (Rmax) ratios were determined at the end of each experiment. Rmax for mag-fura 2 was obtained by the addition of SDS (10% w/v) to lyse mitochondria and 25 mM MgCl2. Rmin was detected by addition of 50 mM EDTA pH 8, to remove all Mg2+ from the solution.
Determination of ion concentrations by atomic absorption spectroscopy
Isolated, mag-fura 2-loaded mitochondria were incubated for 1 min in SH buffer supplemented with 1, 5 or 10 mM MgCl2, and washed three times with cold SH buffer. To decompose the samples, HNO3 was added to a final concentration of 32.5% and heated for 4 h at 150°C. Ca2+, Mg2+ and K+ concentrations were determined with a Perkin-Elmer Model 1100 B atomic absorption spectrophotometer.
Staining of mitochondria with JC-1
JC-1 (Molecular Probes) was added to mitochondrial suspensions in SH or KCl buffer at a final concentration of 15 µM and incubated for 10 min at room temperature before microscopic examination using a Leica TCS4D laser confocal microscope.
Chemical cross-linking
Mitochondria were isolated by differential centrifugation from an mrs2Δ yeast strain expressing an Mrs2-HA construct from a multicopy vector (Bui et al., 1999). oPDM (Aldrich Chem. Co.) was added to mitochondrial preparations (50 µg in 20 µl of SH buffer) to final concentrations of 10, 30 and 100 µM and kept on ice for 60 min. SDS loading buffer containing β-mercaptoethanol was added and samples were heated to 80°C for 4 min before loading on SDS–polyacrylamide gels. Mrs2-HA protein-containing bands were visualized by use of an anti-HA serum.
RNA splicing assays
RT–PCR assays with three primers, detecting exon–exon B1–B2 junctions and exon–intron B1–bI1 junctions of mitochondrial cytochrome b RNA, were performed on RNA preparations obtained from isolated mitochondria as described previously (Gregan et al., 2001).
Statistical analysis
If not otherwise stated, data are presented as means ± SE. Significance was determined by Student’s t-test or Tukey’s analysis of variance as appropriate. P < 0.05 was considered to be significant. All statistical calculations were performed by using SigmaStat (Jandel Scientific).
Acknowledgments
Acknowledgements
We are grateful to Professor I.Lichtscheidl (Vienna) for use of the confocal microscope, Dr Zemberyova (Bratislava) for atomic absorption spectroscopy, Hi Sung Park (Berlin) and E.Froschauer (Vienna) for their help in ion flux measurements. K.Wolf (Berlin) for competent technical support, and Drs G.Wiesenberger and Jochen Stadler for helpful suggestions for this work and valuable comments on the manuscript. This work was supported by grants to R.S. by the Austrian Science Fund and the Austrian Ministry of Science BM-BWK.
References
- Baumann F., Neupert,W. and Herrmann,J.M. (2002) Insertion of bitopic membrane proteins into the inner membrane of mitochondria involves an export step from the matrix. J. Biol. Chem., 277, 21405–21413. [DOI] [PubMed] [Google Scholar]
- Bui D.M., Gregan,J., Jarosch,E., Ragnini,A. and Schweyen,R.J. (1999) The bacterial Mg2+ transporter CorA can functionally substitute for its putative homologue Mrs2p in the yeast inner mitochondrial membrane. J. Biol. Chem., 274, 20438–20443. [DOI] [PubMed] [Google Scholar]
- Diwan J.J. (1987) Mitochondrial transport of K+ and Mg2+. Biochim. Biophys. Acta, 895, 155–165. [DOI] [PubMed] [Google Scholar]
- Diwan J.J., Daze,M., Richardson,R. and Aronson,D. (1979) Kinetics of Mg2+ flux into rat liver mitochondria. Biochemistry, 18, 2590–2595. [DOI] [PubMed] [Google Scholar]
- Graschopf A., Stadler,J.A., Hoellerer,M.K., Eder,S., Sieghardt.M., Kohlwein,S.D. and Schweyen R.J. (2001) The yeast plasma membrane protein Alr1 controls Mg2+ homeostasis and is subject to Mg2+-dependent control of its synthesis and degradation. J. Biol. Chem., 276, 16216–16222. [DOI] [PubMed] [Google Scholar]
- Gregan J., Kolisek,M. and Schweyen,R.J. (2001) Mitochondrial magnesium homeostasis is critical for group II intron splicing in vivo. Genes Dev., 15, 2229–2237. [DOI] [PMC free article] [PubMed] [Google Scholar]
- Grynkiewicz G., Poenie,M. and Tsien,R.Y. (1985) A new generation of Ca2+ indicators with greatly improved fluorescence properties. J. Biol. Chem., 260, 3440–3450. [PubMed] [Google Scholar]
- Iwatsuki H., Lu,Y.M., Yamaguchi,K., Ichikawa,N. and Hashimoto,T. (2000) Binding of an intrinsic ATPase inhibitor to the F(1)F0ATPase in phosphorylating conditions of yeast mitochondria. J. Biochem., 128, 553–559. [DOI] [PubMed] [Google Scholar]
- Jung D.W., Apel,L. and Brierley,G.P. (1990) Matrix free Mg2+ changes with metabolic state in isolated heart mitochondria. Biochemistry, 29, 4121–4128. [DOI] [PubMed] [Google Scholar]
- Jung D.W., Chapman,C.J., Baysal,K., Pfeiffer,D.R. and Brierley,G.P. (1997) On the use of fluorescent probes to estimate free Mg2+ in the matrix of heart mitochondria. Arch. Biochem. Biophys., 332, 19–29. [DOI] [PubMed] [Google Scholar]
- Kucharski L.M., Lubbe,W.J. and Maguire,M.E. (2000) Cation hexaammines are selective and potent inhibitors of the CorA magnesium transport system. J. Biol. Chem., 275, 16767–16773. [DOI] [PubMed] [Google Scholar]
- Liu G.J., Martin,D.K., Gardner,R.C., Ryan,P.R. (2002) Large Mg2+-dependent currents are associated with the increased expression of ALR1 in Saccharomyces cerevisiae. FEMS Microbiol. Lett., 213, 231–237 [DOI] [PubMed] [Google Scholar]
- MacDiarmid C.W. and Gardner,R.C. (1998) Overexpression of the Saccharomyces cerevisiae magnesium transport system confers resistance to aluminum ion. J. Biol. Chem., 273, 1727–1732. [DOI] [PubMed] [Google Scholar]
- Pogulis R.J., Vallejo,A.N. and Pease,L.R. (1996) In vitro recombination and mutagenesis by overlap extension PCR. Methods Mol. Biol., 57, 167–176. [DOI] [PubMed] [Google Scholar]
- Raju B., Murphy,E., Levy,L.A., Hall,R.D. and London,R.E. (1989) A fluorescent indicator for measuring cytosolic free magnesium. Am. J. Physiol., 256, C540–C548. [DOI] [PubMed] [Google Scholar]
- Reers M., Smiley,S.T., Mottola-Hartshorn,C., Chen,A., Lin,M. and Chen,L.B. (1995) Mitochondrial membrane potential monitored by JC-1. Methods Enzymol., 260, 406–448. [DOI] [PubMed] [Google Scholar]
- Rodriguez-Zavala J.S. and Moreno-Sanchez,R. (1998) Modulation of oxidative phosphorylation by Mg2+ in rat heart mitochondria. J. Biol. Chem., 273, 7850–7855. [DOI] [PubMed] [Google Scholar]
- Romani A.M. and Scarpa,A. (2000) Regulation of cellular magnesium. Front. Biosci., 5, D720–D734. [DOI] [PubMed] [Google Scholar]
- Romani A., Dowell,E. and Scarpa,A. (1991) Cyclic AMP-induced Mg2+ release from rat liver hepatocytes, permeabilized hepatocytes and isolated mitochondria. J. Biol. Chem., 266, 24376–24384. [PubMed] [Google Scholar]
- Rutter G.A., Osbaldeston,N.J., McCormack,J.K.G. and Denton,R.M. (1990) Measurement of free Mg2+ concentration in rat heart mitochondria by using entrapped fluorescent probes. Biochem. J., 271, 627–634. [DOI] [PMC free article] [PubMed] [Google Scholar]
- Schock I., Gregan,J., Steinhauser,S., Schweyen,R.J., Brennicke,A. and Knoop,V. (2000) A member of a novel Arabidopsis thaliana gene family of candidate Mg2+ ion transporters complements a yeast mitochondrial group II intron splicing mutant. Plant J., 24, 489–501. [DOI] [PubMed] [Google Scholar]
- Schweigel M., Vormann,J. and Martens,H. (2000) Mechanisms of Mg2+ transport in cultured ruminal epithelial cells. Am. J. Physiol. Gastrointest. Liver Physiol., 278, G400–G408. [DOI] [PubMed] [Google Scholar]
- Smith R.L. and Maguire,M.E. (1998) Microbial magnesium transport: unusual transporters searching for identity. Mol. Microbiol., 28, 217–226. [DOI] [PubMed] [Google Scholar]
- Szegedy M.A. and Maguire,M.E. (1999) The CorA Mg2+ transport protein of Salmonella typhimurium. Mutagenesis of conserved residues in the second membrane domain. J. Biol. Chem., 274, 36973–36979. [DOI] [PubMed] [Google Scholar]
- Vernet T., Dignard,D. and Thomas,D.Y. (1987) A family of yeast expression vectors containing the phage f1 intergenic region. Gene, 52, 225–233. [DOI] [PubMed] [Google Scholar]
- Wiesenberger G., Waldherr,M. and Schweyen,R.J. (1992) The nuclear gene MRS2 is essential for the excision of group II introns from yeast mitochondrial transcripts in vivo. J. Biol. Chem., 267, 6963–6969. [PubMed] [Google Scholar]
- Zsurka G., Gregan,J. and Schweyen,R.J. (2001) The human mitochondrial Mrs2 protein functionally substitutes for its yeast homologue; a candidate magnesium transporter. Genomics, 72, 158–168. [DOI] [PubMed] [Google Scholar]