Abstract
The junction-resolving enzyme endonuclease I is selective for the structure of the DNA four-way (Holliday) junction. The enzyme binds to a four-way junction in two possible orientations, with a 4:1 ratio, opening the DNA structure at the centre and changing the global structure into a 90° cross of approximately coaxial helices. The nuclease cleaves the continuous strands of the junction in each orientation. Binding leads to pronounced regions of protection of the DNA against hydroxyl radical attack. Using all this information together with the known structure of the enzyme and the structure of the BglI–DNA complex, we have constructed a model of the complex of endonuclease I and a DNA junction. This shows how the enzyme is selective for the structure of a four-way junction, such that both continuous strands can be accommodated into the two active sites so that a productive resolution event is possible.
Keywords: DNA repair/Holliday junction/nucleases/recombination
Introduction
Homologous genetic recombination is important in DNA repair, resolving stalled replication forks and the creation of genetic diversity (reviewed in Lilley and White, 2001). The four-way (Holliday) DNA junction is the central intermediate in this process, that is the substrate for the junction-resolving enzymes. These are basic, dimeric nucleases that are selective for the structure of the four-way junction, that cleave two strands to convert the branch point into nicked duplex species. They have been found in a wide variety of organisms, from bacteriophage-infected Escherichia coli to mammals and their viruses, as reviewed in Lilley and White (2001).
The junction-resolving enzymes typically bind to four-way junctions with nanomolar affinity, binding ∼1000-fold more tightly to the junction compared with duplex DNA of the same sequence. They thus exhibit marked structural selectivity, and could be regarded as paradigms for molecular recognition of DNA structure. Selectivity for DNA structure is of general importance in a wide variety of DNA repair events, as well as both site-specific and homologous recombination processes. Yet, despite its significance, the molecular basis of structural selectivity is poorly understood at present. In the case of the junction-resolving enzymes, this is complicated by the distortion of DNA structure that usually accompanies the binding of the enzymes to DNA junctions (Bennett and West, 1995; Duckett et al., 1995a; Pöhler et al., 1996; White and Lilley, 1997, 1998; Giraud-Panis and Lilley, 1998; Déclais and Lilley, 2000; Fogg et al., 2001). There is evidence that this is functionally important in ensuring productive resolution of the junction (Fogg and Lilley, 2000; Fogg et al., 2000).
The molecular structures of a number of junction-resolving enzymes have now been solved by X-ray crystallography (Ariyoshi et al., 1994; Raaijmakers et al., 1999; Bond et al., 2001; Ceschini et al., 2001; Hadden et al., 2001; Nishino et al., 2001). These proteins are very basic (typically pI >8.5), and they display large areas of electropositive surface that are suitable for large-scale DNA contact. However, none of the enzymes has been crystallized in the presence of its DNA junction substrate, and so the details of the molecular interaction are still unclear. Endonuclease I is a member of the nuclease superfamily of enzymes (Lilley and White, 2000), and the active site is closely similar to those of a number of restriction enzymes such as BglI. We have presented the structure of endonuclease I of phage T7 in both mutant (Hadden et al., 2001) and wild-type (Hadden et al., 2002) forms. The dimeric protein comprises two well-separated domains composed of elements from both polypeptides, connected by an extended β-bridge. We have identified the active sites of the enzyme (Déclais et al., 2001); these are separated by nearly 40 Å, and are oriented in opposite directions.
In the present work, we have analysed the manner of the interaction between endonuclease I and the four-way junction, including the global and local distortion imposed on the DNA by the enzyme and analysis of the DNA–protein contacts by footprinting. Coupled with the close similarity to the BglI structure at the active site (Newman et al., 1998), this has enabled us to make a detailed model of the structure of the enzyme–junction complex that is in good agreement with available data. This brings us significantly closer to understanding the recognition processes involved in selectively binding the four-way junction.
Results
Analysis of the cleavage of the four strands of a junction by T7 endonuclease I
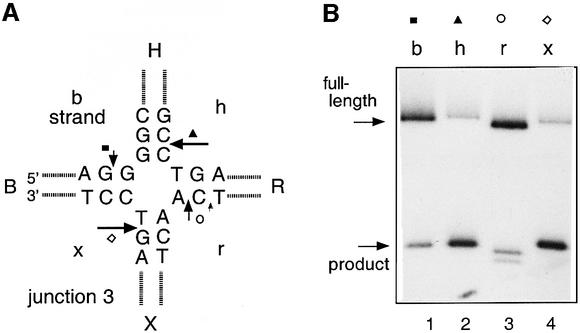
Junction 3 (Duckett et al., 1988) (Figure 1A) is one of the best structurally characterized four-way DNA junctions that has been used extensively for studies of interactions with resolving enzymes. In free solution, the junction forms the stacked X-structure in the presence of divalent metal ions, where the conformation is heavily biased to the conformer based on coaxial stacking of helices B on X and H on R (Duckett et al., 1988; Clegg et al., 1992).
Fig. 1. Cleavage of a four-way DNA junction by endonuclease I. (A) The central sequence of junction 3 (Duckett et al., 1988) used for this analysis. The structural characteristics of this junction have been investigated extensively. For the analysis of cleavage, a version of this junction with arms of 15 bp was employed. The positions of cleavage (arrowed) have been deduced from electrophoresis on sequencing gels (e.g. Figure 3) and mass spectrometry (data not shown). (B) Junction 3 radioactively 5′-32P-labelled in a given strand was incubated with endonuclease I for 10 s at 20°C, and the substrate and products separated by electrophoresis in a 15% sequencing gel. The products were visualized by autoradiography. Tracks 1–4 contain DNA labelled on the b, h, r and x strands, respectively, after cleavage with endonuclease I. (C) Kinetics of cleavage of the different strands of junction 3. Plot of the fraction of cleavage (means of triplicate measurements; error bars are standard errors) for the individual strands as a function of time at 20°C. The data have been fitted to Equation 2 from which the rate constants have been calculated. Cleavage of b strand (filled squares), h strand (filled triangles), r strand (open circles) and x strand (open diamond).
We incubated junctions (20 nM) selectively 5′-32P-labelled on a single strand with endonuclease I of phage T7 (40 nM), and the substrate and product were separated by sequencing gel electrophoresis and phosphoimaging (Figure 1B). All four strands are cleaved, to the extents given by h = x > b = r. Thus the enzyme appears to cleave more efficiently on the h/x diagonal. The r strand has been cleaved one nucleotide to the 5′ side of the main cleavage site, indicating a degree of flexibility in how the phosphate groups of the junction are accommodated into the active site.
This was analysed in more detail by measuring the rates and extent of cleavage of the individual strands. Endonuclease I cleaves four-way junctions too quickly for manual sampling (Déclais et al., 2001). We therefore used a quenched-flow mixer to start the reaction and terminate it in a range of 50 ms to 5 s. The products were analysed by electrophoresis and phosphoimaging. All four strands are cleaved at similar rates, consistent with the low sequence dependence of endonuclease I (Figure 1C). Fitting to single exponentials gave rates in the range of 1.6–2.5/s. The fits could be improved using two exponential functions, whereupon the faster rates for each strand are in the range 3.5–5.8/s. Although all four strands are cleaved at similar rates, the extent of cleavage is clearly not the same in each case. Strands h and x are cleaved to a plateau level of 70%, while strands b and r are only cleaved to 15%. These data suggest the existence of two populations of enzyme–junction complexes, producing either h + x or b + r cleavage, with a population ratio of ∼4:1.
The global structure of a DNA junction bound to T7 endonuclease I
We have shown previously that the stacked X-structure of the free DNA junction becomes distorted upon the binding of endonuclease I (Duckett et al., 1995a). We have analysed this in greater depth using comparative gel electrophoresis (Gough and Lilley, 1985; Cooper and Hagerman, 1987; Duckett et al., 1988). In this approach, we compare the electrophoretic mobility of the six possible species generated from a four-way junction, having two long (60 bp) and two short (15 bp) helical arms (Lilley, 2000). The relative mobilities should be proportional to the angle included between the two longer arms. In addition to free DNA and RNA (Duckett et al., 1995b) junctions, we have also applied this method to the analysis of the global structures of protein–junction complexes (Duckett et al., 1995a; Pöhler et al., 1996; White and Lilley, 1997; Giraud-Panis and Lilley, 1998). The greater length of the arms used in the present study provides better resolution of the junction–protein complexes, and allows us to determine the global structure for the first time.
We incubated the individual six long–short arm junction 3 species and endonuclease I under conditions that predominantly generate a complex containing a single dimer of the resolving enzyme. The complexes were applied to a non-denaturing polyacrylamide gel in adjacent tracks, along with a second set of the junctions with no protein added. The radioactive junction species were visualized by autoradiography of the dried gel.
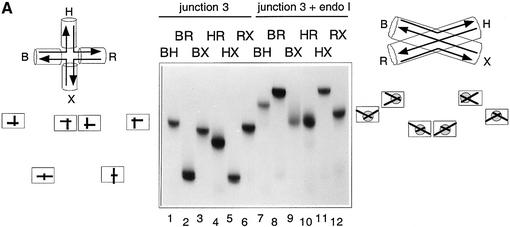
Figure 2A shows the results in a buffer containing 1 mM EDTA and no added metal ions. Under these conditions, the free junction displays the expected slow–fast–slow– slow–fast–slow pattern indicative of an unstacked structure where the arms are directed towards the corners of a square. The pattern of the enzyme–junction complexes is quite different, confirming the distortion of the DNA on binding the protein. It can be described as intermediate– slow–fast–fast–slow–intermediate, indicating that adjacent arms of the junction are approximately coaxial (in contrast to the free junction), but with a parallel-stranded conformation. This interpretation is shown graphically in Figure 2A. An alternative interpretation based on dynamic exchange is presented in the Discussion.
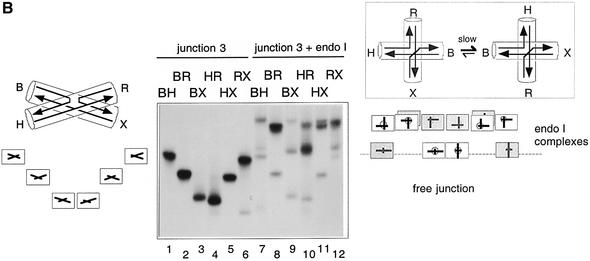
Fig. 2. The global structure of the DNA junction complexed with endonuclease I analysed by comparative gel electrophoresis. Junction 3 was assembled in the six possible species with two long and two short arms. These were each incubated with endonuclease I, and analysed by electrophoresis in polyacrylamide. The arms of the junction are named in the same manner as previously (Figure 1); the long–short arm species are named according to the long arms, e.g. the BH species has long B and H arms, and short R and X arms. Parallel experiments were performed in which the electrophoretic mobility of the six species were examined in the absence of protein. (A) Analysis of the structure in the presence of EDTA. Under these conditions, the free junction (tracks 1–6) adopts the open-square conformation, giving rise to four slow species, with long arms subtending 90°, and two fast species where the long arms are co-linear. The interpretation of the pattern of mobilities is shown on the left. The endonuclease I–junction complexes (tracks 7–12) migrate as a series of discrete species, retarded with respect to the free junction. An interpretation of this pattern (see text for details) is given on the right. (B) Analysis of the structure in the presence of Ca2+. The free junction (tracks 1–6) adopts the stacked X-structure (shown left) based on B on X stacking, giving the slow–intermediate–fast–fast–intermediate–slow pattern of mobilities, interpreted on the left. This pattern can also be seen weakly in the species incubated with endonuclease I (tracks 7–12), indicating incomplete complex formation. The retarded species are complexes of the junction with endonuclease I, and are interpreted in terms of a slow exchange between two stacked forms indicated on the right (major form black, minor form grey). Each of these is based on a 90° cross, with different choices of stacking partners. This generates the pattern shown on the right as two superimposed sets of species.
The electrophoresis was repeated in a buffer containing 200 µM Ca2+ (Figure 2B). This ion was chosen as it folds DNA junctions normally, but endonuclease I is totally inactive in Ca2+. As before, protein-free junctions were analysed in the same gel; under these conditions, they generate the slow–intermediate–fast–fast–intermediate– slow pattern indicating the formation of the stacked X-structure in the B on X stacking conformer. The electrophoretic pattern of the endonuclease I complexes is rather more complicated than that in EDTA, and requires some interpretation. First, there are a set of relatively fast species of low intensity that clearly correspond to a small fraction of unbound DNA junction, and can be ignored in the following discussion. This leaves the set of species migrating more slowly, where most tracks contain two bands. The most consistent interpretation of this pattern of bands suggests that there are two kinds of equivalent junction–enzyme complex present in the solution, that exchange slowly relative to the electrophoresis process. Both can be considered as having pairwise coaxial alignment of arms, to a first approximation, with axes at 90° to each other. However, they differ in their apparent stacking partners. Moreover, the two types of complex are not equally populated. The major species is based on B on X, H on R stacking, while the minor species is formed by B on H, X on R stacking. This interpretation of the pattern is illustrated graphically in Figure 2B.
Assignment of strand cleavages in the two complexes formed in the presence of divalent metal ions
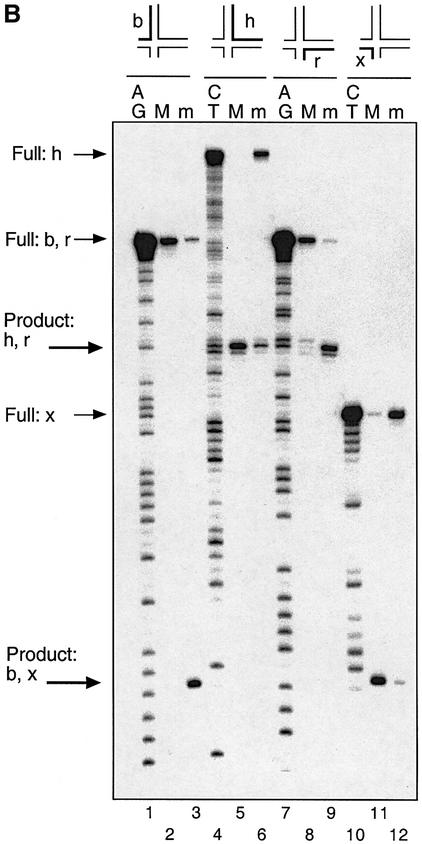
The existence of two forms of the complex in the presence of divalent metal ions is clearly consistent with the two classes of strand cleavage observed. To explore this rigorously, we devised a method allowing us to separate the two complexes by means of the long–short species above, and analyse which strands were cleaved in each. We bound endonuclease I to a junction with long H and R arms (Figure 3A); four forms, individually radioactively 5′32P-labelled on a single strand, were used. In each case, the major and minor complexes separated by gel electrophoresis in the presence of Ca2+ ions (just as in Figure 2B). Gel slices containing the complexes were excised, and incubated in the presence of Mg2+ ions to activate the endonuclease I. The DNA was then recovered by electroelution and analysed by sequencing gel electrophoresis (Figure 3B). It is apparent that the major complex is cleaved on the h and x strands, while the minor complex is cleaved on the b and r strands, as expected. A small amount of cleavage on the h and x strands in the minor complex is probably caused by the activity of endonuclease I cleaving opposite nicks in the resolved duplexes. With more extended incubation, it is possible to obtain 100% cleavage of a given strand in a specific complex, in contrast to the experiments with unseparated complexes.
Fig. 3. Identification of the strands cleaved in the two complexes formed in the presence of divalent metal ions. (A) Scheme showing the principle of the experiment. Endonuclease I is bound to a form of junction 3 with long H and R arms (in four versions, separately radioactively 5′-32P labelled on a single strand), and the two complexes separated by gel electrophoresis in the presence of Ca2+ ions (equivalent to Figure 2B, track 10). The two complexes for each junction are removed by slicing the gel, and the enzyme activated by addition of Mg2+ ions. The DNA is then recovered from the gel slices by electroelution, and analysed by sequencing gel electrophoresis. (B) Auto radiograph showing the analysis of strand cleavage in the two complexes. For each differently labelled junction, three tracks are shown containing a purine- (tracks 1 and 7) or pyrimidine-specific (tracks 4 and 10) sequence marker, the major (tracks 2, 5, 8 and 11) and minor (tracks 3, 6, 9 and 12) complexes for the junctions labelled on the b (tracks 1–3), h (tracks 4–6), r (tracks 7–9) and x (tracks 10–12) strands. The positions of the various full-length and product species are arrowed left.
Local distortion of DNA structure induced by the binding of endonuclease I
The electrophoretic analysis shows that the global structure of the four-way junction is distorted by the binding of endonuclease I. In principle, the electrophoretic patterns observed are consistent with structures in which there is complete coaxial stacking of helical arms. However, other resolving enzymes such as Cce1 significantly disrupt helical stacking (White and Lilley, 1997) and even local base pairing (Déclais and Lilley, 2000) on binding to DNA junctions. We have therefore used two approaches to examine the local DNA structure at the junction centre.
Endonuclease I binding results in increased fluorescence intensity of 2-aminopurine at the centre of the junction
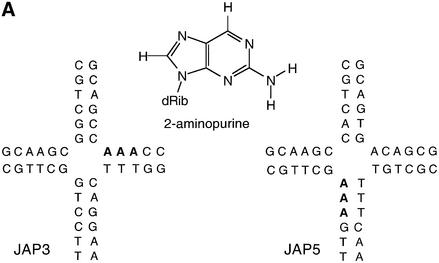
2-aminopurine (2-AP) is a fluorescent structural isomer of adenine (Figure 4A), that can form an alternative base pair with thymine that is closely similar to the normal A–T pair in both structure and energy (Law et al., 1996). The introduction of 2-AP therefore causes minimal structural distortion. The fluorescence of the 2-AP base is strongly quenched by stacking on either side, and thus the fluorescence intensity provides valuable information on the local environment of the base (Ward et al., 1969; Xu et al., 1994; Stivers, 1998; Jean and Hall, 2001; Rachofsky et al., 2001). This has been used previously to demonstrate helix opening induced by the action of proteins, and base extrusion generated by enzymes. We have demonstrated previously large enhancement of 2-AP fluorescence intensity on binding of the yeast resolving enzyme Cce1 to DNA junctions (Déclais and Lilley, 2000).
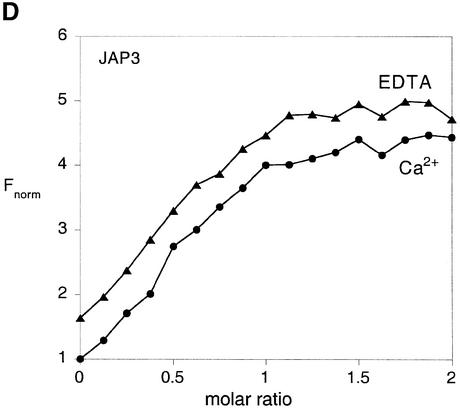
Fig. 4. Local structural distortion of the junction studied by 2-AP fluorescence. Corrected fluorescence emission spectra (λex = 315 nm) were recorded as a function of the concentration of added endonuclease I. (A) The central sequences of junctions JAP3 and JAP5, used as the basis for these experiments. The chemical structure of 2-AP is shown inserted. For each of the junctions, there are three consecutive adenine nucleotides (highlighted bold) on the 3′ (JAP3) or 5′ (JAP5) side of the point of strand exchange. For the fluorescence experiments, one of these will have been replaced by 2-AP. For the data shown, the substitution has been made immediately at the point of strand exchange. In all cases, 50 nM solutions of DNA junctions have been used. (B) Fluorescence emission spectra of JAP3 with 2-AP located at the point of strand exchange, collected in solution in the absence of added metal ions, in the presence of 1 mM EDTA. The spectra are labelled with the stoichiometry of the protein. (C) Fluorescence emission spectra of JAP3, collected in solution in the presence of 200 µM Ca2+. The spectra are labelled with the stoichiometry of the protein. (D) Plot of normalized fluorescence intensity of JAP3 as a function of the stoichiometry of endonuclease in the presence of EDTA (triangles) or 200 µM Ca2+ (circles). (E) Plot of normalized fluorescence intensity of JAP5 as a function of the stoichiometry of endonuclease in the presence of EDTA (triangles) or 200 µM Ca2+ (circles).
We employed the DNA junction JAP3 containing a 2-AP substitution at a base immediately 3′ to the point of strand exchange (Figure 4A). We recorded the fluorescence emission of the 2-AP base (λex = 315 nm) from 50 nM JAP3 in the range 330–450 nm, as a function of added endonuclease I concentration, in the presence of 200 µM Ca2+, or in 1 mM EDTA. The spectra show that there is a marked enhancement of 2-AP fluorescence with the addition of the protein (Figure 4B and C) that reaches a plateau of a 4-fold enhancement at stoichiometric concentrations of enzyme and junction, in the presence of either EDTA or Ca2+ (Figure 4D). We have carried out an equivalent analysis of a second junction JAP5, containing a 2-AP substitution at the base immediately 5′ to the point of strand exchange (Figure 4A). Addition of endo nuclease I resulted in a marked increase in fluorescence intensity, up to a 10-fold enhancement (Figure 4E) in both 200 µM Ca2+ and 1 mM EDTA. These experiments were repeated with JAP3 and JAP5, where the 2-AP substitutions were made at positions two or three nucleotides from the point of strand exchange. In these cases, there was no significant enhancement of fluorescence intensity (data not shown).
These results indicate that the local helical DNA structure surrounding the centre of the junction is distorted on binding endonuclease I, but that the effects are localized to those nucleotides adjacent to the point of strand exchange.
Reactivity of central thymine bases to permanganate on binding endonuclease I
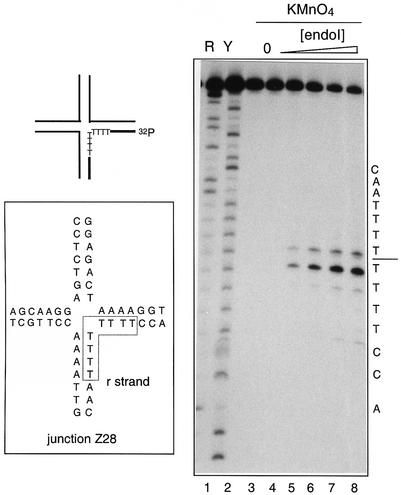
Permanganate ion reacts with the 5,6 double bond of thymine bases to generate a cis-diol that renders the polynucleotide backbone sensitive to base cleavage. The required out-of-plane attack is hindered when a T is base-paired and stacked into a B-form helix, but distortion of the DNA that exposes the 5,6 bond may result in enhanced local reactivity (Sasse-Dwight and Gralla, 1989). Central T bases of junctions become reactive when bound by Cce1 (White and Lilley, 1997) or RuvC (Bennett and West, 1995) for example. For this analysis, we used a four-way junction with T bases for four nucleotides on either side of the point of strand exchange on the r strand (junction Z28).
Junction Z28 (100 nM) 5′-32P-labelled on the r strand was incubated with increasing concentrations of endo nuclease I in the presence of 200 µM Ca2+. The complex was then reacted at room temperature with 1.25 mM KMnO4 solution for 1 min. After cleavage of diol adducts with hot piperidine base, the DNA was analysed by electrophoresis in a polyacrylamide sequencing gel and autoradiography (Figure 5).
Fig. 5. Opening of the junction by endonuclease I studied by permanganate probing. Junction Z28 was used for these experiments (central sequence shown in insert), radioactively 5′-32P-labelled on the r strand, which contains four thymine nucleotides on either side of the point of strand exchange. The junction in 200 µM CaCl2 was reacted with 1.25 mM permanganate in the presence of increasing quantities of bound endonuclease I. The DNA was then cleaved at the position of any cis-diol adducts by treatment with hot piperidine, and the products analysed by separation by denaturing gel electrophoresis and autoradiography. Lanes 1 and 2, Maxam–Gilbert (1980) sequencing reactions (purine-specific and pyrimidine-specific, respectively); lane 3, control incubation of the junction (100 nM) with 200 nM endonuclease I dimer in the absence of permanganate; lane 4, reaction of the junction with permanganate in the absence of endonuclease I; lanes 5–8, reaction of the junction with permanganate in the presence of 25, 50, 100 and 200 nM endonuclease I, respectively. The sequence of the r-strand of the junction is indicated down the right-hand side of the autoradiograph.
In the absence of protein, none of the nucleotides of the r strand was modified by KMnO4. However, on forming a junction–endonuclease I complex, the central T bases became selectively reactive, and the reactivity was maximal for a stoichiometric complex. Similar results were observed for the complex formed in the presence of EDTA in place of the Ca2+ (data not shown). This shows that the local structure of the DNA at the point of strand exchange is distorted by the binding of endonuclease I, in agreement with the results of the 2-AP fluorescence. Taken together, the spectroscopic and probing results indicate that the binding of endonuclease I distorts the DNA structure around the centre of the junction, leading to an exposure of the bases to the solvent.
Protection of DNA against hydroxyl radical attack on binding endonuclease I
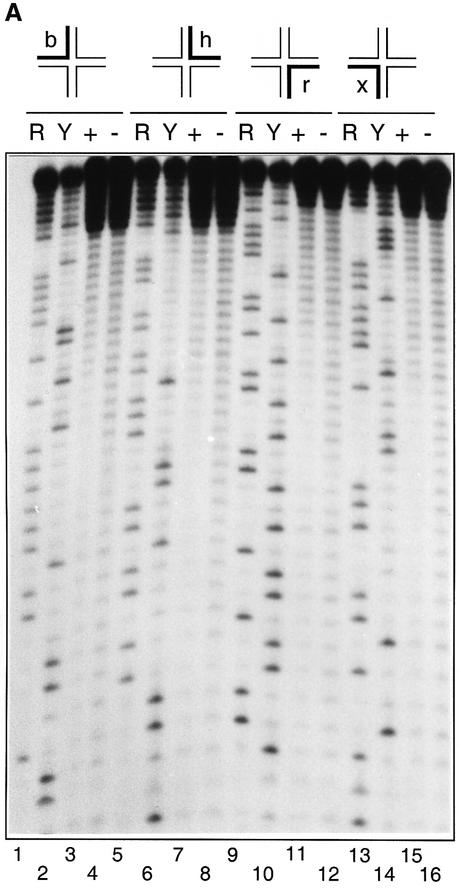
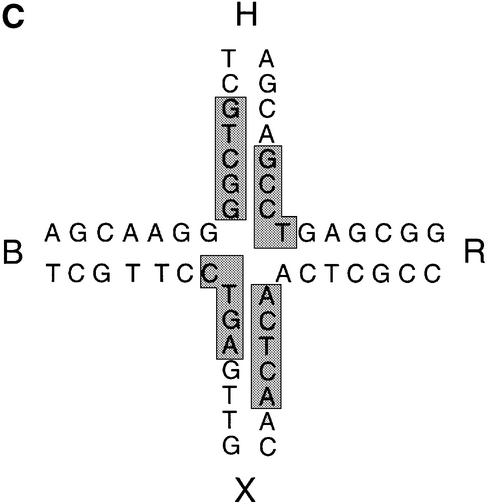
A dimer of endonuclease I binds to a four-way DNA junction with an affinity of KD = 1 nM or greater. It is therefore possible to footprint the protein on the DNA, for which we have used hydroxyl radicals. We used a form of junction 3 in which each arm was 25 bp in length and individually 5′-32P-labelled on a different strand. Com plexes were formed between 10 nM junction 3 and 30 nM endonuclease I; these were examined by non-denaturing gel electrophoresis to confirm that they consisted predominantly of junctions bound by a single endonuclease dimer (data not shown). The free DNA junctions and complexes were each subjected to OH radical cleavage for 2 min in the absence of divalent metal ions, and the DNA then analysed by means of sequencing gel electrophoresis (Figure 6A). In the absence of protein, regions of protection are observed at the centres of the b and r strands. These are the exchanging strands in the predominant stacking conformer, which are protected at the point of strand exchange in the stacked X-structure (Churchill et al., 1988). On addition of endonuclease I, we observe significant new regions of strong protection on all four strands due to the presence of the bound protein, which can be seen more clearly on the scans for each strand, presented in Figure 6B. The b and r strands are protected mainly on the 3′ side of the point of strand exchange, while the h and x strands are protected on both sides, but with greater protection 5′ to the point of strand exchange. These were quantified by integrating each band in the phosphoimage file, and the phosphates most strongly protected are summarized on the sequence of the junction in Figure 6C.
Fig. 6. Hydroxyl radical footprinting of endonuclease I on junction 3. (A) Four versions of junction 3 were prepared and radioactively 5′-32P-labelled on a unique strand. These were subjected to hydroxyl radical cleavage in the presence or absence of a stoichiometric quantity of endonuclease I. The products were separated by electrophoresis in a denaturing gel, and visualized by autoradiography. Phosphoimage files of similar gels were used for quantification. Lanes 1–4, 5–8, 9–12 and 13–16, junction labelled on b, h, r and x strands respectively; lanes 1, 5, 9 and 13, purine-specific sequencing reactions; lanes 2, 6, 10 and 14, pyrimidine-specific sequencing reactions; lanes 3, 7, 11 and 15, hydroxyl radical cleavage of junction 3 in the presence of endonuclease I; lanes 4, 8, 12 and 16, hydroxyl radical cleavage of free junction 3. (B) Radioactivity profiles of gel electrophoresis tracks from phosphoimages. These are shown for the four strands, where the left side is the 3′ end of the strand (corresponding to the top of the gel lane) in each case. The grey profiles are free junction, while the black profiles correspond to lanes in which junction–endonuclease I complexes were probed. The vertical bars denote the position of strand exchange on each strand. (C) Summary of the regions of greatest protection of the junction against hydroxyl radical attack. This shows the central sequence of the junction, with the protected region boxed. These correspond to >60% protection measured by quantification of radioactivity in individual bands.
Discussion
Like all other junction-resolving enzymes studied, endonuclease I distorts the structure of the DNA junction on binding. The comparative gel electrophoresis data obtained in the presence of divalent metal ions can be interpreted in terms of a co-existence of two equivalent forms of the complex, corresponding to the two stacking conformers of a structure in which the DNA axes are approximately perpendicular. However, the stacking is clearly not perfect, since localized structural perturbation around the point of strand exchange is indicated by 2-AP fluorescence enhancement and chemical reactivity of thymine bases. The two forms of the complex are not present in equal amounts, but biased towards the B on X stacking conformer. A recent single-molecule fluorescence study of junction 3 shows that as a protein-free junction, the two stacking conformers are in dynamic exchange, with populations biased 4-fold towards the B on X stacking conformer (McKinney et al., 2003). If this equilibrium were kinetically frozen by binding endonuclease I, this would be fully consistent with the observed results.
In each form of the complex, a single pair of strands is cleaved by endonuclease I. The major form of the complex (containing the B on X conformer) is cleaved on the h and x strands, while the minor form is cleaved on the b and r strands. This indicates that it is the continuous strands of the junction (i.e. those that pass along a stacked pair of helices, unaffected by the point of strand exchange to a first approximation) that are cleaved by endonuclease I. The two active sites identified in the crystal structure of endonuclease I (Hadden et al., 2002) appeared to be very far apart; the distance between the site I metal ions is 39 Å for example. However, the scissile phosphorus atoms on the continuous strands in the undistorted structure of the four-way DNA junction (Eichman et al., 2000) are separated by 32 Å, and this distance does not become greatly altered in the enzyme–junction complex (see below). Thus the active sites evidently are optimally spaced to accommodate the junction and cleave the continuous strands.
In the presence of EDTA to chelate metal ions, the structure of the endonuclease I–junction complex is different, with no evidence for alternative forms in slow exchange. Two explanations can be offered for this result. Taken at face value, the electrophoresis suggests that the junction adopts a parallel structure under these conditions, with a predominantly B on X stacking. Since the free junction is in the open, extended-square structure prior to complex formation, there would be no stacking conformer equilibrium preceding the complex. However, it is not obvious why the junction in this form of the complex should exhibit such a high bias towards one stacking conformer. An alternative explanation is that the observed profile represents an averaging due to fast exchange between two 90° conformers similar to those detected in the presence of Ca2+ (Figure 2B). If the endo nuclease I–junction complexes were to adopt these conformations, with a similar 4:1 population bias towards the B on X stacking conformer, and exchange between the two forms was fast compared with the gel process, this would be expected to give a pattern that is a 4:1 weighted average of the individual patterns of each conformer. This would give an intermediate–slow–fast–fast–slow– intermediate profile, in good agreement with that observed (Figure 2A). This explanation fits better with the lack of significant differences between the complexes formed in the presence or absence of divalent metal ions by any of the techniques used in this work.
In the natural situation, where endonuclease I is active in the cleavage of DNA junctions, the relevant structure will be that observed in the presence of divalent metal ions. We have therefore modelled the structure of the predominant stacking form of the complex, using the crystal structure of the protein (Hadden et al., 2001, 2002) as a starting point. We were greatly helped in this study by knowledge of the structure of the complex of the restriction enzyme BglI and a DNA oligonucleotide (Newman et al., 1998); the α and β carbon atoms of the active site residues superimpose to an r.m.s.d. of 0.33 Å and thus the two structures clearly are closely related locally.
Using a graphical modelling package (Insight II), we created two B-DNA double helices of 30 bp representing the two stacked helices (B on X, and H on R) in the major stacking conformer of junction 3. One of these was docked onto the active site of endonuclease I in order to superimpose the structure with that of the BglI–DNA complex. The second duplex was then placed in the structure using the symmetry of the protein. At this point, the best model obtained showed some steric clashes between the DNA and the loop between β5 and α3. In order to reduce this, the DNA molecules were divided at the centre, and manually moved apart. At the same time, the fit to the regions of greatest protection against hydroxyl radicals was improved. The resulting disruption of the DNA structure around the point of strand exchange is consistent with the results of 2-AP fluorescence enhancement and KMnO4 reactivity. The final step in the modelling was to connect the exchanging strands, which was achieved without further distortion of the structure.
The emerging model (Figure 7) is consistent with all the available data, although at the present time we cannot exclude other orientations of the protein on the DNA. The DNA is in the form of a 90° cross of stacked helices, in agreement with the comparative gel electrophoresis, with some distortion localized to the base pairs at the point of strand exchange. The active sites are adjacent to the scissile phosphate groups of the continuous strands on the outer faces of the junction. The structure accommodates the contacts observed in the BglI complex structure (Newman et al., 1998), and the phosphate group 3′ to the scissile phosphate superimposes well with the sulfate ion observed in the wild-type endonuclease I structure (Hadden et al., 2002). The separation between the two scissile phosphate groups is 34 Å; the site 1 metal ion is 2.6 Å from the scissile phosphorus atom, well placed to position the attacking water nucleophile. The interaction of the protein with the continuous strands flanking the cleavage site leads to well defined regions of protection against OH radical attack. The model is less successful in explaining the pattern of cleavage on the exchanging strands, which are protected on the opposite sides of the minor groove from the sites on the continuous strands. The basic C-terminal region, which is known to be important for binding the junction (Parkinson et al., 1999), is not visible in the crystal structure of the free protein, but the last located residue is adjacent to this position in the model; it is therefore possible that the C-terminal peptide becomes bound in the minor groove. Furthermore, the N-terminal 11 residues of the protein are also missing in the crystal structure, and the truncated N-terminus is also close to the protected region of the DNA. Interpretation of these data is complicated by the existence of the two forms of the complex present in solution.
Fig. 7. Molecular model of the structure of the endonuclease I–junction complex. (A and B) Two orthogonal views of the structure of the DNA junction in the complex, with the protein removed for clarity. The paths of the strands are highlighted by ribbons, and the four strands are differentiated by colour. Note that the global structure is in good agreement with that deduced from the comparative gel electrophoretic analysis; compare with Figure 2B. (C) Parallel-eye stereoscopic view of the structure of the complex. The protein is represented as a ribbon, with the two polypeptides differentiated by colour. The DNA strands are colour coded as in (A) and (B); note that the continuous strands are coloured yellow and red. The metal ions at the active sites are shown by space-filling in purple. The hydroxyl radical footprints (≥60% protection) are shown by the grey balls on the backbones. (D) Stereoscopic close-up view of the active site interacting with a continuous strand. The scissile phosphate is shown as a ball and stick, and the metal ions are shown by space-filling (yellow). The four active site residue side chains are indicated; those from one polypeptide (Asp55, Glu65 and Lys67) are blue, while Glu20 from the other polypeptide is green.
One of the major goals of these studies is to explain the manner of recognition of the structure of the DNA junction by proteins. We now see that the rather unusual structure of endonuclease I, with the two domains separated by the extended β-bridge, generates a structure in which the DNA-binding faces are oriented in such a manner to select for the structure of the junction. The two active sites are oriented in almost opposite directions to one another, but these become juxtaposed with the outer faces of the junction, with the β-bridge passing across the major groove face of the junction. Conceivably other branched DNA structures could be accommodated into the structure of the protein, and both three-way junctions and bulged DNA structures can serve as substrates for endonuclease I.
In summary, it can be seen how the structure of the resolving enzyme allows for the selective recognition of the branched structure of the DNA junction, permitting simultaneous contacts between the active sites and the two continuous strands of the junction. This facilitates the coordinated cleavage of the two strands (Parkinson and Lilley, 1997), leading to a productive resolution of the junction.
Materials and methods
Expression and purification of T7 endonuclease I
Wild-type endonuclease I was expressed and purified as previously described (Hadden et al., 2001, 2002). For the footprinting experiments, the D55N mutant of endonuclease I was expressed and purified essentially as the wild-type enzyme, except that the tryptic digestion was omitted.
Oligonucleotide synthesis and assembly of DNA substrates
Oligonucleotides were synthesized using β-cyanoethyl phosphoramidite chemistry (Beaucage and Caruthers, 1981; Sinha et al., 1984). 2-AP phosphoramidite was obtained from Glen Research. Stoichiometric quantities of four purified strands were annealed by incubation in 20 mM Tris–HCl pH 8 for 5 min at 85°C, followed by slow cooling. In the case of 2-AP-containing species, the non-labelled strands were in a slight excess to ensure that the modified strand would be completely incorporated into the four-way junction.
Analysis of cleavage of DNA junctions by T7 endonuclease I
Determination of the kinetics of junction cleavage were carried out with a QFM400 quenched-flow apparatus (Bio-Logic, Grenoble, France), fitted with a 4 µl delay line and thermostated at 20°C. For this, 80 nM endonuclease I wt (ΔN11) was pre-incubated with 40 nM junction 3 uniquely radioactively 5′-32P-labelled on a single strand in binding buffer [50 mM Tris–HCl pH 7.5, 50 mM NaCl, 1 mM EDTA, 800 µg/ml bovine serum albumin (BSA)] for at least 15 min to allow the complex to form. The reaction was initiated by mixing 15 µl of complex with 15 µl of 21 mM MgCl2 in EDTA-free binding buffer, and the reaction terminated at various time intervals by adding 15 µl of quenching buffer (120 mM EDTA). After denaturation, samples were electrophoresed in a 15% polyacrylamide gel containing 7 M urea at 80 W for 45 min. The dried gel was exposed to storage phosphor screens (BAS-IP MP 2040), and quantified using a BAS-1500 phosphoimager (Fuji) and MacBAS v2.5 software. Data were analysed as fraction of DNA cleaved (fc) versus ageing time (ta), and were fitted by non-linear regression analysis to either of the following equations:
fc = fc∞ [1 – e–kobsta](1)
where fc∞ is the fraction of DNA cut at the end of the reaction and kobs the rate of cleavage
fc = fc∞ [1 – xe–k1ta – (1 – x)e–k2ta](2)
where fc∞ is the fraction of DNA cut at the end of the reaction, k1 and k2 the rates of cleavage and x the fraction of enzyme that cleaves with the rate k1.
Analysis of cleavage reactions within polyacrylamide gel slices
A form of junction 3 with long (50 bp) H and R arms and short (20 bp) B and X arms was used in this experiment. Radioactively 5-32P-labelled junction (100 nM) was incubated with 200 nM endonuclease I in 10 mM HEPES pH 7.5, 0.1 M NaCl and 0.2 mM CaCl2 in a total volume of 20 µl for 1 h at 4°C. The two complexes were separated by electrophoresis in 8% polyacrylamide in 90 mM Tris-borate pH 8.3 (TB buffer), 0.2 mM CaCl2 at 4°C. Gel slices containing complexes were suspended in TB, 0.2 mM CaCl2, and MgCl2 was added to 20 mM and incubated at 4°C for 15–60 s. The reaction was terminated by addition of CaCl2 to 20 mM, and the gel slices were washed with water. The DNA was electroeluted into 90 mM Tris-borate pH 8.3, 1 mM EDTA (TBE buffer), precipitated with ethanol, resuspended in formamide and analysed by electrophoresis in a 12% polyacrylamide sequencing gel.
Analysis of global structure by comparative gel electrophoresis
Six junctions comprising two long arms of 60 bp and two short arms of 15 bp were each generated by hybridization of appropriate oligonucleotides with the sequence of junction 3 (Duckett et al., 1988). The complete sequences are given in Giraud-Panis and Lilley (1998). Endonuclease I (20 nM) was incubated with 5′-32P-labelled four-way DNA junction in 25 mM Tris–HCl pH 8.0, 50 mM NaCl, 1 mM EDTA or 0.2 mM CaCl2 in a total volume of 10 µl for 10 min at 22°C. Then 0.25% bromophenol blue, 0.25% xylene cyanol FF and 1/6 vol. of 15% Ficoll type 400 were added. Samples were loaded onto 5% polyacrylamide gels and electrophoresed for 12 h in either TBE or TB, 0.2 mM CaCl2. Dried gels were exposed to storage phosphor screens and phosphoimaged, or subjected to autoradiography.
Fluorescence spectroscopy and data processing
The junctions used in these experiments (JAP3 and JAP5) are described in Déclais and Lilley (2000). Steady-state fluorescence spectra were recorded on a SLM-Aminco 8100 fluorimeter. Fluorescence emission spectra were obtained by excitation at 315 nm in order to minimize the fluorescence of the endonuclease I protein, which contains three tryptophan residues. Emission was recorded between 330 and 450 nm in 1 nm intervals. The excitation and emission monochromators were set with band passes of 4 and 8 nm, respectively. Spectra were corrected for lamp fluctuations and instrumental variations. All measurements were performed at 10°C in a 5 × 5 mm cuvette. Samples contained 50 nM DNA in 20 mM Tris–HCl pH 7.5, 50 mM NaCl, 0.2 mM dithiothreitol (DTT) plus either 1 mM EDTA or 0.2 mM CaCl2 and the indicated amount of endonuclease I in a total volume of 500 µl. All fluorescence emission spectra and fluorescence intensities were corrected for tryptophan fluorescence and background emission by subtraction of control spectra, where the 2-AP fluorophore was replaced by adenine. The resulting corrected fluorescence intensities are referred to as Fcorr. For the binding curves, spectra were integrated and normalized to the value obtained for the free junction in 0.2 mM CaCl2. The resulting values are referred to as Fnorm.
Sequencing of DNA
Sequence markers were generated by purine-specific cleavage using the formic acid reaction, and by pyrimidine-specific cleavage using the hydrazine reaction (Maxam and Gilbert, 1980). Modified DNA was reacted with 1 M piperidine at 95°C for 30 min, followed by repeated lyophilization.
Chemical probing using potassium permanganate
Purified junction Z28 (100 nM) 5′-32P-labelled on the r strand junction was incubated at room temperature for 5 min in the presence of various concentrations of endonuclease I in 20 mM Tris–HCl pH 7.5, 50 mM NaCl, 50 µg/ml calf thymus DNA and either 1 mM EDTA or 0.2 mM CaCl2. The total reaction volume was 20 µl. Reactions were initiated by the addition of 2 µl of 12.5 mM KMnO4, and were terminated after 1 min by the addition of 1.5 µl of β-mercaptoethanol. KMnO4 and β-mercaptoethanol were replaced by water in control incubations. After ethanol precipitation, DNA samples were reacted with 100 µl of 1 M piperidine at 95°C for 30 min. Piperidine was removed by vacuum desiccation and the residues were washed with 100 µl of water and vacuum desiccated overnight. Dried samples were resuspended in formamide and analysed on denaturing 15% polyacrylamide sequencing gels. The sequences of the oligonucleotides used to prepare junction Z28 were (written 5′–3′): b strand, TCCGTCCTAGCAAGGAGTCTGCTACCGGAA; h strand, TTCCGGTAGCAGACTAAAAGGTGGTTGAAT; r strand, ATTCAACCACCTTTTTTTTAACTGCAGCAG; and x strand; CTGCTGCAGTTAAAACCTTGCTAGGACGGA.
Hydroxyl radical footprinting
A concentration of 10 nM of junction 3, 5′-32P-labelled on a single strand, was incubated with 30 nM of endonuclease I in 10 mM HEPES pH 7.5, 0.1 M NaCl, 10% BSA and 1 mM EDTA in a total volume of 90 µl. A 5 µl aliquot of a freshly prepared reaction solution was added to final concentrations of 0.1 mM Fe(II), 0.2 mM EDTA, 1 mM ascorbate and 0.03% hydrogen peroxide (Dixon et al., 1991). After incubation at room temperature for 2 min, the reaction was terminated by addition of thiourea to 0.1 M. Calf thymus DNA was added to 10 ng/µl, and the solution extracted with phenol–chloroform before the DNA was precipitated with ethanol. The pellet was then resuspended in formamide and the DNA subjected to electrophoresis in a 12% polyacrylamide sequencing gel. Radioactivity was quantified using phosphoimaging. The version of junction 3 used in these studies had four arms of 25 bp, and the component strands had the sequences: b strand, CCTCGAGGGATCCGTCCTAGCAAGGGGCTGCTACCGGAAGCTTACAGATG; h strand, CATCTGTAAGCTTCCGGTAGCAGCCTGAGCGGTGGTTGAATTCACAGATG; r strand, CATCTGTGAATTCAACCACCGCTCAACTCAACTGCAGTCTAGAACACATG; and x strand, CATCTGT TCTAGACTGCAGTTGAGTCCTTGCTAGGACGGATCCCTCGAGG.
Acknowledgments
Acknowledgements
We thank David Norman for discussion, Kaera Maxwell for excellent technical assistance with chemical synthesis of oligonucleotides, and the Cancer Research UK for financial support.
References
- Ariyoshi M., Vassylyev,D.G., Iwasaki,H., Nakamura,H., Shinagawa,H. and Morikawa,K. (1994) Atomic structure of the RuvC resolvase: a Holliday junction-specific endonuclease from E.coli. Cell, 78, 1063–1072. [DOI] [PubMed] [Google Scholar]
- Beaucage S.L. and Caruthers,M.H. (1981) Deoxynucleoside phosphor amidites—a new class of key intermediates for deoxypolynucleotide synthesis. Tetrahedron Lett., 22, 1859–1862. [Google Scholar]
- Bennett R.J. and West,S.C. (1995) Structural analysis of the RuvC–Holliday junction complex reveals an unfolded junction. J. Mol. Biol., 252, 213–226. [DOI] [PubMed] [Google Scholar]
- Bond C.S., Kvaratskhelia,M., Richard,D., White,M.F. and Hunter,W.N. (2001) Structure of Hjc, a Holliday junction resolvase, from Sulfolobus solfataricus. Proc. Natl Acad. Sci. USA, 98, 5509–5514. [DOI] [PMC free article] [PubMed] [Google Scholar]
- Ceschini S., Keeley,A., McAlister,M.S.B., Oram,M., Phelan,J., Pearl,L.H., Tsaneva,I.R. and Barrett,T.E. (2001) Crystal structure of the fission yeast mitochondrial Holliday junction resolvase Ydc2. EMBO J., 20, 6601–6611. [DOI] [PMC free article] [PubMed] [Google Scholar]
- Churchill M.E., Tullius,T.D., Kallenbach,N.R. and Seeman,N.C. (1988) A Holliday recombination intermediate is twofold symmetric. Proc. Natl Acad. Sci. USA, 85, 4653–4656. [DOI] [PMC free article] [PubMed] [Google Scholar]
- Clegg R.M., Murchie,A.I.H., Zechel,A., Carlberg,C., Diekmann,S. and Lilley,D.M.J. (1992) Fluorescence resonance energy transfer analysis of the structure of the four-way DNA junction. Biochemistry, 31, 4846–4856. [DOI] [PubMed] [Google Scholar]
- Cooper J.P. and Hagerman,P.J. (1987) Gel electrophoretic analysis of the geometry of a DNA four-way junction. J. Mol. Biol., 198, 711–719. [DOI] [PubMed] [Google Scholar]
- Déclais A.-C. and Lilley,D.M.J. (2000) Extensive central disruption of a four-way junction on binding CCE1 resolving enzyme. J. Mol. Biol., 296, 421–433. [DOI] [PubMed] [Google Scholar]
- Déclais A.-C., Hadden,J.M., Phillips,S.E.V. and Lilley,D.M.J. (2001) The active site of the junction-resolving enzyme T7 endonuclease I. J. Mol. Biol., 307, 1145–1158. [DOI] [PubMed] [Google Scholar]
- Dixon W.J., Hayes,J.J., Levin,J.R., Weidner,M.F., Dombroski,B.A. and Tullius,T.D. (1991) Hydroxyl radical footprinting. Methods Enzymol., 208, 380–413. [DOI] [PubMed] [Google Scholar]
- Duckett D.R., Murchie,A.I.H., Diekmann,S., von Kitzing,E., Kemper,B. and Lilley,D.M.J. (1988) The structure of the Holliday junction and its resolution. Cell, 55, 79–89. [DOI] [PubMed] [Google Scholar]
- Duckett D.R., Giraud-Panis,M.-E. and Lilley,D.M.J. (1995a) Binding of the junction-resolving enzyme bacteriophage T7 endonuclease I to DNA: separation of binding and catalysis by mutation. J. Mol. Biol., 246, 95–107. [DOI] [PubMed] [Google Scholar]
- Duckett D.R., Murchie,A.I.H. and Lilley,D.M.J. (1995b) The global folding of four-way helical junctions in RNA, including that in U1 snRNA. Cell, 83, 1027–1036. [DOI] [PubMed] [Google Scholar]
- Eichman B.F., Vargason,J.M., Mooers,B.H.M. and Ho,P.S. (2000) The Holliday junction in an inverted repeat DNA sequence: sequence effects on the structure of four-way junctions. Proc. Natl Acad. Sci. USA, 97, 3971–3976. [DOI] [PMC free article] [PubMed] [Google Scholar]
- Fogg J.M. and Lilley,D.M.J. (2000) Ensuring productive resolution by the junction-resolving enzyme RuvC: large enhancement of second-strand cleavage rate. Biochemistry, 39, 16125–16134. [DOI] [PubMed] [Google Scholar]
- Fogg J.M., Schofield,M.J., Déclais,A.-C. and Lilley,D.M.J. (2000) The yeast resolving enzyme CCE1 makes sequential cleavages in DNA junctions within the lifetime of the complex. Biochemistry, 39, 4082–4089. [DOI] [PubMed] [Google Scholar]
- Fogg J.M., Kvaratskhelia,M., White,M.F. and Lilley,D.M.J. (2001) Distortion of DNA junctions imposed by the binding of resolving enzymes: a fluorescence study. J. Mol. Biol., 313, 751–764. [DOI] [PubMed] [Google Scholar]
- Giraud-Panis M.-J.E. and Lilley,D.M.J. (1998) Structural recognition and distortion by the DNA junction-resolving enzyme RusA. J. Mol. Biol., 278, 117–133. [DOI] [PubMed] [Google Scholar]
- Gough G.W. and Lilley,D.M.J. (1985) DNA bending induced by cruciform formation. Nature, 313, 154–156. [DOI] [PubMed] [Google Scholar]
- Hadden J.M., Convery,M.A., Déclais,A.-C., Lilley,D.M.J. and Phillips,S.E.V. (2001) Crystal structure of the Holliday junction-resolving enzyme T7 endonuclease I at 2.1 Å resolution. Nat. Struct. Biol., 8, 62–67. [DOI] [PubMed] [Google Scholar]
- Hadden J.M., Déclais,A.-C., Phillips,S.E.V. and Lilley,D.M.J. (2002) Metal ions bound at the active site of the junction-resolving enzyme T7 endonuclease I. EMBO J., 21, 3505–3515. [DOI] [PMC free article] [PubMed] [Google Scholar]
- Jean J.M. and Hall,K.B. (2001) 2-aminopurine fluorescence quenching and lifetimes: role of base stacking. Proc. Natl Acad. Sci. USA, 98, 37–41. [DOI] [PMC free article] [PubMed] [Google Scholar]
- Law S.M., Eritja,R., Goodman,M.F. and Breslauer,K.J. (1996) Spectroscopic and calorimetric characterizations of DNA duplexes containing 2-aminopurine. Biochemistry, 35, 12329–12337. [DOI] [PubMed] [Google Scholar]
- Lilley D.M.J. (2000) Analysis of the global conformation of branched RNA species by a combined electrophoresis and fluorescence approach. Methods Enzymol., 317, 368–393. [DOI] [PubMed] [Google Scholar]
- Lilley D.M.J. and White,M.F. (2000) Resolving the relationships of resolving enzymes. Proc. Natl Acad. Sci. USA, 97, 9351–9353. [DOI] [PMC free article] [PubMed] [Google Scholar]
- Lilley D.M.J. and White,M.F. (2001) The junction-resolving enzymes. Nat. Rev. Mol. Cell Biol., 2, 433–443. [DOI] [PubMed] [Google Scholar]
- Maxam A.M. and Gilbert,W. (1980) Sequencing end-labelled DNA with base-specific chemical cleavages. Methods Enzymol., 65, 499–560. [DOI] [PubMed] [Google Scholar]
- McKinney S.A., Déclais,A.-C., Lilley,D.M.J. and Ha,T. (2003) Structural dynamics of individual Holliday junctions. Nat. Struct. Biol., 10, 93–97. [DOI] [PubMed] [Google Scholar]
- Newman M., Lunnen,K., Wilson,G., Greci,J., Schildkraut,I. and Phillips,S.E.V. (1998) Crystal structure of restriction endonuclease BglI bound to its interrupted DNA recognition sequence. EMBO J., 17, 5466–5476. [DOI] [PMC free article] [PubMed] [Google Scholar]
- Nishino T., Komori,K., Tsuchiya,D., Ishino,Y. and Morikawa,K. (2001) Crystal structure of the archaeal Holliday junction resolvase Hjc and implications for DNA recognition. Structure, 9, 197–204. [DOI] [PubMed] [Google Scholar]
- Parkinson M.J. and Lilley,D.M.J. (1997) The junction-resolving enzyme T7 endonuclease I: quaternary structure and interaction with DNA. J. Mol. Biol., 270, 169–178. [DOI] [PubMed] [Google Scholar]
- Parkinson M.J., Pöhler,J.R.G. and Lilley,D.M.J. (1999) Catalytic and binding mutants of the junction-resolving enzyme endonuclease I of bacteriophage T7: role of acidic residues. Nucleic Acids Res., 27, 682–689. [DOI] [PMC free article] [PubMed] [Google Scholar]
- Pöhler J.R.G., Giraud-Panis,M.-J.E. and Lilley,D.M.J. (1996) T4 endonuclease VII selects and alters the structure of the four-way DNA junction; binding of a resolution-defective mutant enzyme. J. Mol. Biol., 260, 678–696. [DOI] [PubMed] [Google Scholar]
- Raaijmakers H., Vix,O., Toro,I., Golz,S., Kemper,B. and Suck,D. (1999) X-ray structure of T4 endonuclease VII: a DNA junction resolvase with a novel fold and unusual domain-swapped dimer architecture. EMBO J., 18, 1447–1458. [DOI] [PMC free article] [PubMed] [Google Scholar]
- Rachofsky E.L., Osman,R. and Ross,J.B.A. (2001) Probing structure and dynamics of DNA with 2-aminopurine: effects of local environment on fluorescence. Biochemistry, 40, 946–956. [DOI] [PubMed] [Google Scholar]
- Sasse-Dwight S. and Gralla,J.D. (1989) KMnO4 as a probe for lac promoter DNA melting and mechanism in vivo. J. Biol. Chem., 264, 8074–8081. [PubMed] [Google Scholar]
- Sinha N.D., Biernat,J., McManus,J. and Koster,H. (1984) Polymer support oligonucleotide synthesis XVIII: use of β-cyanoethyl-N,N-dialkylamino/N-morpholino phosphoramidite of deoxynucleosides for the synthesis of DNA fragments simplifying deprotection and isolation of the final product. Nucleic Acids Res., 12, 4539–4557. [DOI] [PMC free article] [PubMed] [Google Scholar]
- Stivers J.T. (1998) 2-aminopurine fluorescence strudies of base stacking interactions at abasic sites in DNA: metal-ion and base sequence effects. Nucleic Acids Res., 26, 3837–3844. [DOI] [PMC free article] [PubMed] [Google Scholar]
- Ward D.C., Reich,E. and Stryer,L. (1969) Fluorescence studies of nucleotides and polynucleotides. I. Formycin, 2-aminopurine riboside, 2,6-diaminopurine riboside and their derivatives. J. Biol. Chem., 244, 1228–1237. [PubMed] [Google Scholar]
- White M.F. and Lilley,D.M.J. (1997) The resolving enzyme CCE1 of yeast opens the structure of the four-way DNA junction. J. Mol. Biol., 266, 122–134. [DOI] [PubMed] [Google Scholar]
- White M.F. and Lilley,D.M.J. (1998) Interaction of the resolving enzyme YDC2 with the four-way DNA junction. Nucleic Acids Res., 26, 5609–5616. [DOI] [PMC free article] [PubMed] [Google Scholar]
- Xu D., Evans,K.O. and Nordlund,T.M. (1994) Melting and premelting transitions of an oligomer measured by DNA base fluorescence and absorption. Biochemistry, 33, 9592–9599. [DOI] [PubMed] [Google Scholar]


