

J. Clin. Invest. 110:61–69 (2002) doi:10.1172/JCI200214752.
the final stages of the production process, an error was introduced into Figure 4. The correct version of the figure and the legend appear below.
Figure 4.
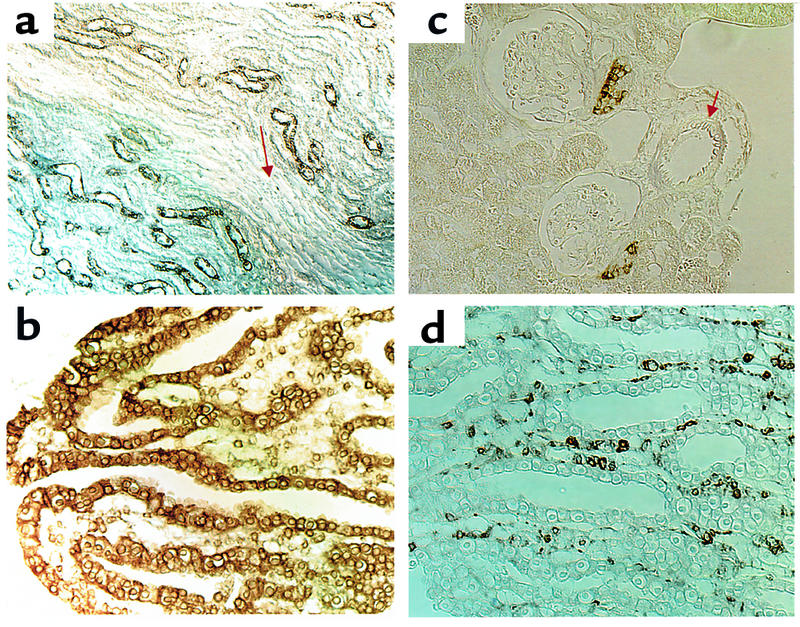
Distribution of COX1 and COX2 in mouse kidney. COX1 immunoreactivity in mouse outer medulla and papilla (a and b). COX2 immunoreactivity in cortex and medulla, respectively (c and d) . Arrows indicate a vascular bundle in a and an intermediate-size arteriole in c.