

Short abstract
Using comparative genomic microarray analysis (CGMA), 104 hepatocellular carcinoma (HCC) gene-expression microarray profiles were analyzed. CGMA identified 13 regions of frequent cytogenetic change in the HCC samples (+lq, -4q, +6p, -8p, +8q, -13q, -16q, -17p, +17q, +20q) three three of which have not been previously identified
Abstract
Background
Hepatocellular carcinoma (HCC) is a leading cause of death worldwide. Frequent cytogenetic abnormalities that occur in HCC suggest that tumor-modifying genes (oncogenes or tumor suppressors) may be driving selection for amplification or deletion of these particular genetic regions. In many cases, however, the gene(s) that drive the selection are unknown. Although techniques such as comparative genomic hybridization (CGH) have traditionally been used to identify cytogenetic aberrations, it might also be possible to identify them indirectly from gene-expression studies. A technique we have called comparative genomic microarray analysis (CGMA) predicts regions of cytogenetic change by searching for regional gene-expression biases. CGMA was applied to HCC gene-expression profiles to identify regions of frequent cytogenetic change and to identify genes whose expression is misregulated within these regions.
Results
Using CGMA, 104 HCC gene-expression microarray profiles were analyzed. CGMA identified 13 regions of frequent cytogenetic change in the HCC samples. Ten of these regions have been detected in previous CGH studies (+lq, -4q, +6p, -8p, +8q, -13q, -16q, -17p, +17q, +20q). CGMA identified three additional regions that have not been previously identified by CGH (+5q, +12q, +19p). Genes located in regions of frequent cytogenetic change were examined for changed expression in the HCC samples.
Conclusions
Our results suggest that CGMA predictions using gene-expression microarray datasets are a practical alternative to CGH profiling. In addition, CGMA might be useful for identifying candidate genes within cytogenetically abnormal regions.
Background
Aneuploidy is a common feature of cancer. Genetic alterations such as amplification, deletion, translocation and rearrangement could result in either gain-of-function or loss-of-function mutations in genes that modulate aspects of cell proliferation, differentiation, motility and survival. Whereas cytogenetic profiling techniques, such as comparative genomic hybridization (CGH) [1], have been useful in finding genetic abnormalities, other experimental approaches are frequently used to identify which specific gene(s) drive selection for the genetic aberration and contribute most to tumor progression. Common gene identification techniques include determining if a candidate gene contains a sequence mutation and/or determining if the candidate gene or gene product is abnormally expressed. As mutation analysis and protein expression studies are time-consuming, increasingly high-throughput gene-expression profiling is being used to identify abnormally expressed genes within a region of cytogenetic change [2,3,4,5,6].
Recently, several groups have observed that chromosomal changes can lead to regional biases in gene-expression values both in yeast (Saccharomyces cerevisiae) and in human tumors and tumor-derived cell lines [2,3,7,8]. These studies suggest that a fraction of gene-expression values (15-25%) are regulated in concordance with gene dosage. A computational technique termed comparative genomic microarray analysis (CGMA) has previously been used to identify regions of allelic imbalance indirectly from gene-expression profiles of human tumors [8]. CGMA predicts chromosomal amplifications and deletions by organizing gene-expression data by genomic mapping location and scanning for regions that contain a statistically significant number of gene-expression values that change in the same relative direction. In this study, we apply CGMA analysis to a large hepatocellular carcinoma microarray dataset to demonstrate its validity as an alternative to CGH and to identify candidate genes in regions of frequent cytogenetic change.
Primary liver cancer in adults is the sixth most common form of cancer and the fourth leading cause of death from cancer worldwide [9,10]. Through the examination of hepatitis B virus (HBV) - and hepatitis C virus (HCV)-induced tumors, two landmark CGH studies have suggested that a subset of cytogenetic changes frequently occurs in HCC [11,12]. These include frequent gain of chromosomes 1q, 6p, 8q, 17q and 20q and frequent loss of chromosomes 1p, 4q, 6q, 8p, 13, 16 and 17p [11,12]. In particular, gain of chromosomes 1q and 8q has been associated with the early development of HCC [12], whereas loss of chromosome 4q has been linked to increased aggressiveness of established tumors [11]. To determine whether gene-expression data could be used to identify cytogenetic changes accurately, we applied CGMA to a microarray dataset of HCC tumors and compared the CGMA predictions to existing CGH data. For HCC, CGMA was able to predict nearly all chromosomal aberrations identified previously by CGH. In addition, from the gene-expression data we also identified a set of genes whose expression values change most within the regions of cytogenetic change. These genes may represent candidate genes whose expression changes drive selection for chromosomal gains or losses.
Results
CGMA predictions of cytogenetic changes
Normalized, log-transformed gene-expression data from 104 HCC gene-expression arrays [13] were obtained from the Stanford Microarray Database [14]. As CGMA analysis yields more intuitive predictions if the tumor expression data is compared to a normal tissue reference, the original HCC gene-expression data was mathematically transformed such that the pooled cell-line reference was replaced by a normal tissue reference ([3], see Materials and methods). Using this transformation, gene-expression values from the tumor sample are compared to corresponding values from non-cancerous tissue. Genomic regions that contain a disproportionate number of genes that change expression in the same relative direction (that is, show a gene-expression bias) may indicate an underlying chromosomal gain or loss (Figure 1a) [2,3,7,8]. Chromosomal regions that contained a gene-expression bias with at least 95% confidence (a sign test z-statistic of at least 1.96, see Materials and methods) were identified for all 104 HCC expression profiles (Figure 1b). In addition, genomic regions that contained significant gene-expression biases in at least 35% of non-replicate samples were identified (Figure 1c). A 35% threshold was chosen because in previous CGMA profiling experiments this threshold yielded the highest CGMA to CGH agreement ([8] and data not shown). CGMA predicted frequent gains for chromosome 1q (gained in 72% of tumor samples), 6p (56%), 8q (49%), 17q (46%), 20q (46%), 5q (42%), 19P (37%) and 12q (35%). Frequent chromosomal losses were predicted for chromosome 4q (lost in 66% of tumor samples), 17p (48%), 13 (39%), 16 (37%), and 8p (35%). To determine if CGMA predictions were consistent with other cytogenetic profiling studies, the CGMA data were compared with data from two of the largest CGH profiling studies (67 and 50 samples, respectively) using HCC tumors [11,12]. Of the 13 regions detected by CGMA, 10 (77%) were also implicated by CGH (Figure 1c). CGMA also detected three gained regions, chromosomes 5q, 12q and 19p, which were not implicated in the CGH analysis. CGMA failed to discover two regions of loss detected by CGH - chromosomes 1p and 6q. It is noteworthy that these particular losses were not identified in both CGH studies. These data suggest that CGMA predictions produce results very similar to traditional CGH profiling studies.
Figure 1.

Comparative genomic microarray analysis of hepatocellular carcinoma gene expression profiles. (a) A bar graph of log-transformed expression ratios (tumor versus normal) for genes located on chromosome 8q for sample SF13. The gene-expression values are organized from the chromosome telomere (top) to the centromere (bottom). A scale is shown above the graph. (b) CGMA expression profiles for 104 HCC tissue samples. Before CGMA analysis, gene-expression ratios were transformed such that each tumor gene-expression value was compared to the expression value from the non-cancerous tissue sample retrieved from the same patient. If the normal tissue was not present, the global mean of the non-tumor tissues was used. Genomic regions that show a significant number of downregulated genes are shown in green whereas genomic regions that show a significant number of upregulated genes are shown in red. The color intensity indicates the significance of the expression bias. The lowest-intensity color indicates a z-statistic = 1.96 (α = 0.05) while the most intense color indicates a z-statistic <3.29 (α < 0.001). The mean z-statistic for each genomic region is displayed in the rightmost column. (c) Chromosomal regions that had a significant gene-expression bias in more than 35% of HCC samples are listed. Red represents chromosomal gains and green represents losses. The corresponding percentages of samples that displayed frequent chromosomal aberrations identified in two CGH studies. Values from Wong et al.[12] are represented as CGH1 and values from Marchio et al. [11] are represented as CGH2.
Comparison to previous HCC studies
To date there have been at least 20 reports on the application of CGH to HCC [11,12,15,16,17,18,19,20,21,22,23,24,25,26,27,28,29,30,31,32]. To determine whether the differences between the CGMA predictions and the two large CGH studies were similar to the experimental variation observed between different HCC CGH studies, predictions produced by CGMA were compared to 13 different HCC CGH profiling studies (Figure 2). CGMA produced 10 of 13 (77%) predictions that matched a consensus chromosomal aberration profile. On average, each CGH study matched the consensus profile in 78 ± 14% of the chromosomal regions analyzed. Therefore, the variation in CGMA results was similar to the variations between independent CGH studies. These results suggest that CGMA profiling is able to predict regions of frequent chromosomal imbalance in HCC as well as CGH profiling. As only 4 of the 104 (4%) samples analyzed scored positive for HCV infection, we could not use this dataset to detect significant cytogenetic differences between HCV-infected verses HBV-infected individuals (data not shown).
Figure 2.
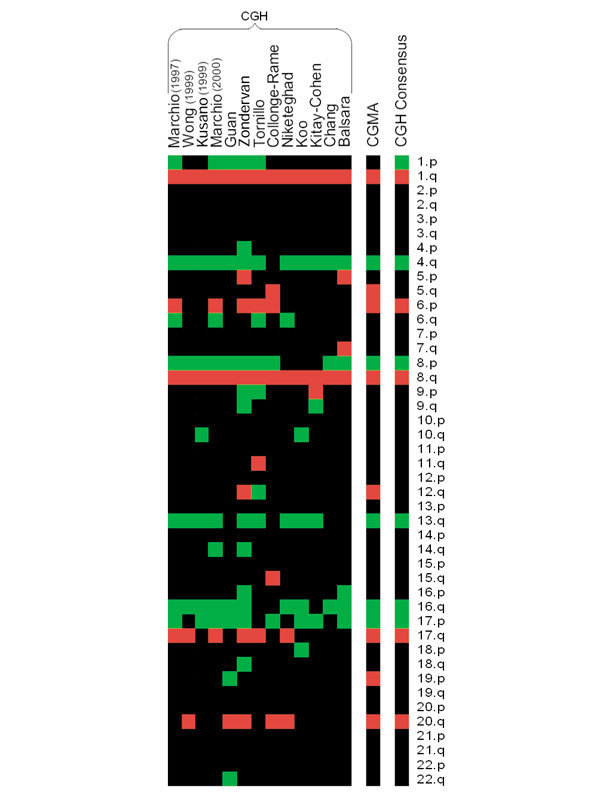
Thirteen hepatocellular carcinoma CGH studies compared to CGMA predictions. Frequent chromosomal aberrations detected by 13 CGH studies (see References) and by CGMA are displayed as a heat map. Green indicates regions of frequent chromosomal loss and red indicates regions of frequent chromosomal gain. At the right is a consensus profile of chromosomal regions that were altered in at least 35% of the CGH studies.
CGMA predictions of multifocal tumors
Included in the set of HCC gene-expression profiles were several cases in which multiple tumor nodules were removed from the same patient. In some cases the nodules had related gene-expression profiles (patients HK63, HK64, HK66) whereas in other cases tumors from the same patient had distinctive profiles (HK65, HK67, HK85) [33]. In particular, in patient HK67 the gene-expression profile from nodule HK67.1 was distinct from the expression profiles from nodules HK67.2 and HK67.3 [33]. Array CGH was used previously to determine the cytogenetic profiles of the tumor nodules from this patient [33]. Array CGH identified common cytogenetic abnormalities in patient HK67's tumors, including loss of chromosome 15q, an unusual gain of chromosome 19q, and loss of the centromeric region of chromosome 22. However, additional cytogenetic changes were found in tumors HK67.2 and HK67.3 that were not present in HK67.1. The cytogenetic profiling data coupled with the observation that HK67.2 and HK67.3 were both smaller in size and had an increased mitotic index, suggested that HK67.1 was the primary tumor and HK67.2 and HK67.3 were divergent HK67.1 subclones. To determine whether CGMA predictions agree with this monoclonal origin hypothesis, CGMA profiles of patient HK67's tumor nodules were isolated and organized by hierarchical clustering (Figure 3). CGMA also detected the common chromosome 19q gain and chromosome 15q loss in the HK67 tumors. CGMA did not identify a common loss on chromosome 22, however, CGMA identified other genetic aberrations (+8q, -16q and -19q) consistently found in the HK67 tumors. CGMA also identified additional aberrations (+2q, +5q, +12q) present in H67.2 and H67.3 that were not found in H67.1. Taken together, the CGMA data supports the hypothesis that the H67.2 and HK67.3 tumor nodules probably arose from HK67.1, but that additional distinct cytogenetic events had occurred in these nodules during tumor progression. In contrast, tumor nodules from patient HK64 have very similar gene-expression profiles and very similar cytogenetic profiles as predicted by CGMA, suggesting that these tumors have common origins and these nodules have not diverged significantly from the original lineage. In addition, tumor nodules from patient HK85 showed distinctive expression profiles and distinct HBV integration sites [33]. Similarly, the tumors from patient HK85 also show distinct CGMA-predicted cytogenetic profiles, reflecting the independent transforming mechanism (Figure 3).
Figure 3.

CGMA comparisons of multiple tumor nodules isolated from the same patient. The data were generated and presented as in Figure 1. Tumor sample names are presented as patient number with a tumor nodule suffix. CGMA profiles were arranged by hierarchical clustering (average linkage clustering) using the sign test z-statistic of each chromosomal region [38].
Identification of candidate genes in regions of frequent cytogenetic change
Frequent cytogenetic abnormalities suggest that tumor-modifying genes (oncogenes or tumor suppressors) may be driving selection for the amplification or deletion of these particular genetic regions [6,11,12,34,35,36]. An advantage of using CGMA profiling rather than traditional molecular genetic profiling is that access to gene-expression data is inherent in the analysis. CGMA allows cytogenetic analysis and the candidate gene approach to be performed with the same dataset. For example, the c-myc oncogene has been postulated to drive selection for frequent chromosome 8q amplification. Though c-myc is located on a region that both CGMA and CGH identify as frequently gained, c-myc's expression is increased more than twofold in less than 6% of the samples. In fact, in 52% of the HCC tissue samples, c-myc's expression is downregulated (Table 1). This implies that increased c-myc expression is not driving the selection for the amplification of chromosomal region 8q in these samples. In the small region of chromosome 8q presented in Table 1, two other genes (for squalene monooxygenase and pro2000) do show increased expression in a majority of HCC samples. Consistent with previous reports examining gene-expression levels in regions of cytogenetic change, expression levels for a large percentage of genes in this amplified region remain unchanged [3,5,8].
Table 1.
Identification of HCC candidate genes located within a region of chromosome 8q
| Transcript ID | Locus | Description | CGMA* | Measured† | Changed‡ |
| ENST00000276699 | 8q:127 | Unknown (protein for mgc:14128) | + | + | |
| ENST00000276704 | 8q:127 | cDNA flj14825 fis, clone ovarc1000781 | + | + | |
| ENST00000297857 | 8q:127 | Zinc finger homeobox protein zhx1 (zhx1 protein) | + | ||
| ENST00000287395 | 8q:127 | Pro2000 | + | + | + |
| ENST00000287394 | 8q:127 | Similar to riken cDNA 2610509g12 gene | + | ||
| ENST00000287387 | 8q:127 | Hypothetical 23.7 kDa protein | + | ||
| ENST00000287396 | 8q:127 | Similar to Homo sapiens F-box protein fbx25 (fbx25) | + | ||
| ENST00000262219 | 8q:127 | Annexin a13 (annexin XIII) | + | + | |
| ENST00000303616 | 8q:128 | + | |||
| ENST00000287400 | 8q:128 | + | + | ||
| ENST00000297861 | 8q:128 | + | |||
| ENST00000287402 | 8q:128 | + | |||
| ENST00000297632 | 8q:128 | + | |||
| ENST00000297630 | 8q:128 | cDNA FLJ20772 FIS, Clone COL06053 | + | ||
| ENST00000303545 | 8q:128 | + | |||
| ENST00000276692 | 8q:128 | Cda11 | + | ||
| ENST00000276689 | 8q:128 | NADH-ubiquinone oxidoreductase b22 subunit | + | ||
| ENST00000287414 | 8q:128 | Hypothetical protein kiaa0429 | + | + | |
| ENST00000265896 | 8q:129 | Squalene monooxygenase | + | + | + |
| ENST00000303443 | 8q:129 | + | |||
| ENST00000265897 | 8q:129 | + | + | ||
| ENST00000297614 | 8q:129 | + | |||
| ENST00000287437 | 8q:129 | cDNA flj32440 fis, clone skmus2001492 | + | ||
| ENST00000297644 | 8q:129 | G-protein-coupled receptor induced protein Gig2 | + | ||
| ENST00000259534 | 8q:129 | Contains a reverse transcriptase domain | + | ||
| ENST00000297628 | 8q:130 | + | |||
| ENST00000305022 | 8q:130 | + | |||
| ENST00000297624 | 8q:130 | + | |||
| ENST00000305005 | 8q:130 | + | |||
| ENST00000287390 | 8q:130 | Estradiol 17 beta dehydrogenase 4 EC 1.1.1 | + | ||
| ENST00000297858 | 8q:130 | Hypothetical 23.7 kDa protein | + | ||
| ENST00000287393 | 8q:130 | + | |||
| ENST00000297860 | 8q:130 | + | |||
| ENST00000304916 | 8q:131 | + | |||
| ENST00000304908 | 8q:132 | + | |||
| ENST00000259523 | 8q:132 | Myc proto-oncogene protein (c-Myc) | + | + | - |
| ENST00000297727 | 8q:132 | Contains a reverse transcriptase domain | + |
*Region of frequent CGMA-predicted cytogenetic change (+). †Expression was measured in the microarray experiment (+). ‡Expression increased (+) or decreased (-) at least twofold in at least 50% of tumor samples.
The set of genes that are consistently misregulated in regions of frequent cytogenetic change as predicted by CGMA are shown in Table 2. Platelet-derived growth factor receptor alpha is consistently downregulated in a region of frequent cytogenetic loss and this suggests that loss of a member of this receptor gene family is important in HCC progression. It has previously been reported that a transcript (PRLTS) with sequence similarity to the extracellular domain of platelet-derived growth factor receptor may also be a tumor suppressor for HCC [35]. In addition, consistently increased expression of the pituitary tumor transforming gene 1 oncogene (PTTG) is observed in these samples (Table 2). PTTG maps to chromosome 5q, a region that was identified as frequently changed by CGMA, but not identified in the majority of CGH profiling studies. PTTP overexpression in NIH 3T3 cells induces these cells to form tumors when injected into nude mice. Overexpression of this gene may result from frequent chromosomal amplification and may participate in HCC tumor progression.
Table 2.
Misregulated genes located in regions of frequent cytogenetic aberrations
| Ensembl ID* | Locus | Name | Fold change† |
| ENST00000271452 | 1q:165 | Hypothetical protein NUF2R | 10.4 |
| ENST00000243893 | 20q:44 | Ubiquitin-conjugating enzyme E2C | 8.5 |
| ENST00000216918 | 20q:30 | Chromosome 20 open reading frame 1 | 7.2 |
| ENST00000257535 | 5q:160 | Pituitary tumor-transforming 1 | 6.7 |
| ENST00000171466 | 1q:209 | HSPC150 protein similar to ubiquitin-conjugating enzyme | 5.6 |
| ENST00000287395 | 8q:122 | PRO2000 protein | 4.7 |
| ENST00000256686 | 12q:49 | Hypothetical protein MGC5576 | 4.6 |
| ENST00000229922 | 6p:18 | Adenylyl cyclase-associated protein 2 | 4.6 |
| ENST00000289943 | 1q:163 | Ribonucleotide reductase M2 polypeptide | 4.5 |
| ENST00000271474 | 1q:165 | Regulator of G-protein signalling 5 | 4.1 |
| ENST00000230056 | 6p:22 | Geminin | 3.7 |
| ENST00000263041 | 6p:56 | Glutathione S-transferase A4 | 3.5 |
| ENST00000245561 | 1q:156 | Chromosome 1 open reading frame 2 | 3.4 |
| ENST00000280896 | 4q:98 | Alcohol dehydrogenase 4 (class II), pi polypeptide | -42 |
| ENST00000245182 | 16q:57 | Metallothionein 1L | -33 |
| ENST00000225383 | 17q:64 | RNA helicase-related protein | -25 |
| ENST00000257600 | 12q:105 | deltex (Drosophila) homolog 1 | -16.9 |
| ENST00000239938 | 5q:140 | Early growth response 1 | -10 |
| ENST00000271629 | 1q:152 | Extracellular matrix protein 1 | -9.6 |
| ENST00000292494 | 8q:142 | Lymphocyte antigen 6 complex, locus E | -9.4 |
| ENST00000283088 | 8p:1 | KIAA0711 gene product | -7.7 |
| ENST00000250080 | 17p:8 | Sex hormone-binding globulin | -7 |
| ENST00000266671 | 12q:76 | Pleckstrin homology-like domain, family A, member 1 | -7 |
| ENST00000264005 | 16q:68 | Lecithin-cholesterol acyltransferase | -6.7 |
| ENST00000280188 | 4q:175 | Glycoprotein M6A | -6.6 |
| ENST00000262767 | 17q:80 | Baculoviral IAP repeat-containing 5 (survivin) | -6.6 |
| ENST00000225831 | 17q:32 | Small inducible cytokine A2 | -5.9 |
| ENST00000257290 | 4q:55 | Platelet-derived growth factor receptor, alpha polypeptide | -5.2 |
| ENST00000273912 | 4q:83 | Hypothetical protein | -5.2 |
| ENST00000219302 | 16q:2 | Non-metastatic cells 3, protein expressed in | -5 |
| ENST00000255389 | 17q:22 | Phosphatidylethanolamine N-methyltransferase | -4.9 |
| ENST00000218564 | 13q:95 | Dopachrome tautomerase | -4.8 |
| ENST00000219163 | 16q:20 | KIAA1504 protein | -3.7 |
| ENST00000253557 | 17q:31 | Cyclin-dependent kinase 5, regulatory subunit 1 (p35) | -3.6 |
*Genes whose expression changed at least twofold in 70% of tumor samples in the same relative direction as the cytogenetic change and are located in regions identified as cytogenetically abnomal by CGMA in at least 35% of samples. †Fold difference in tumor tissue gene expression relative to non-cancerous tissue.
CGMA prediction software
To assist in identifying regions of unidirectional gene-expression bias, we have constructed a web-based program that processes two-color gene-expression data and identifies genomic regions that contain gene-expression biases. The input for this program is a simple tab-delimited gene-expression matrix file consisting of columns for the probe sequence identifier, probe name, and gene-expression ratios. Because different microarray technologies use different identifiers to describe the microarray probe, the program translates probe sequence identifiers (ids) such as GenBank accession numbers and UniGene cluster ids to Ensembl transcript ids using precompiled sequence comparisons. After data analysis, a summary table is displayed showing chromosomal regions that show significant (α ≤ 0.05) unidirectional gene-expression bias highlighted in either red or green, indicating either increased or decreased expression biases, respectively. The program can also send several output files to the user via e-mail. These files include a summary report that contains the z-statistic for each chromosomal region (positive for upregulated regions and negative for downregulated regions) and a list of genes located in regions of frequent cytogenetic change. The program is available at [37].
Discussion
In this study we have used gene-expression profiling data to predict cytogenetic changes that frequently occur in HCC. Two landmark CGH analyses identified 12 different regions of frequent imbalance. However, one study found 8 regions and the other study found 11 [11,12]. Five of these 12 regions were not found in both experiments. CGMA successfully identified 10 of 12 regions previously distinguished by CGH. CGMA also detected three regions that have not been implicated by these CGH studies. On average however, 22% of genomic regions indentified in a particular HCC CGH study are not constantly identified in other studies. Therefore, the three inconsistent CGMA predictions (3 of 13; 23%) are comparable to the inconsistencies between independent CGH studies for HCC.
Three additional regions were identified by CGMA that were not identified by CGH. While these CGMA-predicted regions were near the 35% cutoff for detection, they could represent other regions of allelic imbalance yet to be detected by CGH. It is also possible that biological mechanisms other than cytogenetic change could influence expression in large genomic regions and produce regional gene-expression biases. Additional molecular genetic work will be required to resolve these differences.
If CGH data are not available for a particular cancer type, but gene-expression profiling data are, then CGMA could allow rapid prediction of the cytogenetic abnormalities that frequently occur within that cancer type. Moreover, in instances where gene-expression profiling reveals previously unrecognized cancer subtypes, CGMA could determine whether cytogenetic differences are responsible for these different subtypes. In cancer types where traditional cytogenetic profiling has already been carried out, CGMA predictions could serve to confirm existing cytogenetic profiling data and be used further to examine candidate genes whose expression changes most within a region of frequent cytogenetic change. In this way CGMA can be combined with the candidate gene approach to identify genes that are directly involved in tumor progression.
Conclusions
CGMA can be used to indicate chromosomal imbalances by detecting chromosomal regions that contain a disproportionate number of gene-expression values that change in the same relative direction. This analysis provides good evidence that CGMA is a practical alternative to CGH cytogenetic profiling when gene-expression profiling data is available.
Materials and methods
Normalization and filtering
Normalized, log-transformed gene-expression data for 104 HCC samples and 76 corresponding non-cancerous liver gene-expression profiles [13] were obtained from the Stanford Microarray Database [14]. Genes that were present in at least 75% of samples (10,037 genes) were used for further analysis. In this study, both the tumor samples and normal tissue samples were compared to a pooled cell-line reference [3]. To allow comparison of tumor gene-expression values to gene-expression values from surrounding non-cancerous tissue, new gene expression ratios, tumor verse normal (T/N), were estimated. To create the new ratios, log-transformed non-cancerous tissue ratios (N/U) were subtracted from the log-transformed HCC tissue ratios (T/U) for each gene such that log2(T/N) = log2(T/U) - log2(N/U). If an HCC sample did not have a corresponding non-cancerous sample, the global mean of the non-cancerous tissue gene-expression ratios were used.
CGMA analysis
To identify regional gene-expression biases, gene-expression values that map within a given chromosomal arm were collected and a sign test for a one-sample mean/median was used to determine whether a significant upward or downward bias was present in the expression values. An exception was made for chromosomes 13-16, 21 and 22. These chromosomes are more telocentric and therefore only their q-arms were tested for expression biases. Sequence comparisons were used to map microarray probe sequences (the sequences that are placed on the microarray) to predicted Ensembl transcripts (Ensembl version 6.28) [8]. Included in the Ensembl transcript annotations are chromosomal mapping locations at base-pair resolution. Redundancy introduced by replicate probes on the array and/or multiple probes mapping to the same gene were eliminated by averaging expression values that map to identical transcripts. Of the filtered set of 10,037 genes, 6,274 genes (63%) were unique and had associated genomic mapping information.
A sign test for the one-sample mean/median was used to determine whether a significant number of genes that map to a given chromosomal region change in a unidirectional manner. The algorithm scores a gene as up (+) or down (-) regulated if the magnitude of the expression value change is at least 1.8-fold. The sign test computes the probability, in the form of a z-statistic, of finding x upregulated genes out of n genes that change in a given genomic region. For simplicity, the z-statistic is computed using the normal approximation to the binomial distribution such that z = (2x - n)/sqrt(n). Genomic regions that contained less than 15 changed gene-expression values were excluded from further analysis. On average, 160 gene-expression values were located to each genomic region. The sign test z-statistic can be converted to a significance value (α) based on the two-tailed z-statistic (zα/2) critical values. For example, if z = 1.96, then α = 0.05; if z = 2.58 then α = 0.01, and so on.
Acknowledgments
Acknowledgements
Funding was through the generosity of the Van Andel Research Institute and Michigan Center for Biological Information (MCBI). We specially thank Ramsi Haddad for helpful discussion in the preparation of this manuscript.
References
- Kallioniemi A, Kallioniemi OP, Sudar D, Rutovitz D, Gray JW, Waldman F, Pinkel D. Comparative genomic hybridization for molecular cytogenetic analysis of solid tumors. Science. 1992;258:818–821. doi: 10.1126/science.1359641. [DOI] [PubMed] [Google Scholar]
- Virtaneva K, Wright FA, Tanner SM, Yuan B, Lemon WJ, Caligiuri MA, Bloomfield CD, de La Chapelle A, Krahe R. Expression profiling reveals fundamental biological differences in acute myeloid leukemia with isolated trisomy 8 and normal cytogenetics. Proc Natl Acad Sci USA. 2001;98:1124–1129. doi: 10.1073/pnas.98.3.1124. [DOI] [PMC free article] [PubMed] [Google Scholar]
- Phillips JL, Hayward SW, Wang Y, Vasselli J, Pavlovich C, Padilla-Nash H, Pezullo JR, Ghadimi BM, Grossfeld GD, Rivera A, et al. The consequences of chromosomal aneuploidy on gene expression profiles in a cell line model for prostate carcinogenesis. Cancer Res. 2001;61:8143–8149. [PubMed] [Google Scholar]
- Monni O, Barlund M, Mousses S, Kononen J, Sauter G, Heiskanen M, Paavola P, Avela K, Chen Y, Bittner ML, Kallioniemi A. Comprehensive copy number and gene expression profiling of the 17q23 amplicon in human breast cancer. Proc Natl Acad Sci USA. 2001;98:5711–5716. doi: 10.1073/pnas.091582298. [DOI] [PMC free article] [PubMed] [Google Scholar]
- Platzer P, Upender MB, Wilson K, Willis J, Lutterbaugh J, Nosrati A, Willson JK, Mack D, Ried T, Markowitz S. Silence of chromosomal amplifications in colon cancer. Cancer Res. 2002;62:1134–1138. [PubMed] [Google Scholar]
- Xu XR, Huang J, Xu ZG, Qian BZ, Zhu ZD, Yan Q, Cai T, Zhang X, Xiao HS, Qu J, et al. Insight into hepatocellular carcinogenesis at transcriptome level by comparing gene expression profiles of hepatocellular carcinoma with those of corresponding non-cancerous liver. Proc Natl Acad Sci USA. 2001;98:15089–15094. doi: 10.1073/pnas.241522398. [DOI] [PMC free article] [PubMed] [Google Scholar]
- Hughes TR, Roberts CJ, Dai H, Jones AR, Meyer MR, Slade D, Burchard J, Dow S, Ward TR, Kidd MJ, et al. Widespread aneuploidy revealed by DNA microarray expression profiling. Nat Genet. 2000;25:333–337. doi: 10.1038/77116. [DOI] [PubMed] [Google Scholar]
- Haddad R, Furge KA, Miller J, Schoumans J, Haab B, Teh B, Barr L, Webb C. Genomic profiling and cDNA microarray analysis of human colon adenocarcinoma and associated peritoneal metastasis reveals consistent cytogenetic and transcriptional aberrations associated with progression of multiple metastases. Appl Genomics Proteomics. 2002;1:123–134. [Google Scholar]
- Pisani P, Parkin DM, Ferlay J. Estimates of the worldwide mortality from eighteen major cancers in 1985. Implications for prevention and projections of future burden. Int J Cancer. 1993;55:891–903. doi: 10.1002/ijc.2910550604. [DOI] [PubMed] [Google Scholar]
- Parkin DM, Pisani P, Ferlay J. Estimates of the worldwide incidence of eighteen major cancers in 1985. Int J Cancer. 1993;54:594–606. doi: 10.1002/ijc.2910540413. [DOI] [PubMed] [Google Scholar]
- Marchio A, Meddeb M, Pineau P, Danglot G, Tiollais P, Bernheim A, Dejean A. Recurrent chromosomal abnormalities in hepatocellular carcinoma detected by comparative genomic hybridization. Genes Chromosomes Cancer. 1997;18:59–65. doi: 10.1002/(SICI)1098-2264(199701)18:1<59::AID-GCC7>3.0.CO;2-0. [DOI] [PubMed] [Google Scholar]
- Wong N, Lai P, Lee SW, Fan S, Pang E, Liew CT, Sheng Z, Lau JW, Johnson PJ. Assessment of genetic changes in hepatocellular carcinoma by comparative genomic hybridization analysis: relationship to disease stage, tumor size, and cirrhosis. Am J Pathol. 1999;154:37–43. doi: 10.1016/S0002-9440(10)65248-0. [DOI] [PMC free article] [PubMed] [Google Scholar]
- Chen X, Cheung ST, So S, Fan ST, Barry C, Higgins J, Lai K, Dudoit S, Ng I, Rijn M, et al. Gene expression patterns in human liver cancer. Mol Biol Cell. 2002;13:1929–1939. doi: 10.1091/mbc.02-02-0023.. [DOI] [PMC free article] [PubMed] [Google Scholar]
- Sherlock G, Hernandez-Boussard T, Kasarskis A, Binkley G, Matese JC, Dwight SS, Kaloper M, Weng S, Jin H, Ball CA, et al. The Stanford Microarray Database. Nucleic Acids Res. 2001;29:152–155. doi: 10.1093/nar/29.1.152. [DOI] [PMC free article] [PubMed] [Google Scholar]
- Wong N, Lai P, Pang E, Fung LF, Sheng Z, Wong V, Wang W, Hayashi Y, Perlman E, Yuna S, et al. Genomic aberrations in human hepatocellular carcinomas of differing etiologies. Clin Cancer Res. 2000;6:4000–4009. [PubMed] [Google Scholar]
- Kusano N, Shiraishi K, Kubo K, Oga A, Okita K, Sasaki K. Genetic aberrations detected by comparative genomic hybridization in hepatocellular carcinomas: their relationship to clinicopathological features. Hepatology. 1999;29:1858–18562. doi: 10.1002/hep.510290636. [DOI] [PubMed] [Google Scholar]
- Marchio A, Pineau P, Meddeb M, Terris B, Tiollais P, Bernheim A, Dejean A. Distinct chromosomal abnormality pattern in primary liver cancer of non-B, non-C patients. Oncogene. 2000;19:3733–3738. doi: 10.1038/sj.onc.1203713. [DOI] [PubMed] [Google Scholar]
- Guan XY, Fang Y, Sham JS, Kwong DL, Zhang Y, Liang Q, Li H, Zhou H, Trent JM. Recurrent chromosome alterations in hepatocellular carcinoma detected by comparative genomic hybridization. Genes Chromosomes Cancer. 2000;29:110–116. doi: 10.1002/1098-2264(2000)9999:9999<::AID-GCC1022>3.0.CO;2-V. [DOI] [PubMed] [Google Scholar]
- Zondervan PE, Wink J, Alers JC, Ijzermans JN, Schalm SW, de Man RA, van Dekken H. Molecular cytogenetic evaluation of virus-associated and non-viral hepatocellular carcinoma: analysis of 26 carcinomas and 12 concurrent dysplasias. J Pathol. 2000;192:207–215. doi: 10.1002/1096-9896(2000)9999:9999<::AID-PATH690>3.0.CO;2-#. [DOI] [PubMed] [Google Scholar]
- Tornillo L, Carafa V, Richter J, Sauter G, Moch H, Minola E, Gambacorta M, Bianchi L, Vecchione R, Terracciano LM. Marked genetic similarities between hepatitis B virus-positive and hepatitis C virus-positive hepatocellular carcinomas. J Pathol. 2000;192:307–312. doi: 10.1002/1096-9896(2000)9999:9999<::AID-PATH706>3.0.CO;2-O. [DOI] [PubMed] [Google Scholar]
- Collonge-Rame MA, Bresson-Hadni S, Koch S, Carbillet JP, Blagosklonova O, Mantion G, Miguet JP, Heyd B, Bresson JL. Pattern of chromosomal imbalances in non-B virus related hepatocellular carcinoma detected by comparative genomic hybridization. Cancer Genet Cytogenet. 2001;127:49–52. doi: 10.1016/S0165-4608(00)00421-0. [DOI] [PubMed] [Google Scholar]
- Niketeghad F, Decker HJ, Caselmann WH, Lund P, Geissler F, Dienes HP, Schirmacher P. Frequent genomic imbalances suggest commonly altered tumour genes in human hepatocarcinogenesis. Br J Cancer. 2001;85:697–704. doi: 10.1054/bjoc.2001.1963. [DOI] [PMC free article] [PubMed] [Google Scholar]
- Koo SH, Ihm CH, Kwon KC, Park JW, Kim JM, Kong G. Genetic alterations in hepatocellular carcinoma and intrahepatic cholangiocarcinoma. Cancer Genet Cytogenet. 2001;130:22–28. doi: 10.1016/S0165-4608(01)00460-5. [DOI] [PubMed] [Google Scholar]
- Kitay-Cohen Y, Amiel A, Ashur Y, Fejgin MD, Herishanu Y, Afanasyev F, Bomstein Y, Lishner M. Analysis of chromosomal aberrations in large hepatocellular carcinomas by comparative genomic hybridization. Cancer Genet Cytogenet. 2001;131:60–64. doi: 10.1016/S0165-4608(01)00492-7. [DOI] [PubMed] [Google Scholar]
- Chang J, Kim NG, Piao Z, Park C, Park KS, Paik YK, Lee WJ, Kim BR, Kim H. Assessment of chromosomal losses and gains in hepatocellular carcinoma. Cancer Lett. 2002;182:193–202. doi: 10.1016/S0304-3835(02)00083-6. [DOI] [PubMed] [Google Scholar]
- Balsara BR, Pei J, De Rienzo A, Simon D, Tosolini A, Lu YY, Shen FM, Fan X, Lin WY, Buetow KH, et al. Human hepatocellular carcinoma is characterized by a highly consistent pattern of genomic imbalances, including frequent loss of 16q23.1-24.1. Genes Chromosomes Cancer. 2001;30:245–253. doi: 10.1002/1098-2264(2000)9999:9999<::AID-GCC1083>3.0.CO;2-M. [DOI] [PubMed] [Google Scholar]
- Zimonjic DB, Keck CL, Thorgeirsson SS, Popescu NC. Novel recurrent genetic imbalances in human hepatocellular carcinoma cell lines identified by comparative genomic hybridization. Hepatology. 1999;29:1208–1214. doi: 10.1002/hep.510290410. [DOI] [PubMed] [Google Scholar]
- Harada T, Shiraishi K, Kusano N, Umayahara K, Kondoh S, Okita K, Sasaki K. Evaluation of the reliability of chromosomal imbalances detected by combined use of universal DNA amplification and comparative genomic hybridization. Jpn J Cancer Res. 2000;91:1119–1125. doi: 10.1111/j.1349-7006.2000.tb00894.x. [DOI] [PMC free article] [PubMed] [Google Scholar]
- Rao UN, Gollin SM, Beaves S, Cieply K, Nalesnik M, Michalopoulos GK. Comparative genomic hybridization of hepatocellular carcinoma: correlation with fluorescence in situ hybridization in paraffin-embedded tissue. Mol Diagn. 2001;6:27–37. doi: 10.1054/modi.2001.22021. [DOI] [PubMed] [Google Scholar]
- Takeo S, Arai H, Kusano N, Harada T, Furuya T, Kawauchi S, Oga A, Hirano T, Yoshida T, Okita K, Sasaki K. Examination of oncogene amplification by genomic DNA microarray in hepatocellular carcinomas: comparison with comparative genomic hybridization analysis. Cancer Genet Cytogenet. 2001;130:127–132. doi: 10.1016/S0165-4608(01)00479-4. [DOI] [PubMed] [Google Scholar]
- Kusano N, Okita K, Shirahashi H, Harada T, Shiraishi K, Oga A, Kawauchi S, Furuya T, Sasaki K. Chromosomal imbalances detected by comparative genomic hybridization are associated with outcome of patients with hepatocellular carcinoma. Cancer. 2002;94:746–751. doi: 10.1002/cncr.10254. [DOI] [PubMed] [Google Scholar]
- Yasui K, Arii S, Zhao C, Imoto I, Ueda M, Nagai H, Emi M, Inazawa J. TFDP1, CUL4A, and CDC16 identified as targets for amplification at 13q34 in hepatocellular carcinomas. Hepatology. 2002;35:1476–1484. doi: 10.1053/jhep.2002.33683. [DOI] [PubMed] [Google Scholar]
- Chen X, Cheung ST, So S, Fan ST, Barry C, Higgins J, Lai KM, Ji J, Dudoit S, Ng IO, et al. Gene expression patterns in human liver cancers. Mol Biol Cell. 2002;13:1929–1939. doi: 10.1091/mbc.02-02-0023.. [DOI] [PMC free article] [PubMed] [Google Scholar]
- Wong N, Lam WC, Lai PB, Pang E, Lau WY, Johnson PJ. Hypomethylation of chromosome 1 heterochromatin DNA correlates with q-arm copy gain in human hepatocellular carcinoma. Am J Pathol. 2001;159:465–471. doi: 10.1016/S0002-9440(10)61718-X. [DOI] [PMC free article] [PubMed] [Google Scholar]
- Fujiwara Y, Ohata H, Kuroki T, Koyama K, Tsuchiya E, Monden M, Nakamura Y. Isolation of a candidate tumor suppressor gene on chromosome 8p21.3-p22 that is homologous to an extracellular domain of the PDGF receptor beta gene. Oncogene. 1995;10:891–895. [PubMed] [Google Scholar]
- Kuroki T, Fujiwara Y, Nakamori S, Imaoka S, Kanematsu T, Nakamura Y. Evidence for the presence of two tumour-suppressor genes for hepatocellular carcinoma on chromosome 13q. Br J Cancer. 1995;72:383–385. doi: 10.1038/bjc.1995.342. [DOI] [PMC free article] [PubMed] [Google Scholar]
- CGMA - comparative analysis of microarray data http://www.vai.org/vari/downloads/development/clam-0.2.pl
- Eisen MB, Spellman PT, Brown PO, Botstein D. Cluster analysis and display of genome-wide expression patterns. Proc Natl Acad Sci USA. 1998;95:14863–14868. doi: 10.1073/pnas.95.25.14863. [DOI] [PMC free article] [PubMed] [Google Scholar]