Short abstract
A comparison of the newly completed, publicly available, genome sequence of the mouse with the prior sequence of the mouse from Celera Genomics Inc. and with the human genome provides a consensus view of the mouse and important insights into human gene numbers.
Abstract
Background
The availability of both mouse and human draft genomes has marked the beginning of a new era of comparative mammalian genomics. The two available mouse genome assemblies, from the public mouse genome sequencing consortium and Celera Genomics, were obtained using different clone libraries and different assembly methods.
Results
We present here a critical comparison of the two latest mouse genome assemblies. The utility of the combined genomes is further demonstrated by comparing them with the human 'golden path' and through a subsequent analysis of a resulting conserved sequence element (CSE) database, which allows us to identify over 6,000 potential novel genes and to derive independent estimates of the number of human protein-coding genes.
Conclusion
The Celera and public mouse assemblies differ in about 10% of the mouse genome. Each assembly has advantages over the other: Celera has higher accuracy in base-pairs and overall higher coverage of the genome; the public assembly, however, has higher sequence quality in some newly finished bacterial artifical chromosome clone (BAC) regions and the data are freely accessible. Perhaps most important, by combining both assemblies, we can get a better annotation of the human genome; in particular, we can obtain the most complete set of CSEs, one third of which are related to known genes and some others are related to other functional genomic regions. More than half the CSEs are of unknown function. From the CSEs, we estimate the total number of human protein-coding genes to be about 40,000. This searchable publicly available online CSEdb will expedite new discoveries through comparative genomics.
Background
In May 2002, two new mouse genome assemblies were released. One was the second version of the mouse genome assembly from Celera Genomics, created by using both private and public sequence information (denoted Cel2 [1]), and the other was the third version of the assembly from the public Mouse Genome Sequencing Consortium (denoted MGSCv3 [2]). Both these draft mouse genomes were obtained using a whole-genome shotgun (WGS) strategy, but using different mouse strains and distinct sequence-assembly algorithms.
Assembled by direct overlapping sequence fragments, Cel2 has about 260,000 contigs with a total size of 2.51 × 10⁹ base-pairs (2.51 gigabases (Gb)), whereas MGSCv3 has about 220,000 contigs and covers 2.475 Gb of the mouse genome. By incorporating pair-end sequence information, Cel2 and MGSCv3 contain around 47,000 scaffolds and around 43,000 supercontigs, respectively. After using physical map information, such as sequence-tagged sites (STSs), 20 mouse chromosomes were constructed together with an 'unassigned' chromosome called chromosome UA in Cel2 and chromosome Un in MGSCv3. The total sizes of these chromosomes in Cel2 and MGSCv3 are about 2.62 Gb and 2.59 Gb, respectively. The gaps in these chromosomes occupy 4.1% of genome in Cel2 and 4.5% in MGSCv3. The average size of the contigs, gaps and scaffolds/supercontigs of both the genome assemblies are comparable (data not shown).
Results
Comparison of the two mouse assemblies
To compare the coverage and accuracy of Cel2 and MGSCv3, we used BLAT [3] to compare 8,434 mouse mRNA sequences in the RefSeq database of the National Center for Biotechnology Information (NCBI) ([4], 12 April, 2002) with these assemblies. As a basis for comparison, we determined the numbers of mRNAs that have more than 50%, 80%, 90% and 97% of base-pairs that match in both Cel2 and MGSCv3, in one assembly only, or in neither assembly (Figure 1). Although most mRNAs could be matched with both assemblies, there were some mRNAs that could be matched well in only one assembly. We also found that more mRNAs had higher percentage matches in Cel2 than in MGSCv3 (that is, > 97%). As a further test, we especially investigated how well long mRNAs can be matched to each assembly. The 10 longest mRNA sequences are all matched well with both assemblies, except for the piccolo (Pico) gene (coding for a presynaptic cytomatrix protein): paradoxically, it is matched in chromosome 12 in Cel2 and in chromosome 5 in MGSCv3.
Figure 1.
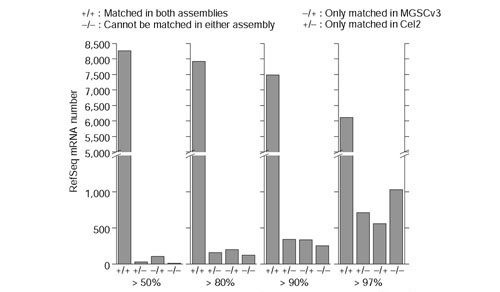
Distribution of 8,434 mouse RefSeq mRNAs matched in Cel2 and MGSCv3. Four criteria, that more than 50%, 80%, 90% and 97% of base-pairs in one mRNA are matched, are used to count the number of mRNAs matched in: both assemblies; only in Cel2; only in MGSCv3; in neither of them. + indicates this mRNA is matched. - indicates this mRNA in MGSCv3 or Cel2 is not matched under the given threshold.
mRNA sequences can only be used to check the quality of assembly in the gene regions, and, for this, the accuracy can be determined only within exons. Therefore, we also used 39 newly finished mouse bacterial artificial chromosomes (BACs) with known chromosome locations (data from 14 May to 23 May 2002 in NCBI daily updates) to test the coverage and accuracy of long continuous regions. Although all BACs matched at the correct chromosomal locations in both assemblies, MGSCv3 exhibited higher matching quality in these BAC regions. In MGSCv3, only two BACs had less than 90% coverage: AC087780 (74% in chromosome 1) and AC099773 (84% in chromosome 5) while four BACs in Cel2 had less than 90% coverage: AC090479 (11% in chromosome 18), AC023789 (85% in chromosome 4), AC021063 (86% in chromosome 18), and AC087115 (89% in chromosome 8). For the BAC AC090479, which has only 11% coverage in Cel2, many of the matching genomic DNA fragments are in the UA chromosome at present. This is probably due to the fact that the BAC sequencing information that Cel2 used was released before July 2001. Therefore, MGSCv3 could have a better assembly in those regions where newer BAC information had been incorporated. Interestingly, these two assemblies show some complementary features. For example, BAC AC090479 was only 11% covered in Cel2 but 99% covered by chromosome 18 in MGSCv3, whereas BAC AC087780 had 74% coverage in MGSCv3 but 94% coverage in chromosome 1 in Cel2.
As well as using different assembly methods, Cel2 and MGSCv3 also used different mouse strains. This may also cause some slight differences when comparing mRNAs or BACs from different strains with Cel2 and MGSCv3.
From the above analyses of mouse mRNAs and BACs, we find some features that are complementary between MGSCv3 and Cel2. This complementarity partly originates from the fact that MGSCv3 used more BAC sequencing information, which produced higher sequence quality and coverage in the regions covered by sequenced BACs. However, the mRNA test indicates that the sequences in Cel2 are more accurate than sequences in MGSCv3 in gene regions. Thus, it is highly recommended that the two mouse genome assemblies be used in an integrated fashion rather than separately.
Comparison between the human genome golden path and the two mouse assemblies
The human genome project is well into the finishing stage [5], providing the opportunity to compare the mouse and human genomes. Comparing the human genome with the mouse genome can greatly help our understanding of both genomes. We used the BLASTN program [6] to compare the December 2001 golden path freeze of the human genome, which is also NCBI build 28, with each mouse assembly. We first used RepeatMasker (A. Smit, unpublished work, and [7]), to mask the repeats in all the three genomes. With a fixed expect value (E-value) of 1.0e-1 we found 1,860,560 conserved sequence elements (CSEs) between the human and MGSCv3 genome assemblies and 1,737,297 CSEs between the human and Cel2. Each CSE includes one human genome segment and one matched mouse genome segment. The simplest cases, which we call 'univalent CSEs', are matches between unique human and mouse regions. However, there are some cases, which we call 'multivalent CSEs', where more than one mouse region matches the same human region, or conversely, more than one human region matches a mouse region. For all multivalent CSEs, we chose the longest matches, and added them to univalent CSEs to make a new set, called 'primary CSE set'.
Table 1 shows the numbers of CSEs and the base-pairs covered in the human or mouse genomes in the following categories: all CSEs; human primary CSEs; mouse primary CSEs; and univalent CSEs. We can see that the CSEs from the Celera mouse assembly cover slightly more of the human genome than CSEs from MGSCv3 assembly. Although the numbers of univalent CSEs from two mouse assemblies are almost the same (about 415,000), 31,000 univalent CSEs could be identified in the human genome from MGSCv3 alone, while 31,194 were identified from Cel2. This indicates again that the majority of univalent CSEs are common between Cel2 and MGSCv3, yet some differences remain between these two assemblies. We then constructed an overall CSE set, which includes all CSEs found from both MGSCv3 and Cel2 (named as aCSE) and its human primary set (named as aCSE-hp). Figure 2a illustrates the length distribution of CSEs in set aCSE and aCSE-hp, and Figure 2b shows the plot of the percentage identity versus length of CSEs in set aCSE. Most of the CSEs show 80-95% identity between the human and mouse genomes. Very short CSEs overlap each other more frequently in the human or mouse genomes than long CSEs because they are more likely to happen by chance. At the E < 1.0e-1 level, the average length of CSEs is 109 bp in the aCSE set and 151 bp in the aCSE-hp set. The shortest one is only 26 bp, and the longest one is 6,735 bp, which covers the human spastic ataxia of Charlevoix-Saguenay (sacsin) gene.
Table 1.
Statistics of CSE numbers and base-pairs covered
| MGSCv3 | Cel2 | |
| Number of CSEs | 1,860,560 | 1,737,297 |
| Number of human primary CSEs | 552,900 | 561,534 |
| Number of mouse primary CSEs | 543,178 | 543,658 |
| Human genome covered by primary CSEs (bp) | 85,386,963 | 87,556,309 |
| Mouse genome covered by primary CSEs (bp) | 82,812,007 | 84,214,212 |
| Number of human-mouse univalent CSEs | 415,079 | 415,168 |
| Human mouse univalent CSEs only found in one mouse assembly, based on the human location | 31,000 | 31,194 |
| MGSCv3 + Cel2 | ||
| Number of human primary CSEs | 590,632 | |
| Human genome covered by primary CSEs (bps) | 89,919,696 | |
Figure 2.
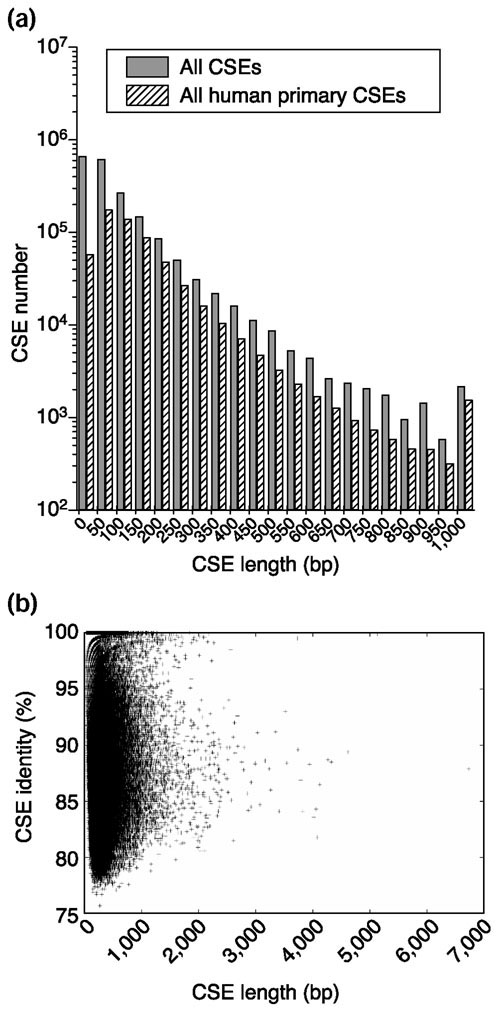
Length distribution and percent identity of CSEs. (a) Length distributions for all CSEs and all human primary CSEs. CSEs that are longer than 1,000 bp are binned together. (b) Plot of percent identity versus length of CSEs.
We compared the human genome regions covered by CSEs from Cel2 and MGSCv3 and found that about 90 megabases (Mb) (approximately 3% of the whole human genome) are covered by all CSEs. CSEs from Cel2 and MGSCv3 covered 97% and 95% of this 90-Mb region, respectively. Among them, 92% of the base-pairs were covered by both CSE sets. Figure 3 shows the distribution of CSE locations in each human chromosome. These results also suggest that the Celera mouse assembly has slightly higher coverage than MGSCv3 in the whole mouse genome.
Figure 3.
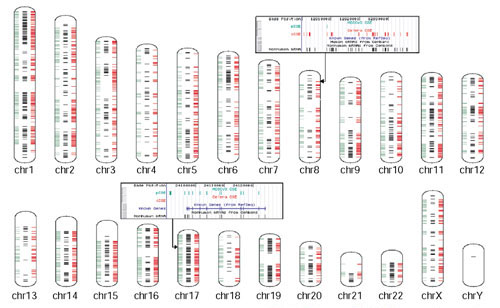
Distribution of the human genome location density of Ensembl genes and CSEs from Cel2 and MGSCv3. Every 1-Mb region that has more than 1.7% base-pairs in the exon regions of an Ensembl gene is displayed as a black bar in the middle. A 1-Mb region is displayed as a bar if its CSE coverage is higher than 3%. The left-hand bars show the CSEs from MGSCv3 (green) and the right-hand bars show the CSEs from Cel2 (red). (Ensembl genes' information was obtained from [12]). As examples, the UCSC human genome tracks combined with our CSEs tracks are displayed in two rectangles with arrows pointing to one region where many CSEs found from Cel2 are located, and another region where many CSEs found only from MGSCv3 are located.
Cross-species sequence conservation information is widely used in current gene-prediction tools, such as TwinScan [8], SGP-1 [9] and SLAM (L. Pachter, personal communication). Lack of conservation information may decrease the prediction accuracy of these methods. The inconsistency of CSE locations in the human genome from the two different mouse assemblies suggests that, for reliability, it is advisable to use both assemblies to search genes and to perform other functional analyses.
Functional analysis of CSEs
Sequence conservation is usually related to functional regions of the genome, such as those comprising protein-coding genes, RNA genes and promoter regions. Using more complete conservation information, it may be possible to discover additional functional regions of the genome. In this section, we describe some salient features of the human CSEs.
CSEs in the human RefSeq genes
We used the human RefSeq gene annotation from golden path December 2001 database to explore further the possible functional implications of these CSEs. The locations of CSEs in the human genome were compared with a total of 14,653 RefSeq gene structures. We found that 94.9% of these genes and 81% of all exons (139,694) are covered by the CSEs in aCSE-hp (data not shown). These CSEs also cover 57.2% of the base-pairs in the exon regions. Coding regions (CDS) have a higher degree of CSE coverage (77.7% at the nucleotide level) than 5' untranslated regions (5' UTRs) (24%) and 3' UTRs (18%). In addition, 35.3% of the CSEs are located within RefSeq gene regions. Of these, 19.3% are exon-related, 14.8% are intron-related, and 1.2% are 'alternative exon'-related (that is, the location of the CSE in the human genome is in an intron region according to one mRNA transcript, but in an exon region according to another mRNA transcript). Here, the relationship between a CSE and an exon or an intron is defined by the location of the middle point of the CSE. Clearly, most of the RefSeq genes have at least one CSE hit.
CSEs in the known and predicted members of ETS-domain protein family
To determine whether CSEs are found within regions encoding conserved protein motifs, we examined the relationship of CSE locations and the protein-domain of a large gene family (the ETS-domain family) found by our GeneFamilyScan software (GFScan [10], Table 2). For all known human members in this gene family, only one (TEL2) has no CSE hit. Additionally, all five newly identified potential human ETS-domain genes have CSE hits in the corresponding motif regions. Remarkably, for the novel gene corresponding to Ensembl [11] predicted transcript ENST00000299272, we found a mouse ETS-domain gene (Spi-C), which shares 67% protein sequence identity with the human predicted transcript. Hence, the existence of CSEs within a protein-domain region can help to find other related novel genes.
Table 2.
ETS-domain genes' location and related CSEs
| Human genome location | Human gene | Related CSEs | Mouse gene |
| chr1:210860086-210860134 | ELK4 | Chr1c_0005362 | Sap1a |
| chr1:156788585-156790244 | ETV3/PEP1 | Chr1c_0104026 | Pe1 |
| Chr1c_0103962 | |||
| chr1:156753621-156753914 | ENST00000239810* | Chr1c_0104167 | - |
| Chr1c_0103959 | |||
| chr2:218742679-218742727 | FEV | Chr2c_0009719 | mPet-1 |
| chr6:46207850-46207898 | TEL2 | - | - |
| chr7:6597152-6597200 | ETV1 | Chr7c_0058663 | Etv-1/Er81 |
| chr7:64780186-64780234 | ENS00000297422* | Chr7c_0032792 | Gabp |
| chr11:134075280-134075328 | ETS1 | Chr11c_0058817 | Ets-1 |
| chr11:133727180-133727228 | FLI1 | Chr11c_0058489 | Fli-1 |
| chr11:34407740-34407788 | - | - | - |
| chr12:12284048-12284096 | ETV6 | Chr12c_0058396 | ETV6/Tel |
| chr12:12396310-12396358 | C12000289† | Chr12c_0058397 | - |
| chr12:97911097-97911145 | ELK3 | Chr12c_0031833 | Elk-3 |
| chr12:104562931-104562979 | ENST00000299272* | Chr12c_0038845 | Spi-C |
| chr19:51415380-51415428 | ETV2/ER71 | Chr19c_0149961 | Etsrp71 |
| chr19:67794768-67794816 | SPIB | Chr19c_0199661 | Spi-B |
| chr19:58654497-58654933 | ERF | Chr19c_0189501 | Erf |
| Chr19c_0189572 | |||
| chr19:58976760-58977199 | ENST00000270081* | Chr19c_0189538 | - |
| Chr19c_0189495 | |||
| chr21:36771224-36771272 | ETS2 | Chr21c_0005326 | Ets-2 |
| chr21:23715872-23720136 | GABPA | Chr21c_0000791 | Gabp |
| Chr21c_0000793 | |||
| chr21:36332246-36332294 | ERG | Chr21c_0005320 | Erg |
| chrX:45072030-45072078 | ELK1 | chrXc_0011713 | Elk-1 |
CSEs in intronic regions of known genes
To investigate the possible function of CSEs in intronic regions, we examined a subset of intronic CSEs. The ten longest intronic CSEs (see Supplementary Table 1 in the additional data file) within known human genes, including RefSeq genes and other genes with known mRNA sequences, were further examined and compared with the human golden path annotation [12]. Our analysis indicates that many long intron-related CSEs may actually be alternative exons. For example, we found that nine of these ten CSEs have spliced or unspliced human expressed sequence tag (EST) matches. Some of them also shared similarity with mouse mRNAs. There was only one CSE for which we could not get any functional information (CSE ID is chr1c_0024330, it is located at human chr1:246028930-246030945 in an intron region of a novel gene with mRNA accession number AL122093.)
CSEs, genes and transcriptional activity in human chromosome 22
To investigate whether the density of CSEs correlates with gene density and resulting transcriptional activity, we chose to examine chromosome 22, a well-finished and annotated chromosome, more closely. We calculated the density of base-pairs in the CSEs and Sanger Center annotated exons in chromosome 22 separately. The distributions of these densities are consistent across the length of the whole chromosome (Figure 4), except one region around 21-22 Mb. The average length of the exons in this 1-Mb region is 247 bp, which is shorter than the average length of all exons in chromosome 22 (302 bp). Although the average CSE length is shorter than 247 bp, some very short conserved regions still cannot be covered by CSEs, which causes the difference of the base-pair densities between CSEs and exons in this region. To further investigate this discrepancy, we used data collected by Affymetrix. From Affymetrix oligonucleotide array data [13], we obtained the density of the base-pairs around all positive probes in this chromosome. The density distribution of base-pairs in CSEs is more consistent with that in exons than that in oligonucleotide probe regions for this chromosome. This indicates that the Affymetrix oligonucleotide array detected more transcripts that are less conserved compared to the known exons, especially those transcripts toward the end of the chromosome.
Figure 4.
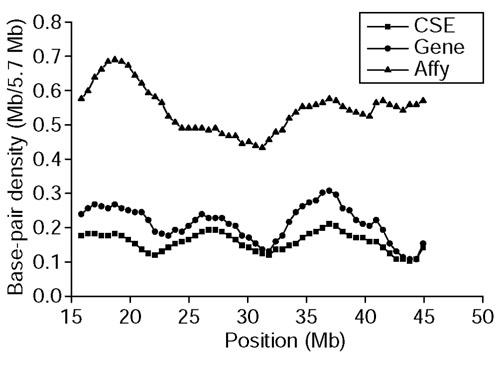
Density distribution of base-pairs in CSEs, Sanger Center annotated exons and positive oligonucleotide probes in human chromosome 22. Density is calculated by counting the number of base-pairs in CSEs, exons and positive probes within a 57-kb window.
CSEs between known genes
Many long CSEs that are located in the intergenic regions between the known human genes were also scrutinized against ESTs and genes in other species. Although two of the five longest intergenic region CSEs were determined to be pseudogenes, two others appeared to be gene-related. CSE chr9p_0053719 is located in the 17707984-17709816 region of human chromosome 9. In the corresponding mouse region, transcript mCT3199 was predicted in the Celera database and a zinc-finger protein basonuclin-like gene (XM_143875) was also annotated by NCBI. CSE chr6p_0056662 (human location: chr6: 51140014-51141656) also overlaps one annotated novel gene, dJ402H5.2 in NCBI. Of these five CSEs, only CSE chr6p_0077382 does not have any annotation information. However, we found a genomic region in the rat genome that matches the human location (chr6:105053471-105055327) with 94% identity, which is not much lower than 95% within this CSE. Even in the well-finished and annotated human chromosomes, such as 20 and 22, some long intergenic region CSEs can still be found. Some of them are pseudogenes, while others appear to be related to novel genes. For example, in the human genomic region around CSE chr20p_0001494, a novel gene is predicted by GenomeScan [14] in NCBI (XM_104356), but is not otherwise confirmed. In the whole human genome, we found 6,259 NCBI-annotated novel human gene models that are covered by at least one CSE. Although we do not know the clear functions for these novel gene-related CSEs, they obviously deserve immediate experimental verification.
CSEs in promoter regions
It is probable that many CSEs located in promoter regions contain cis-regulatory elements. For example, transcription factor 8 (TCF8) can repress interleukin 2 (IL2) expression by binding to a negative regulatory element 100 bp upstream of the IL2 transcription start site [15]. We found that this promoter region is hit by our CSE chr4p_0043880 (its human location is chr4: 124039778-124040406). In a separate study, we are systematically investigating how to incorporate CSE information into promoter analysis.
CSEs in RNA genes
We found that 439 CSEs are related to non-translated RNA genes (from golden path April 2001 human genome annotation), such as ribosomal RNA, microRNA, small nucleolar RNA (snoRNA), and the like. For example, Z30 small nucleolar RNA [16] (accession number: AJ007733), located at human chr17: 34803858-34803954, is a methylation guide molecule for U6 snRNA. The whole genomic DNA region of Z30 is hit by our CSE chr17p_0010358 (human location: chr17: 34803845-34803959). By checking the corresponding mouse genome location of this CSE, we discovered the corresponding mouse Z30 gene (accession number: AJ007734). Therefore, genomic sequence conservation between different species can effectively facilitate the discovery of RNA genes.
CSEs and human genomic segment duplication
Multivalent CSEs can be used to find genomic segment duplication because these CSEs that hit once in one genome hit multiple times in the other genome. We used CSEs of length greater than 100 bp found by BLAST with E value < 1.0e-10 from MGSCv3 to analyze human genomic sequence duplication. As an example, we used one type of multivalent CSEs, in which a mouse region can match two separate human regions, to find doublet duplications in the human genome relative to the mouse genome. The human and mouse regions in some of these type of CSEs are located in the genomes with the same order. In this case, we can link them together and collect a pair of human genome segments and one mouse genome segment. With length constraint of these segments (> 10 kb), we found 451 pairs of human segments and their corresponding 451 segments in the 19 mouse autosomal chromosomes. We defined a pair of human segments as doublet duplication when the segment length difference is less than 10% of the shorter one. For all 451 doublet duplications, the identity between two human segments varies from 37% to 100%, whereas the length of segments varies from 10 Kb to 257 Kb (the data are available in our ftp server [17] and Supplementary Table 2 in the additional data file). Because there may have been much artificial duplication in the human working draft sequences due to misassembly, we checked those 451 human duplication segments against the newest human genome assembly (NCBI human build 30), which has only become available very recently. We found that only 79 duplications exist according to this updated assembly, as shown in Figure 5. As the known repeats in both genomes were masked before we constructed CSEs, these doublet duplications in the human genome may point to either true expansion regions or further assembly errors. As we have limited the length of the duplication regions to longer than 10 kb, and the length difference between two duplicated regions to less than 10%, these pairs of human regions look more like direct duplications of genomic DNA than a pseudogene. But their true identity may require experimental verification. We are trying to use CSEs to find more expansion or contraction regions in the human and mouse genomes.
Figure 5.
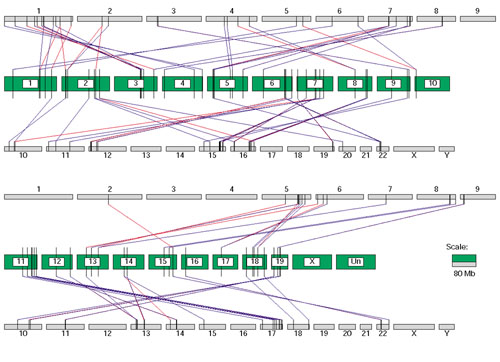
The human doublet duplications and their matched mouse segments. Each green bar is a mouse chromosome, labeled with the chromosome name. The human chromosomes are shown as gray bars with the name above or under the bars. Each black vertical bar represents a mouse or human segment. The red or blue line between two vertical bars means a match relationship, where red and green mean that separate human segments match the same mouse segment. The horizontal length of the bar is proportional to the sequence length. Only segments related to the mouse autosomal chromosomes and the human duplications found in NCBI human genome build 30 are shown.
Although many CSEs are related to different functional regions in the genome, more than half of all CSEs are still mysterious. Experimental approaches and further theoretical characterizations are needed to discover the function of these conserved elements. All the CSEs and their available functional information are accessible and searchable in our CSEdb, which may be accessed through the genome browser link at [18].
Human gene number estimation by human-mouse comparison
We analyzed the correlation between CSE number and chromosome length. We found that they are not correlated very well (see Supplementary Figure 1 in the additional data file). From Figure 3, we found that most human regions with high Ensembl gene density also have high CSE density, although some regions may lack this kind of correlation, probably because of the divergence between the human and mouse. Together with the statistics of the RefSeq genes, in which most RefSeq genes have at least one CSE hit (see RefSeq data above), we believe that it is more meaningful and accurate to estimate protein-coding gene number from CSEs instead of from chromosome length. Because human chromosomes 20, 21 and 22 have been finished and annotated, we used the number of CSEs and protein-coding genes in these three chromosomes and the number of total CSEs to estimate: first, the number of the human and mouse homologous genes that share at least one CSE; and second, the total number of the human genes. By our estimates, the total number of human protein-coding genes is 37,000, of which 30,000 are related to mouse through a CSE. The estimated number of all human genes at different E-values is almost constant. The estimated homologous gene numbers increased with increasing E-value as expected (Figure 6).
Figure 6.
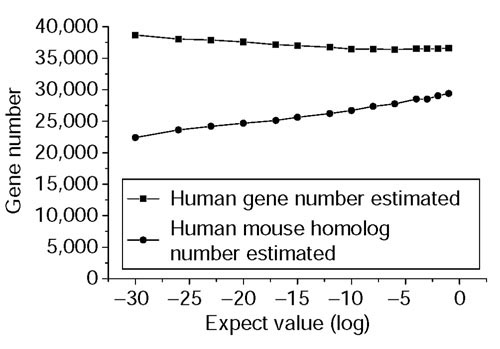
Estimated gene number at different E-values. The upper curve displays the estimated numbers of all human genes, and the lower curve shows the numbers of the human-mouse homologs defined by shared CSEs.
Materials and methods
BLAT search
BLAT was used to match all mouse mRNA sequences and BAC sequences to both mouse assemblies with the default parameter setting. As the chromosome information is known for each BAC, we only calculated the coverage of BAC by the corresponding chromosome in order to check the accuracy of the assembly.
BLAST search
The BLAST comparison of the human golden path with Cel2 and MGSCv3 mouse genome assemblies were finished on an 80-CPU LINUX cluster in 4 days. NCBI BLAST was used with different E-values as the threshold (1.0e-10, 1.0e-4, and 1.0e-1) in this project. We found that 1.0e-1 appeared to be the best parameter for covering both gene-related and non-coding CSEs, because the average length of exons is about 150 bp and that of regulatory elements is much shorter. Another reason to choose 1.0e-1 is that we can use only those more highly significant CSEs if needed. The CSE number is super-exponentially decreased when increasing the significance from 1.0e-1 to 1.0e-10. The other options of BLAST use -b 50000 -v 50000 - U T.
Density of base-pairs in CSEs
The density of base-pairs in CSEs or Sanger Center annotated exons is calculated by counting the number of base-pairs in CSEs or exons within every 5.7-Mb window. This 5.7-Mb window is slided 57 kb in each step. Oligonucleotide array data was downloaded from the University of California Santa Cruz golden path server. The probe whose score is higher than 80 in at least one cell line is regarded as the positive probe. The following 35 base-pairs of the positive probes are counted to calculate the base-pair density in a 57-kb window [13].
Pseudogene test
To test whether a human region in a CSE encoded a pseudogene, we used the human genomic DNA region of this CSE to search the whole human genome with BLAT. If this continuous human region contained internal splice sites like a cDNA, we regarded this region as a potential pseudogene location.
Gene number estimation
Estimation of the number of human protein-coding genes and of human-mouse homologs is based on two assumptions. As the only training data at present are three finished human chromosomes, (chromosomes 20, 21 and 22), the first assumption is that the percentage of the gene-related CSEs in three finished chromosomes is approximately the same as the percentage in the whole genome. The second assumption is that the average CSE number per gene calculated in the three finished chromosomes is approximately the same as in the whole genome. Under these assumptions, we could estimate the total number of human-mouse homologous genes (nGENEhm) from the total number of CSEs in a CSE-hp (nCSEa-hp) set, the number of human primary CSEs in three finished chromosomes (nCSE3chr-hp) and the total genes in these three chromosomes covered by CSEs (nGENEc):
![]()
And the total number of human genes ( ) could be estimated by:
![]()
where nGENE3chr is the total number of annotated genes in chromosomes 20, 21 and 22, which is equal to 1,595 (the overlapping genes were only counted once and non-coding genes are not counted) from the present data. Of these, 1,291 are covered by CSEs and the total number of human primary CSEs within these three chromosomes is 25,578. Thus, we obtain the total number of human-mouse homologous genes as 590,632 × (1,291/25,578) = 29,811 at E-values less than 1.0e-1, and the total number of human genes is therefore estimated as 590,632 × (1,595/25,578) = 36,830.
We also tried to use information from these three chromosomes to estimate gene number separately, and got the mean number 35,322 with a standard deviation of 9,705.
Availability
Data concerning 6,259 novel genes are available from [19] and from the CSEdb browser at [18]. The human duplicated segments data is available from [20].
Additional data files
Supplementary tables listing the 10 longest intron-region CSEs and 451 mouse genomic segments and their matched human segment pairs, and a figure showing the correlation between portions of CSEs and chromosome length of one chromosome in the whole genome are available as additional data file with the online version of this paper.
Supplementary Material
Supplementary tables listing the 10 longest intron-region CSEs and 451 mouse genomic segments and their matched human segment pairs, and a figure showing the correlation between portions of CSEs and chromosome length of one chromosome in the whole genome
Acknowledgments
Acknowledgements
We thank Celera Genomics for producing and providing the access to the Cel2 data, and the Public Mouse Consortium for producing and NCBI for providing the access to the MGSCv3 data. We thank Jim Kent for providing BLAT, and L. Stein, G. Hannon, M. Wigler and E. Lander for critical reading of the manuscript. We thank Michelle Carmell for helping to proofread. Rackable kindly provided us with a powerful Linux cluster and Vsevolod (Simon) Ilyushchenko gave superb system support. We also thank members of the Zhang lab for numerous discussions. This work was supported by NIH grants.
References
- Celera Genomics http://www.celera.com
- Ensembl mouse genome server http://mouse.ensembl.org
- Kent WJ. BLAT-The BLAST-like alignment tool. Genome Res. 2002;12:656–664. doi: 10.1101/gr.229202. [DOI] [PMC free article] [PubMed] [Google Scholar]
- NCBI RefSeq database website http://www.ncbi.nlm.nih.gov/LocusLink/refseq.html
- International Human Genome Sequencing Consortium Initial sequencing and analysis of the human genome. Nature. 2001;409:860–921. doi: 10.1038/35057062. [DOI] [PubMed] [Google Scholar]
- Altschul SF, Gish W, Miller W, Myers EW, Lipman DJ. Basic local alignment search tool. J Mol Biol. 1990;215:403–410. doi: 10.1016/S0022-2836(05)80360-2. [DOI] [PubMed] [Google Scholar]
- Repeatmasker http://repeatmasker.genome.washington.edu
- Korf I, Flicek P, Duan D, Brent MR. Integrating genomic homology into gene structure prediction. Bioinformatics. 2001;17:S140–S148. doi: 10.1093/bioinformatics/17.suppl_1.s140. [DOI] [PubMed] [Google Scholar]
- Wiehe T, Gebauer-Jung S, Mitchell-Olds T, Guigo R. SGP-1: prediction and validation of homologous genes based on sequence alignments. Genome Res. 2001;11:1574–1583. doi: 10.1101/gr.177401. [DOI] [PMC free article] [PubMed] [Google Scholar]
- Xuan ZY, McCombie WR, Zhang MQ. GFScan: a gene family search tool at genomic DNA sequence level. Genome Res. 2002;12:1142–1149. doi: 10.1101/gr.220102. [DOI] [PMC free article] [PubMed] [Google Scholar]
- Ensembl http://www.ensembl.org
- UCSC genome bioinformatics http://genome.ucsc.edu
- Kapranov P, Cawley SE, Drenkow J, Bekiranov S, Strausberg RL, Fodor SP, Gingeras TR. Large-scale transcriptional activity in chromosomes 21 and 22. Science. 2002;296:916–919. doi: 10.1126/science.1068597. [DOI] [PubMed] [Google Scholar]
- Yeh RF, Lim LP, Burge CB. Computational inference of homologous gene structures in the human genome. Genome Res. 2001;11:803–816. doi: 10.1101/gr.175701. [DOI] [PMC free article] [PubMed] [Google Scholar]
- Williams TM, Moolten D, Burlein J, Romano J, Bhaerman R, Godillot A, Mellon M, Rauscher FJ, 3rd, Kant JA. Identification of a zinc finger protein that inhibits IL-2 gene expression. Science. 1991;254:1791–1794. doi: 10.1126/science.1840704. [DOI] [PubMed] [Google Scholar]
- Zhou H, Chen YQ, Du YP, Qu LH. The Schizosaccharomyces pombe mgU6-47 gene is required for 2'-O-methylation of U6 snRNA at A41. Nucleic Acids Res. 2002;30:894–902. doi: 10.1093/nar/30.4.894. [DOI] [PMC free article] [PubMed] [Google Scholar]
- M Zhang lab ftp server ftp://cshl.org/pub/science/mzhanglab
- Human versus mouse conserved sequence elements (Version 2002) http://gene.cshl.org/cgi-bin/gbrowse?source=cse
- M Zhang lab ftp server: novel gene CSE ftp://cshl.org/pub/science/mzhanglab/NOVELgeneCSE
- M Zhang lab ftp server: DuplicationSeg ftp://cshl.org/pub/science/mzhanglab/DuplicationSeg
- Salamov A, Solovyev V. Ab initio gene finding in Drosophila genomic DNA. Genome Res. 2000;10:516–522. doi: 10.1101/gr.10.4.516. [DOI] [PMC free article] [PubMed] [Google Scholar]
Associated Data
This section collects any data citations, data availability statements, or supplementary materials included in this article.
Supplementary Materials
Supplementary tables listing the 10 longest intron-region CSEs and 451 mouse genomic segments and their matched human segment pairs, and a figure showing the correlation between portions of CSEs and chromosome length of one chromosome in the whole genome


