

Abstract
A superior semicircular canal dehiscence (SCD) is a break or hole in the bony wall of the superior semicircular canal. Patients with SCD syndrome present with a variety of symptoms: some with vestibular symptoms, others with auditory symptoms (including low-frequency conductive hearing loss) and yet others with both. We are interested in whether or not mechanically altering the superior canal by introducing a dehiscence is sufficient to cause the low-frequency conductive hearing loss associated with SCD syndrome. We evaluated the effect of a surgically introduced dehiscence on auditory responses to air-conducted (AC) stimuli in 11 chinchilla ears. Cochlear potential (CP) was recorded at the round-window before and after a dehiscence was introduced. In each ear, a decrease in CP in response to low frequency (<2 kHz) sound stimuli was observed after the introduction of the dehiscence. The dehiscence was then patched with cyanoacrylate glue leading to a reversal of the dehiscence-induced changes in CP. The reversible decrease in auditory sensitivity observed in chinchilla is consistent with the elevated AC thresholds observed in patients with SCD. According to the ‘third-window’ hypothesis the SCD shunts sound-induced stapes velocity away from the cochlea, resulting in decreased auditory sensitivity to AC sounds. The data collected in this study are consistent with predictions of this hypothesis.
Keywords: Superior canal dehiscence, Third-window hypothesis, Auditory mechanisms
1. Introduction
Superior semicircular canal dehiscence (SCD) syndrome, first described by Minor et al. (1998), is associated with sound and/or static pressure-induced vertigo. In addition to vestibular symptoms (Minor et al., 1998; Cremer et al., 2000; Minor, 2000; Brantberg et al., 2000), patients with the syndrome frequently have a super-sensitivity to bone-conducted auditory stimuli, and a decreased sensitivity to air-conducted sound (Minor et al., 2003; Mikulec et al., 2004). The increased air-conduction thresholds (20–60 dB) and the decreased bone-conduction thresholds (5–10 dB) together lead to a conductive hearing loss (e.g., air–bone gap) that is largest in the low frequencies (Mikulec et al., 2004). The audiogram from a right-ear SCD patient in Fig. 1, demonstrates both decreased bone-conduction and increased air-conduction thresholds.
Fig. 1.
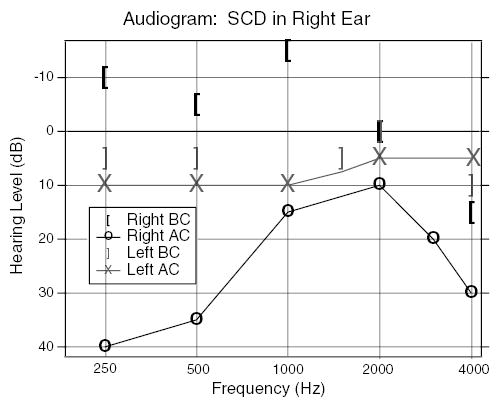
An audiogram from a patient with an SCD in the right-ear. The ear with the SCD shows decreased bone-conduction (BC) thresholds and increased air-conduction (AC) thresholds compared to the left-ear.
Patients with SCD syndrome may present with all or only a subset of the vestibular and auditory signs and symptoms associated with SCD syndrome, for example, it is not unusual for SCD patients to present primarily with vestibular symptoms (without hearing loss) or with auditory symptoms (without vestibular symptoms). For this work, we are focusing on the effect of SCD on audition.
Previous reports have investigated the role of SCDs on auditory sensitivity in response to bone-conducted (BC) sound stimuli in an animal model (Songer et al., 2004; Rosowski et al., 2004; Sohmer et al., 2004). These studies demonstrated that sensitivity to BC stimuli increases after the introduction of a dehiscence and that the increase is greatest at frequencies below 2 kHz (Songer et al., 2004). The increase in sensitivity to BC sound in animal models is consistent with the increased bone-conduction sensitivity (decreased thresholds) in some SCD patients (Minor et al., 2003; Mikulec et al., 2004) (Fig. 1).
Some patients with SCD syndrome present with decreased sensitivity to air-conducted sound (Minor et al., 2003; Mikulec et al., 2004). The air–bone gap (calculated as the difference between the bone-conducted and air-conducted thresholds) observed clinically in patients with SCD syndrome has been qualitatively explained by the ‘third-window hypothesis’ (Minor et al., 1998; Rosowski et al., 2004) that proposes that some of the volume velocity produced by the stapes in response to air-conducted (AC) stimuli is shunted away from the cochlea, through the dehiscent canal. This shunt causes a reduction in the flow of AC sound energy into the cochlea, indicated by increases in AC hearing thresholds. Despite clinical work demonstrating decreased sensitivity to AC sounds in response to SCD, decreased sensitivity to AC sounds has not been demonstrated in an animal model.
The purpose of this study was to determine the effect of SCD on AC auditory responses in an animal model in order to test the third-window hypothesis of the effect of SCD on AC auditory responses. We used an animal model of SCD to increase our understanding of the physiology and mechanics of hearing as well as those underlying the disorder. This increased understanding of the mechanics and mechanisms of SCD may provide insight into the variety of presentations of the syndrome and aid in the development of better diagnostics and therapies.
2. Materials and methods
2.1. Animal preparation
Eleven chinchillas were used in this study. The chinchilla was chosen as an animal model because its range of hearing (20 Hz to 30 kHz) is similar to that of humans, its accessible superior semicircular canal allows easy surgical introduction of an SCD, and it has been used in previous studies to evaluate the effect of SCD on vestibular function (Hirvonen et al., 2001; Carey et al., 2004). The chinchillas were anesthetized with intraperitoneal sodium pentobarbital (50 mg/kg) and ketamine (40 mg/kg) with additional doses as necessary to maintain deep anesthesia. The experiments were carried out in accordance with the Massachusetts Eye and Ear Infirmary (MEEI) Animal Use Guidelines and approved by the MEEI Institutional Animal Care and Use Committee.
After the animal was anesthetized, a tracheotomy and tracheal cannulation were performed, and the dorsal aspects (superior and posterior) of the bulla were exposed. A 6 mm diameter hole was created in the wall of the superior bulla cavity to visualize both the medial surface of the tympanic membrane and the bony surface of the superior semicircular canal (SC) within the middle ear (Fig. 2). This approach was used to (1) sever the tendon of the tensor tympani muscle with a small knife and (2) immobilize the stapedius muscle by opening the middle-ear segment of the facial canal and severing the facial nerve distal to its genu but proximal to the stapedial nerve departure. The middle-ear muscles were surgically immobilized because previous work (unpublished) demonstrated middle-ear muscle contraction in chinchilla despite deep anesthesia (ascertained in part by lack of toe pinch response). A 3 mm diameter hole was created in the wall of the most caudal (posterior) bulla cavity in order to place a silver wire electrode in the round-window niche to record cochlear potential (CP). An electrode in the neck muscle acted as a ground.
Fig. 2.
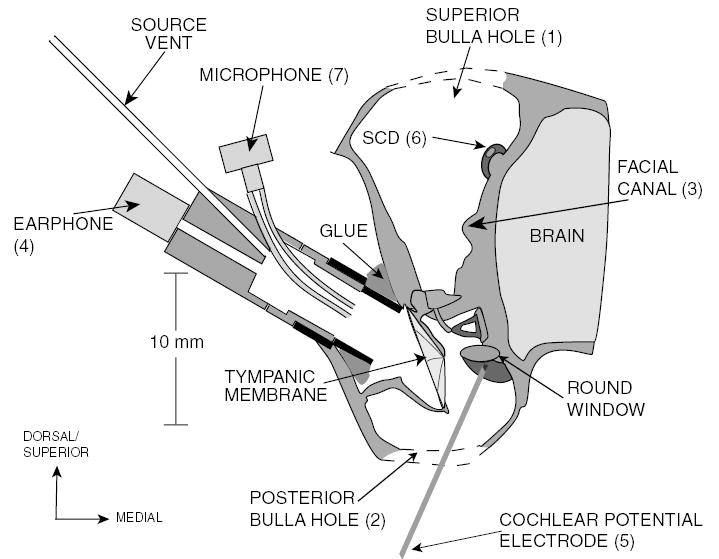
A schematic of the chinchilla middle-ear cavity (coronal view) illustrating the experimental setup. The superior hole (1) is opened to sever the facial nerve in its canal (3) and introduce the SCD (6). The posterior bulla hole (2) is opened to place the CP electrode (5) on the round window.
The pinna and cartilaginous ear-canal were resected and the bony ear canal was shortened. A probe tube microphone and calibrated sound source with high output impedance (Ravicz et al., 1992) were coupled to the ear canal via a short (6 mm) brass tube that was cemented to the remnant of the bony ear canal. The bullar holes were open at the time of measurements.
A series of CP and ear canal sound pressure measurements was then made. A small knife was used to surgically introduce an oval dehiscence (0.4 mm × 0.6 mm) into the bony wall of the superior semicircular canal, about 2 mm from the ampulla. Another measurement series was performed. Next, the dehiscence was patched with cyanoacrylate glue (Superglue gel®) and a third series of CP and PEC measurements was made. The patched SCD data were compared to the intact superior canal (pre-SCD) data to determine if the effects of the introduction of the dehiscence were reversible. A fourth set of measurements were made after removing the Superglue patch.
2.2. Stimulus and instrumentation
The sound stimulus consisted of a train of 100log chirps with frequency components at 11 Hz intervals from 11 Hz to 24 kHz (such chirps have a low-frequency emphasis). The duration of each chirp was 91 ms. The stimulus was designed using custom Labview scripts and generated by a HP33120A function generator. The output from the HP33120A function generator is fed through a Tucker Davis Technologies (TDT) PA5 programmable attenuator (to allow modifications of the stimulus level). The output of the PA5 is then fed into a CROWN D-45 amplifier. The level on the CROWN is adjusted so that 1 V peak output from the DAC leads to 1 V peak at the data channels. The output of the CROWN amplifier drove a hearing-aid earphone (Knowles ED-1913) that was part of a sound source/measurement assembly with high acoustic output impedance (Ravicz et al., 1992). The source assembly was coupled to the ear as illustrated in Fig. 2.
A hearing-aid microphone (Knowles EK-3027) and associated probe tube, which were built into the sound source assembly, were used to measure the resultant sound pressure in the ear canal, and a silver wire electrode placed at the round window was used to measure the cochlear potential (CP). Both the voltage recorded from the microphone and that by the round-window electrode were fed into a GRASS P5 series AC pre-amplifier. The voltages were averaged over the 100 stimulus presentations and stored. The voltage recorded from the microphone was then converted into the equivalent pressure at the ear canal (PEC) by a pre-measured calibration characteristic.
Measurements of the sound pressure in the ear canal (PEC) and CP were made at different stimulus levels in order to evaluate repeatability and linearity as well as to determine an appropriate stimulus level. Measurements of PEC and CP were made at 20, 30, and 40 dB attenuation (94, 84, and 74 dB SPL) for each test condition. Over the majority of the frequency range of interest, the microphone signal (PEC) was proportional to stimulus level and had a high signal-to-noise ratio (Fig. 3(a)). For frequencies below 300 Hz nonlinear behavior is observed in PEC. This nonlinearity is consistent with previous findings (Kim et al., 1980; Ravicz and Rosowski, 2001). In most cases, the CP showed signs of saturation across a wide range of frequencies at 20 dB of attenuation (Fig. 3(b)). This saturation was greatly reduced at 30 dB of attenuation. For attenuations less than 30 dB, the signal-to-noise ratio decreased, leading to an increase in the variability of the normalized response. We chose 30 dB of attenuation as the appropriate stimulus level for CP measurements because it minimized saturation and had a good signal-to-noise ratio (Fig. 4). All of the data illustrated throughout the paper are normalized for measurement system gains and attenuations and presented with respect to constant stimulus voltage (Vstim).
Fig. 3.
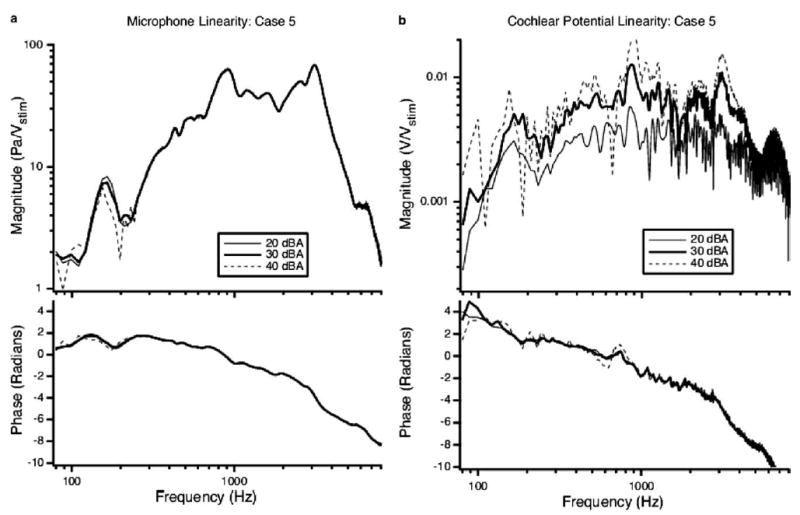
Normalized sound pressure (a) and cochlear potential (b) responses measured pre-dehiscence. Linear responses do not vary with level of stimulus voltage to the earphone (Vstim) due to normalization. (a) The PEC normalized by Vstim recorded at the TM at three different levels of attenuation. Nonlinear behavior is observed in the low frequencies (80–300 Hz) consistent with observations by others (Kim et al., 1980; Ravicz and Rosowski, 2001). (b) The cochlear potential normalized by Vstim at three different levels of attenuation. At 20 dB attenuation (20 dBA), the CP signal is clearly saturated as evidenced by its lower overall normalized magnitude. At 40 dB attenuation (40 dBA) the signal-to-noise ratio deteriorates.
Fig. 4.
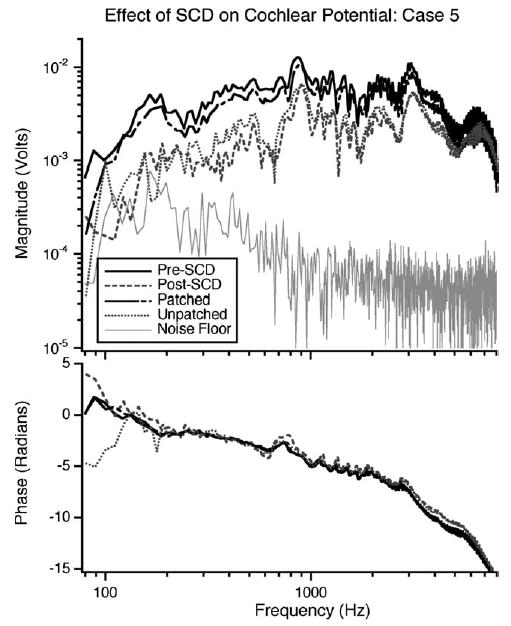
Results in a representative ear illustrating the CP normalized by Vstim: The pre-SCD case (solid black line), after the introduction of an SCD (grey dashed line), when the dehiscence is patched (black dot-dashed line), and after the removal of the patch (grey dotted line), a noise measurement made in the pre-SCD case (thin grey line). The attenuation level was 30 dB for each measurement.
3. Results
The effect of an SCD on auditory sensitivity in response to air-conducted sound was evaluated in 11 ears. A representative case is illustrated in Fig. 4, which shows (1) baseline CP, (2) CP after the introduction of the dehiscence, (3) CP after the dehiscence is patched, (4) the CP upon removal of the patch, and (5) the noise floor with 30 dB of attenuation. A decrease in the CP magnitude is observed after the introduction of the dehiscence. The decrease is most prominent, on the order of a factor of four, in the low frequencies (100–1000 Hz), though it extends to higher frequencies (up to 4 kHz). After the dehiscence is patched, the CP increases to within 2 dB (for frequencies below 5 kHz) of the pre-SCD value. When the patch is removed, the CP decreases to a level similar to that seen after the initial introduction of the dehiscence. Manipulation-induced changes in the phase of the CP are small. The reversal of the dehiscence-induced magnitude change implies that the dehiscence itself is the cause of the changes. In all eleven ears, the decrease in magnitude of the CP is reversed to within about 2 dB by patching the dehiscence.
For each of the eleven ears, the difference between the measurements of CP magnitude after the introduction of the dehiscence (post-SCD) and with the canal intact (pre-SCD) is expressed as a dB difference These data, along with the mean for the 11 ears, are illustrated in Fig. 5. This figure demonstrates that between 300 and 600 Hz in all 11 ears there is a decrease in CP magnitude of 4–20 dB as a result of a dehiscence. Many ears show a drop in CP over a broad frequency range (100 Hz to 4 kHz), others show a decrease limited to the 200–600 Hz range. For frequencies below 3000 Hz, the mean drop in CP magnitude as a result of the introduction of the dehiscence is statistically different from zero (P ≤ 0.05 using a Student’s t test) as illustrated by the grey shading in the figure. The decrease is largest and most significant (P ≤ 0.001) at low frequencies (300 Hz to 1 kHz). At frequencies above 4500 Hz the dehiscence is also associated with a mean decrease in CP magnitude, however, that reduction is not statistically significant. There are no statistically significant changes in the phase of the CP as a result of SCD at any frequency.
Fig. 5.
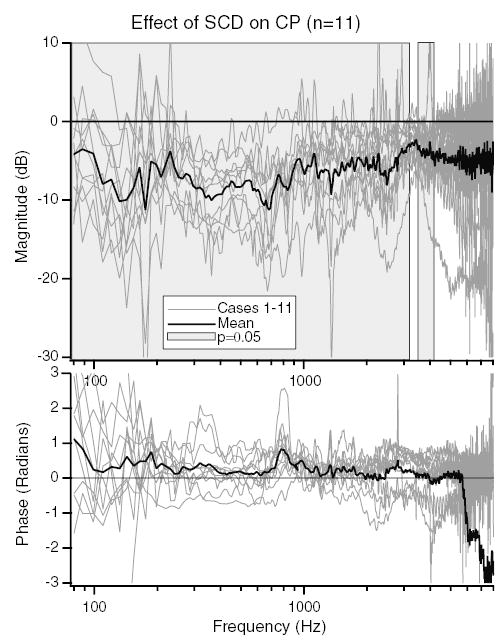
The dB difference in CP/Vstim produced by the introduction of the dehiscence in 11 ears. The light grey lines are the dB difference in CP between the post-SCD and pre-SCD states for each ear. The solid black line shows the mean dB difference. The grey shaded regions show the frequencies where the change in CP is statistically different from zero (P ≤ 0.05).
The effects of a dehiscence on CP magnitude are summarized in Table 1 for the audiometric frequencies: 125 Hz, 250 Hz, 500 Hz, 1000 Hz, 2 kHz, 4 kHz, and 8 kHz. The means and SDs of the dB difference in dehiscence-induced CP magnitude for the 11 ears are listed. The dehiscence produced a significant change in average magnitude of more than 4.5 dB at frequencies of 2000 Hz and below. The changes below 2000 Hz were significant at the 0.01 or better level. The mean and standard deviation of the dB difference between the baseline condition and the patched dehiscence is also expressed in the table. For all frequencies except 250 and 500 Hz, the difference between the baseline condition and the patched condition was not statistically significant, indicating that we had undone (reversed) the effects of the dehiscence. At both 250 and 500 Hz, there were small (<2.5 dB) but significant (P ≤ 0.05) drops in CP between the pre-SCD and patched cases.
Table 1.
The mean, SD (column 2) and significance (column 3) of the dB difference of the cochlear potential magnitude between the intact (pre-SCD) condition and after the introduction of the dehiscence (post-SCD) (n = 11)
| Frequency (Hz) | Mean post/pre ± SD (dB) | Significance | Mean patch/pre ± SD (dB) | Significance |
|---|---|---|---|---|
| 125 | −10.1 ± 5.9 | P < 0.001 | −2.0 ± 4.3 | NS |
| 250 | −7.1 ± 3.4 | P < 0.001 | −2.1 ± 2.0 | P < 0.01 |
| 500 | −8.3 ± 4.3 | P < 0.001 | −2.4 ± 3.6 | P < 0.05 |
| 1000 | −6.5 ± 4.8 | P < 0.01 | −1.0 ± 2.0 | NS |
| 2000 | −4.9 ± 3.4 | P < 0.001 | −1.9 ± 3.5 | NS |
| 4000 | −2.9 ± 5.2 | NS | −1.2 ± 3.9 | NS |
| 8000 | −1.0 ± 10.2 | NS | 1.3 ± 6.3 | NS |
NS denotes cases where the null hypothesis that the manipulations do not alter the CP is accepted at the 5% significance level. Column 4 shows the mean dB difference in magnitude between the pre-SCD state and the patched state. Column 5 shows the significance of that difference.
In addition to reversible changes in the CP in response to a dehiscence, reversible changes in PEC also occurred. An example of these changes is illustrated in Fig. 6. A decrease in PEC is observed, which is largest for frequencies between 100 and 300 Hz. Thus, in response to SCD both CP and PEC change. Fig. 7 illustrates the mean dB difference in CP as a result of the dehiscence normalized by stimulus voltage (CP/Vstim) and by the PEC (CP/PEC). Above 700 Hz, there is little difference between the CP/Vstim and CP/PEC. However, for frequencies between 100 and 700 Hz the decrease in the magnitude of CP/PEC is smaller than the decrease in CP/Vstim. The decrease in CP/PEC is statistically different from zero for frequencies between 350 and 3000 Hz as well as below 125 Hz. The dehiscence-induced change in PEC, which effectively alters the stimulus to the inner ear, is a direct indication that the dehiscence effects auditory mechanics.
Fig. 6.
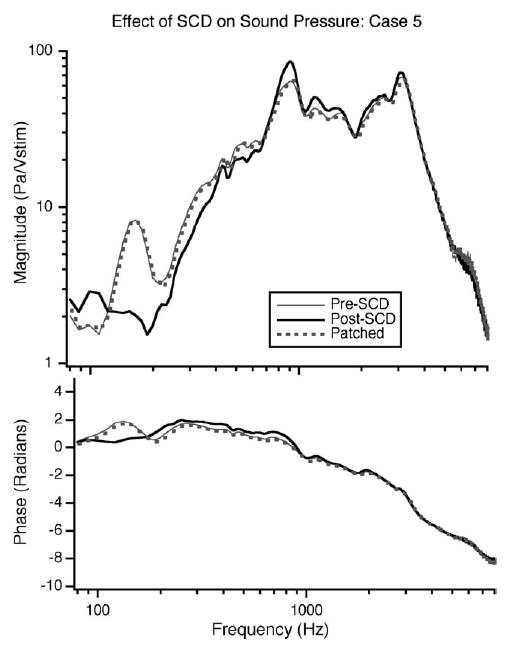
The effect of the introduction of the SCD on PEC in pascals normalized by stimulus voltage (Vstim). The solid grey line illustrates PEC prior to dehiscence; the black line shows the pressure after the dehiscence, the dotted grey line shows the pressure after patching. The dehiscence introduced a decrease in pressure at the low frequencies (110–300 Hz) that is reversed when the dehiscence is patched.
Fig. 7.
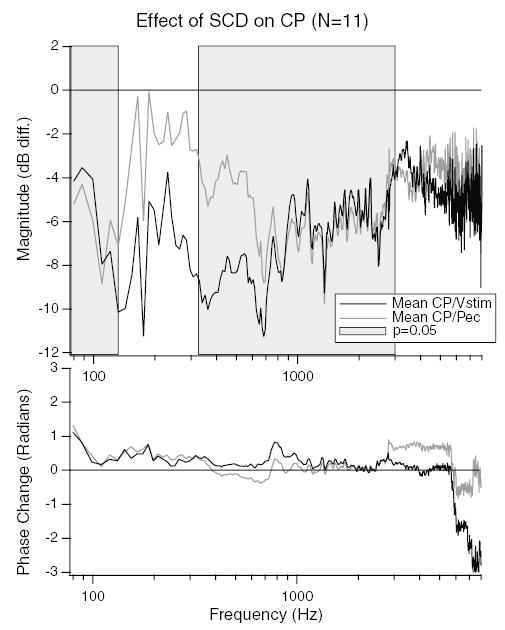
Differences between normalizing the CP by stimulus voltage and ear-canal sound-pressure. The mean dB difference in CP post- and pre-SCD normalized by stimulus voltage (CP/Vstim) (black line), and CP normalized by ear-canal sound-pressure (CP/PEC) (grey line) are illustrated. The grey shaded region shows the frequency ranges where the CP/PEC is statistically different from zero (P ≤ 0.05). A systematic difference between CP/Vstim and CP/PEC is apparent for frequencies between 130 and 700 Hz.
4. Discussion
4.1. Effect of SCD on air-conducted sound in the chinchilla
Our results indicate that an SCD can produce a reduction in the cochlear potential produced by a given stimulus level (Figs. 4 and 5). The reductions are largest at low frequencies, averaging 10 dB at 125 Hz (Table 1). Sealing the SCD with cyanoacrylate glue reverses the reductions (Fig. 4, Table 1). The repeatability (within and across animals) and the reversibility are clearly consistent with hearing changes that are tied to the mechanical effects of opening and closing the dehiscence and not uncontrolled changes in the acoustic sensitivity of the ear.
The results also showed that opening and closing the SCD altered the PEC produced by the sound source (Fig. 6) for a given stimulus voltage. These alterations are indications of an SCD induced change in inner- or middle-ear mechanics. For example, the SCD could lower the cochlear input impedance (Rosowski et al., 2004), which would decrease the acoustic load on the middle ear and result in a decrease in PEC produced by the high-impedance sound source we used. Indeed, such hypothetical effects of SCD on middle-ear mechanics and sound transmission are consistent with the third-window hypothesis (as discussed in Section 4.4). Measurements of these hypothetical SCD induced alterations in middle- and inner-ear mechanical events are the subject of continuing work.
There is a statistically significant decrease in CP as a result of SCD regardless of whether CP/Vstim or CP/PEC is evaluated. This demonstrates that the changes in CP we observed are influenced by, but cannot be completely attributed to a change in the effective stimulus to the inner-ear provided by our source.
4.2. Comparison to other animal studies
In the present study, we were able to demonstrate a frequency-dependent decrease in auditory sensitivity in the chinchilla (as measured by CP) in response to the introduction of a SCD. The decrease was largest (mean of 8.6 dB) at low frequencies (less than 500 Hz) and decreased in magnitude as frequency increased until the drop was no longer significant for frequencies above 4 kHz. A previous animal study of SCD in sandrat demonstrated no statistically significant changes in auditory sensitivity in response to air-conducted stimuli (Sohmer et al., 2004). Potential reasons for the differences in results between the two studies include:
Inter-species variation.
The state of the middle-ear muscles. Previous work in chinchilla has demonstrated continued activity of the middle-ear muscles despite general anesthesia and lack of toe-pinch responses (Rosowski et al., unpublished). Middle-ear muscle activity may lead to alterations in middle-ear mechanics and diminished auditory responses to loud stimuli. In order to eliminate such variations in the middle-ear state, we immobilized the middle-ear muscles in our preparation. Measurements of middle-ear input impedance were made pre- and post-immobilization in a number of ears (data not yet published) and no changes in middle-ear input admittance were observed.
Frequency selectivity of the measurement method. In the present study, both the stimulus (log chirp with low-frequency emphasis) and measurement technique (gross CP at the round-window) were designed to measure low-frequency changes in cochlear sensitivity, such as those observed in patients. Sohmer et al. used click-evoked ABR as their measure of the auditory response. Clicks and ABR are biased toward high-frequency responses and may not have been sensitive to the low-frequency changes that we observed.
The type of sound source used may impact the effective stimulus to the inner ear after the introduction of dehiscence. For example, our high-impedance source produces sound pressures that vary as the load impedance varies. A low-impedance sound source would be less sensitive to variations in the load impedance.
Procedural improvements implemented in the present study allow for greater sensitivity to low-frequency changes in auditory sensitivity in response to air-conducted stimuli than in previous studies.
4.3. Comparison to clinical studies
The low-frequency hearing loss associated with SCD in patients is represented by the air-bone gap, which is calculated from auditory thresholds measured in response to both AC and bone-conducted (BC) sound. Two studies have reported air–bone gaps in SCD patients: Minor et al. reported on 4 patients who presented with air–bone gaps of 24 ± 7 dB for frequencies between 250 and 4000 Hz (Minor et al., 2003), and Mikulec et al. reported a mean air-bone gap of 37 dB at 500 Hz in 10 ears (Mikulec et al., 2004) from patients that presented with auditory symptoms.
In order to compare our data to the clinical data, we can calculate an air–bone gap for chinchilla at 500 Hz. We previously reported low-frequency increases in CP response to BC stimuli in chinchilla after the introduction of a SCD with a mean gain of 8.1 dB near 500 Hz (Songer et al., 2004). The increased sensitivity to BC in chinchilla is consistent with clinical observations of super-sensitive (<0 dB) BC thresholds in many patients with SCD syndrome (Minor et al., 2003; Mikulec et al., 2004) as well as those found in sandrat (Sohmer et al., 2004). At 500 Hz, the present study showed an 8.7 dB decrease in the chinchillas response to AC stimuli. Combining the above with the SCD induced increase of 8.1 dB in the sensitivity to BC sound (Rosowski et al., 2004; Songer et al., 2004) leads to an SCD induced air–bone gap of 16.8 dB at 500 Hz in chinchilla.
The mean 16.8 dB air–bone gap estimated for the chinchilla from our measurements is somewhat smaller in magnitude than the 25–40 dB air–bone gaps reported clinically. Interspecies variation is one potential reason for the difference in the magnitude of the air–bone gap. Anatomical differences between patients and the chinchilla model may also account for some of the difference in the magnitude of the effects of SCD on sensitivity to AC sound. One major difference is that the superior semicircular canal in chinchilla is located in the middle-ear air space, whereas the superior semicircular canal in humans is located in the cranial cavity. The effect of the boundary at the dehiscence (air vs. dura and cerebral spinal fluid) has been evaluated with a mechano-acoustic model of SCD that suggests the effects of SCD on audition are slightly larger for low frequencies in the presence of the fluid-filled cavity representing the brain, dura, and cerebral spinal fluid (unpublished). This low-frequency decrease in predicted auditory thresholds is the result of a low-frequency acoustic resonance produced by the interaction between the mass of the fluid in the SC and the compliance of the fluid in the cranial cavity.
There are also significant differences in the structure and state of the middle ear between the human patient measurements and the cochlear potential measurements we report. These differences include: (1) The chinchilla middle-ear cavity is opened while the human middle-ear cavity is intact; while the human middle-ear cavity places only minor limitations on hearing function (Zwislocki, 1962), the cavity in chinchillas greatly limits the low-frequency motion of the TM (Dallos, 1970; Rosowski, 1994). (2) The middle-ear muscles of the chinchilla have been incapacitated: The result of this manipulation should actually make the chinchilla and human results more similar in that it removes the possibility of middle-ear reflex contractions elicited by our moderate-to-high level stimuli and prevents the spontaneous muscle contractions sometimes observed in anesthetized chinchilla. (3) Differences in sound sources: Our use of a high-impedance sound source allows us to observe manipulation-induced changes in sound pressure that are indicative of changes in the mechanics of the ear. The circum- or supra-aural earphones commonly used in audiometry act more like sound pressure sources and are roughly independent of changes in the middle ear (Voss et al., 2000a); however, insert earphones may behave more like our high-impedance source (Voss et al., 2000b) and show differences in sound pressure in ears with SCD.
Another difference between the human and our chinchilla data is that patients reported in the clinical studies were pre-selected based on presentation with conductive hearing loss. However, many other SCD patients present with vestibular symptoms, with little to no hearing loss (Minor et al., 1998; Minor, 2000), and are not included in the calculation of the mean conductive hearing loss. The addition of SCD cases with small air–bone gaps would lead to a decrease in the average air–bone gap observed in the general population of SCD patients. Additionally, variation in the size and location of the dehiscences in the patient population may account for some of the variability in patient presentation, whereas in the chinchilla model the dehiscence size and location was consistent across the 11 tested ears. Ongoing work is focusing on the effect of the size and location of the dehiscence in the chinchilla model.
4.4. Mechanism of decreased sensitivity to AC stimuli
Minor et al. (1998) proposed the ‘third-window’ hypothesis to explain the clinical vestibular symptoms associated with SCD syndrome. According to this hypothesis, the dehiscence provides a pathway that alters inner-ear sound conduction giving rise to pathological stimulation of the superior canal ampulla in response to auditory stimuli. This alteration is also hypothesized to give rise to the auditory symptoms associated with SCD syndrome (Rosowski et al., 2004). Fig. 8 illustrates the proposed fluid pathways that result from air-conducted sound in the presence of an SCD.
Fig. 8.
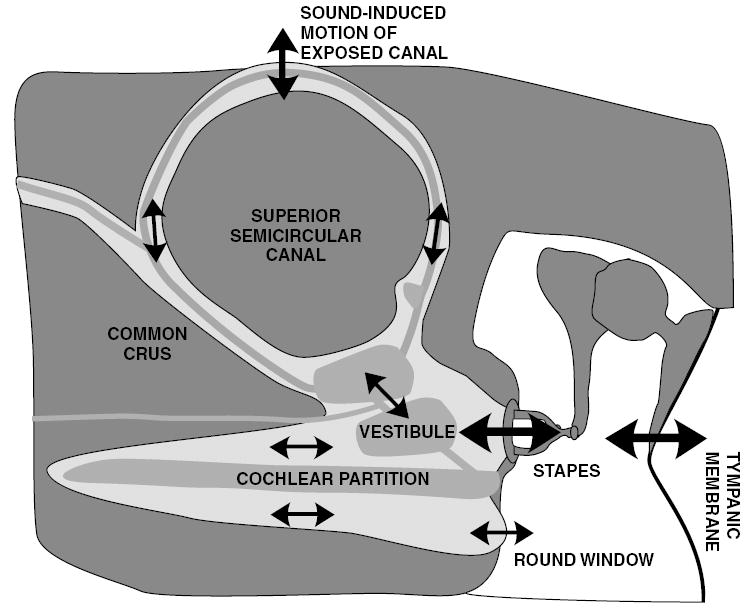
The hypothetical response of inner ear fluid motion to air-conducted sound in an ear with a dehiscent canal. The solid black arrows show the proposed directions of motion, where arrow size is proportional to magnitude of motion. The endolymph (grey), perilymph (light grey), and bony capsule (dark grey) are illustrated, along with a dehiscence at the apex of the superior semicircular canal. Air-conducted sound causes a stapes volume velocity, which is partially shunted through the superior semicircular canal when there is a dehiscence. This shunting leads to a decrease in the stimulus to the cochlea and diminishes the round window velocity (adapted from Rosowski et al., 2004).
In response to air-conducted sound, the stimulus enters the cochlea via the middle ear and the oval window. In the normal (healthy) cochlea the volume velocity and pressure wave introduced at the oval window travel along and across the cochlear partition and out through the round window. The resultant pressure difference across the cochlear partition evokes a traveling wave of basilar-membrane motion and stimulates the hair cells in the Organ of Corti (von Bekesy, 1960; Ruggero et al., 1990), resulting in auditory stimulation in response to air-conducted sound. In the case of either pathological or experimentally introduced SCD, an additional pathway for the volume velocity and pressure wave is hypothesized. This pathway is expected to shunt some of the sound-induced stapes volume-velocity away from the cochlea, through the dehiscent superior semicircular canal. According to this third-window hypothesis, the shunted volume velocity stimulates the ampulla of the SC leading to vestibular stimulation and shunts volume-velocity away from the cochlea, leading to decreased sensitivity to air-conducted auditory stimuli.
The results illustrated in Figs. 6 and 7 demonstrate that the dehiscence impacts more than just the mechanics of the inner ear, but also has the ability to affect the stimulus to the inner ear (the pressure measured in the ear canal). Thus, the audiometric results may be influenced by the acoustic system being used to test them (Voss et al., 2000a,b). The third-window hypothesis used to explain the effects of SCD on auditory responses to AC sound stimuli can also be used to account for the decrease in ear-canal sound-pressure illustrated in Fig. 6. The introduction of a pathological third window into the inner ear (the SCD) is hypothesized to add an additional low impedance pathway for sound through the inner ear (Fig. 8). If this pathway has a lower impedance than that of the intact ear, there will be a decrease in the cochlear load at the oval-window as a result of dehiscence. The reduction in the contribution of the cochlear impedance to the middle-ear input impedance results in a frequency dependant reduction in the pressure measured in the ear-canal. The effect of dehiscence on the ear-canal sound pressure and the role of the third-window hypothesis will be reported in greater detail in an upcoming publication.
Both clinical and animal studies of the vestibular effects of SCD are consistent with the third-window hypothesis (Hirvonen et al., 2001; Carey et al., 2000; Minor et al., 1998; Minor, 2000; Brantberg et al., 2000). These studies demonstrate pathological vestibular sensitivity as a result of the SCD. Clinical results showing decreased AC thresholds among patients with SCD syndrome are also consistent with the third-window hypothesis (Minor et al., 2003; Mikulec et al., 2004). We have also demonstrated that sound at the tympanic membrane causes the vestibular lymphs in a chinchilla SCD to move (Rosowski et al., 2004). The data presented in this paper, however, are the first support for a SCD induced change in hearing response to AC sound in an animal model that is consistent with the third-window hypothesis.
The third-window hypothesis suggests a simple hydro-acoustic model of the effect of SCD on air-conducted sound. An anatomically constrained model in humans has been shown to produce alterations in both air and bone conduction that are similar to those observed in patients with the syndrome (Rosowski et al., 2004) and is being expanded to the chinchilla.
Acknowledgments
This work has been supported by an NSF graduate student fellowship, NIH training grant, and additional NIH grants. S. Merchant and W. Peake, D. Mountain and M.E. Ravicz provided insights and suggestions. M. Wood assisted with data collection and animal surgery.
References
- Brantberg K, Bergenius J, Mendel L, Witt H, Tribukait A, Ygge J. Symptoms, findings and treatment in patients with dehiscence of the superior semicircular canal. Acta Otolaryngol. 2000;121:68–75. doi: 10.1080/000164801300006308. [DOI] [PubMed] [Google Scholar]
- Carey J, Hirvonen T, Hullar T, Minor L. Acoustic responses of vestibular afferents in a model of superior canal dehiscence. Otol Neurotol. 2004;25:345–352. doi: 10.1097/00129492-200405000-00024. [DOI] [PubMed] [Google Scholar]
- Carey J, Minor L, Nager G. Dehiscence or thinning of bone overlying the superior semicircular canal in a temporal bone survey. Arch Otolaryngol Head Neck Surg. 2000;126:137–147. doi: 10.1001/archotol.126.2.137. [DOI] [PubMed] [Google Scholar]
- Cremer P, Minor L, Carey J, Santina C. Eye movements in patients with superior canal dehiscence syndrome align with the abnormal canal. Neurology. 2000;55:1833–1841. doi: 10.1212/wnl.55.12.1833. [DOI] [PubMed] [Google Scholar]
- Dallos P. Low-frequency auditory characteristics: Species dependence. J Acoust Soc Am. 1970:489–499. doi: 10.1121/1.1912163. [DOI] [PubMed] [Google Scholar]
- Hirvonen T, Carey J, Liang C, Minor L. Superior canal dehiscence: mechanisms of pressure sensitivity in a chinchilla model. Arch Otolaryngol Head Neck Surg. 2001;127:1331–1336. doi: 10.1001/archotol.127.11.1331. [DOI] [PubMed] [Google Scholar]
- Kim, D., Siegel, J., Molnar, C., 1980. Postmortem effects and species differences for acoustic input characteristics at the eardrum of the chinchilla and cat. In: Societyof Neuroscience Abstracts, vol. 6, p. 41.
- Mikulec A, McKenna MJ, Ramsey MJ, Rosowski JJ, Herrmann BS, Rauch SD, Curtin HD, Merchant SN. Superior semicircular canal dehiscence presenting as conductive hearing loss without vertigo. Otol Neurotol. 2004;25:121–129. doi: 10.1097/00129492-200403000-00007. [DOI] [PubMed] [Google Scholar]
- Minor L. Superior canal dehiscence syndrome. Am J Otol. 2000;21:9–19. [PubMed] [Google Scholar]
- Minor L, Carey J, Cremer P, Lustig L, Streubel SO. Dehiscence of bone overlying the superior canal as a cause of apparent conductive hearing loss. Otol Neurotol. 2003;24:270–278. doi: 10.1097/00129492-200303000-00023. [DOI] [PubMed] [Google Scholar]
- Minor L, Solomon D, Zinreich J, Zee D. Sound- and/or pressure-induced vertigo due to bone dehiscence of the superior semicircular canal. Arch Otolaryngol Head Neck Surg. 1998;124:249–258. doi: 10.1001/archotol.124.3.249. [DOI] [PubMed] [Google Scholar]
- Ravicz, M., Rosowski, J., 2001. The middle-ear input admittance in chinchilla: effect of middle-ear cavities and some low-frequency peculiarities. In: Abstracts of the Twenty-fourth Midwinter Meeting of the Association for Research in Otolaryngology, p. 62.
- Ravicz M, Rosowski J, Voigt H. Sound-power collection by the auditory periphery of the mongolian gerbil meriones unguiculatus: I. middle-ear input impedance. J Acoust Soc Am. 1992:157–177. doi: 10.1121/1.404280. [DOI] [PubMed] [Google Scholar]
- Rosowski, J., 1994. AN Popper and RR Fay. Springer Handbook of Auditory Research: Comparative Hearing: Mammals, Chapter 6. Outer and Middle Ears. Springer-Verlag, New York, pp. 172–247.
- Rosowski JJ, Songer JE, Nakajima HH, Brinsko KM, Merchant SM. Investigations of the effect of superior semicircular canal dehiscence on hearing mechanisms. Otol Neurotol. 2004;25:323–332. doi: 10.1097/00129492-200405000-00021. [DOI] [PubMed] [Google Scholar]
- Ruggero MA, Rich NC, Shivapuja BG. Middle-ear response in the chinchilla and its relationship to mechanics at the base of the cochlea. J Acoust Soc Am. 1990;87:1612–1629. doi: 10.1121/1.399409. [DOI] [PMC free article] [PubMed] [Google Scholar]
- Sohmer H, Freeman S, Perez R. Semicircular canal fenestration-improvement of bone- but not air-conducted auditory thresholds. Hear Res. 2004;187:105–110. doi: 10.1016/s0378-5955(03)00335-6. [DOI] [PubMed] [Google Scholar]
- Songer, J.E., Brinsko, K.M., Rosowski, J.J., 2004. Superior semicircular canal dehiscence and bone conduction in chinchilla. In: Gyo, K., Wada, H., Hato, H., Koike, T. (Eds.), The Proceedings of the Third International Symposium on Middle Ear Research and Oto-Surgery. World Scientific, Singapore, pp. 234–241.
- von Bekesy, G., 1960. Experiments in Hearing. American Institute of Physics.
- Voss S, Rosowski J, Merchant S, Thornton A, Shera C, Peake W. Middle-ear pathology can affect the ear-canal sound pressure generated by audiologic earphones. Ear Hear. 2000a;21:265–274. doi: 10.1097/00003446-200008000-00001. [DOI] [PubMed] [Google Scholar]
- Voss S, Rosowski J, Shera C, Peake W. Acoustic mechanisms that determine the ear-canal sound pressures generated by earphones. J Acoust Soc Am. 2000b;107:1548–1565. doi: 10.1121/1.428440. [DOI] [PubMed] [Google Scholar]
- Zwislocki J. Analysis of the middle-ear function. Part I: Input impedance. J Acoust Soc Am. 1962;34:1514–1523. [Google Scholar]