

SUMMARY
Purpose
Sustained mechanical loading alters longitudinal growth of bones, and this growth sensitivity to load has been implicated in progression of skeletal deformities during growth. The objective of this study was to quantify the relationship between altered growth and different magnitudes of sustained altered stress in a diverse set of non-human growth plates.
Methods
The sensitivity of endochondral growth to differing magnitudes of sustained compression or distraction stress was measured in growth plates of three species of immature animals (rats, rabbits, calves) at two anatomical locations (caudal vertebra and proximal tibia) with two different ages of rats and rabbits. An external loading apparatus was applied for eight days and growth was measured as the distance between fluorescent markers administered 24 and 48 hours prior to euthanasia.
Results
An apparently linear relationship between stress and percentage growth modulation (percent difference between loaded and control growth plates) was found, with distraction accelerating growth and compression slowing growth. The growth-rate sensitivity to stress was between 9.2 and 23.9% per 0.1 MPa for different growth plates, and averaged 17.1% per 0.1 MPa. The growth-rate sensitivity to stress differed between vertebrae and the proximal tibia (15 and 18.6 percent per 0.1 MPa respectively). The range of control growth rates of different growth plates was large (30 microns/day for rat vertebrae to 366 microns/day for rabbit proximal tibia).
Conclusions
The relatively small differences in growth-rate sensitivity to stress for a diverse set of growth plates suggests that these results might be generalized to other growth plates, including human. These data may be applicable to planning the management of progressive deformities in patients having residual growth.
Keywords: Endochondral_growth, Biomechanics, Growth_modulation, Stress, Hueter-Volkmann_law
INTRODUCTION
The progression of post-natal skeletal deformity such as scoliosis [1,2] and tibia vara (Blount’s disease) [3] during growth is associated with mechanically modulated endochondral growth. It is thought that angular deformities produce asymmetrical stress distribution across growth plates, causing asymmetrical growth in a ‘vicious cycle’. It is known that increased compression slows growth, and decreased compression or distraction accelerates it according to principles attributed to Hueter [4], Volkmann [5] and Delpech [6]. However, the relationship between different stresses acting on growth plates and consequential altered growth is not well quantified. Support for the Hueter-Volkmann principle has been obtained from animal studies [7,8,9,10], and Bonnel et al. [11] reported the amount of growth suppression with four different levels of compressive stress on the rabbit distal femoral growth plate. Staples and other devices are surgically implanted across growth plates to inhibit their growth, and the magnitude of the stress that causes growth arrest has been estimated in human [12,13] and non-human [11,14] growth plates. It is not known how different growth plates respond to differing levels of stress. It appears that growth plates are affected less by cyclic stress than by sustained stress [8,15,16].
The aim of this study was to document the alteration of growth at two different anatomical growth plate locations, for three differing levels of sustained stress, in three different species, and for animals of differing ages. The secondary aim was to identify differences between the growth response to stress between species, anatomical location and underlying growth rate that might help determine the likely growth-stress relationship in human growth plates.
MATERIALS AND METHODS
Growth plates at two anatomical sites (proximal tibia, and caudal vertebra) were subjected to sustained compression or distraction stress in three animal species (rat rabbit, calf), using an external loading apparatus (Figure 1). The tibial growth plate only was used in rabbits, while both growth plates (tail vertebral and proximal tibial) were used in rats and calves. In rats and rabbits, two ages of animals were studied, with older animals having about 75% of the growth rate of younger animals. The two ages were identified by examining body mass growth curves for each species, and assuming that there was a cubic power law relationship between increase in linear dimensions (longitudinal bone growth) and body mass during rapid skeletal growth. Some evidence for this power law for rabbits up to up to age 24 weeks was obtained by graphing data for tibial length in Masoud et al. [17].
Figure 1.
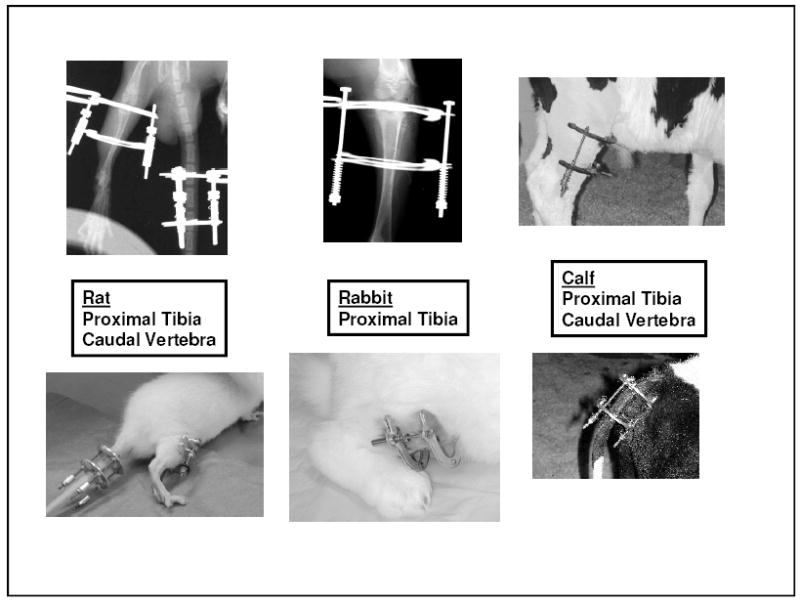
Photographs and radiographs of growth plate loading apparatus. Left: rat tibia and tail vertebrae; Center: rabbit tibia ; Right: calf tibia and tail.
The sustained stress magnitudes applied to each loaded growth plate had target values of either 0.1 MPa (distraction), 0 MPa (sham), −0.1 MPa (compression) or −0.2 MPa (high compression). The contralateral tibia and adjacent unloaded vertebrae provided internal controls for each animal, while the animals that had the apparatus installed, but without spring forces, provided the sham. Provisionally five animals were used in each loading magnitude group, with some exceptions (three, four or six animals per group) resulting from technical difficulties that occurred during the experiments. Thus data were included in this study from 41 rats, 39 rabbits and 18 calves.
Prior to application of loading apparatus, animals were first acclimated to housing in the American Association for Accreditation of Laboratory Animals Care (AAALAC) accredited animal facilities for six days. Then pins were inserted under general anesthesia through the diaphysis and epiphysis of the right proximal tibia, and through tail vertebrae adjacent to the loaded tail vertebra (rats and calves only). The pins transfixed the tail or limb (except in the case of calf tibiae where bicortical threaded bone screws were used) and were attached to external loading plates that were linked by passing threaded rods through holes in the loading plates. Calibrated springs on these rods were tightened to a desired force level to achieve the desired stress magnitudes. Each animal’s body mass and spring lengths were measured and adjusted on days 2,4 and 7. Animals were housed in individual cages provided with standard laboratory animal food and water ad libitum. Penicillin G (50 kU/kg) was administered prophylactically to rabbits and calves, starting on the day of surgery. Animals were euthanized eight days after the installation of the loading apparatus. All live animal procedures were reviewed and pre-approved by the University of Vermont Animal Care and Use Committee. After euthanasia, the loaded and within-animal control growth plates were excised and blocks about 4 mm cube were cut from several representative regions of each growth plate.
Rats
Sprague-Dawley male rats were purchased from a single approved breeder. The loading apparatus [18] was installed at postnatal age 38 days (younger group) or at age 58 days (older group). The older animals had provisionally 75% of the growth rate of the younger animals. The apparatus was installed under general anesthesia (Ketamine 80 mg/kg and Xylazine 10 mg/kg) with post-operative pain control (Buprenorphine 0.05 mg/kg). The tail loading apparatus was attached via two percutaneously inserted 0.55 mm diameter stainless steel insect mounting pins to each of the Cd6 and Cd8 tail vertebrae, with both growth plates of the Cd7 vertebra considered as the loaded ones and the within-animal control growth plates were the caudal and cephalad growth plates of Cd5 and Cd9 respectively. Two 0.35 mm diameter pins (younger animals) or 0.45 mm diameter pins (older animals) were inserted into the proximal tibial epiphysis at approximately 45 degrees to the sagittal plane under direct visualization by surgical exposure of the ventral aspect of the tibia with a midline skin incision. Two diaphyseal pins were inserted percutaneously parallel to the epiphyseal pins at approximately one third of the tibial length from the tibio-femoral joint. Pins were pre-sharpened to a three-faced pyramid cutting point and inserted by hand using a ‘Starrett’ chuck (Athol, MA) with a counter-rotating action to avoid binding soft tissue structures. The pins were attached with cyanoacylic glue (Loctite 4471) to aluminum loading plates. These plates were ring-shaped (tail apparatus) and horseshoe-shaped (tibial apparatus).
Rabbits
White New Zealand males rabbits were purchased from a single breeder. The loading apparatus was installed at the proximal tibia at age 41 days (younger group) or at age 62 days (older group). The apparatus was installed under general anesthesia (Ketamine 80 mg/kg, Xylazine 10 mg/kg and Acepromazine 1 mg/kg) with post-operative pain control (Buprenorphine 0.05 mg/kg). The pins were 0.75 mm diameter 17-7PH annealed stainless steel installed by the same procedure as for rats. Pairs of horseshoe-shaped aluminum loading plates were clamped over the pins with screws, and the gaps were filled with cyanoacylic glue.
Calves
Male Holstein calves were obtained from a research dairy farm. At age 48 days, animals were given Xylazine 0.1 mg/kg and Ketamine 80 mg/kg and intubated for Halothane gas anesthesia. They were supported in a canvas sling while under anesthesia. The tail apparatus was connected by two 1.5 mm Kirschner wires drilled percutaneously through each vertebra of the Cd4 and Cd6 vertebrae [19], thus the growth plates of the Cd5 vertebra were considered as the loaded ones, and the 3rd and 7th as controls. The wires were then tensioned and clamped to 60 mm diameter Ilizarov rings (Richards, Memphis TN). For the tibia apparatus, taper threaded bone pins of 6mm diameter (EBI, Parsippany NJ) were screwed percutaneously into the epiphysis (2 pins) and diaphysis (2 pins) after provisional pin insertion points and trajectories had been verified in intra-operative lateral radiographs. Pins were inserted into the antero-medial and antero-lateral aspects after pre-drilling the bone, and advanced until they emerged from the opposite cortex. Each pin was attached by a single clamp (EBI, Parsippany NJ) to the horseshoe-shaped external loading plate.
The spring lengths were adjusted to apply forces whose magnitude, divided by the estimated area, produced the desired stress of nominally 0.1 MPa, 0 MPa, −0.1 MPa or −0.2 MPa. The areas were not measured until the end of the experiments, so prior to initiating the experiments for each species an approximate relationship for estimating the area A for each animal was established by using the presumed power-law relationships:
| (1) |
where At represents tibial growth plate area, Av the vertebral growth plate area, W represents the body mass of the animal and A0t and A0v the mean areas measured directly from tibiae and vertebrae respectively removed previously from animals of each species and similar age, having an average mass of W0. The 2/3 power-law was based on presumed geometrical similarity of each species during its post-natal growth. At the end of each experiment, when loaded and control bones were excised, the dimensions of each growth plate were measured directly by use of a vernier caliper. For caudal vertebrae, the transverse and dorsal-ventral diameters were measured and averaged. Area was then calculated as πr2, where r was half of the average diameter. For tibiae, the area was estimated as half of the product of the transverse and dorsal-ventral dimensions (i.e. assuming a triangular shape). The mean measured growth plate areas of each species were used to estimate the actual average stress acting on the growth plates in each of the nominal stress groups. The preliminary estimated areas and the actual values for animals in these series are given in Table 1.
Table 1.
Tibial (At) and vertebral (Av) growth plate area values in mm2 for rats, rabbits and calves having body weight 125 g, 1250 g and 45 kg respectively. These values were used to convert ‘nominal’ to ‘actual’ stresses according to the ratio between the initial estimates available at the beginning of the experiment, and the final values obtained from experimental animals at the time of dissection. Since the actual areas were not known until the end of the experiments, the spring forces for each animal was set to an expected ‘nominal’ value. (See Equation 1).
| Initial Estimate | Final Value | |||
|---|---|---|---|---|
| At | Av | At | Av | |
| Rat | 17.3 | 9.9 | 19.0 | 9.0 |
| Rabbit | 100.6 | - | 110 | - |
| Calf | 3670 | 118 | 2600 | 115 |
The fluorochromes Calcein (15 mg/kg) and Xylenol Orange (90 mg/kg) were administered systemically 48 and 24 hours prior to death to label the ossifying front under the growth plates. All live animal procedures were conducted at approximately the same time of day.
Blocks of tissue containing an approximately 4x4 mm area of growth plate were taken from each growth plate for growth measurement. Blocks were selected from the central, dorsal, ventral, right, and left regions of the vertebral growth plates and from the central, dorsal, ventral, medial and lateral regions of the tibial growth plates. In rats (because of the smaller size) the medial and lateral sides of vertebral growth plates only were sampled. In older rats, three sections (lateral, central and medial) of tibial growth plates were sampled, whereas in the younger rats only medial and lateral tibial samples were selected. Each block was fixed [20], dehydrated first in serial alcohols and then in propylene oxide, and embedded in Epon-812 Araldite (Electron Microscopy Sciences, Hatfield, PA) using serial dilutions in propylene oxide and vacuum.
Growth measurements were made from mounted 1.5-micron thick sections (rats, rabbits) or (for calves) from the cut surfaces of the blocks that had been trimmed using a diamond faced wafering saw (Buehler Isomet, Buehler Ltd, Chicago, IL). In both cases, epifluorescent images were obtained at 1300 x 1030 pixel resolution using a Zeiss ‘Axioskop’ microscope with 10x lens. The microscope stage was rotated to align the presumed growth direction with the image frame. Images were captured with filtration for each of the two fluorescent labels, and the two images were subsequently ‘merged’ digitally. These images were displayed using custom software on a computer screen, and measurements of the images were then made by ‘clicking’ on boundaries of the fluorescent labelled bone with a computer ‘mouse’. The coordinates of approximately 25 points in each label boundary were recorded and a cubic spline function was fitted through these selected points. 24-hour growth (expressed as microns/day) was measured as the average separation of curved lines converted to microns by dividing by the image magnification (pixels per micron).
Sections were cut the embedded blocks at depths separated by 100 microns and typically two fields were selected from each section to provide growth measurements at several spatially separated locations, from which averages of the growth measurements were obtained. Based on initial variance estimates, provisionally twelve measurements of each growth plate from different locations were measured and averaged.
Statistical methods
For group-wise comparisons, the growth of loaded and internal control growth plates for each animal were differenced and expressed as a percentage of the corresponding internal control value. (Thus 100% indicated unaltered growth relative to the control). These percentage values were then averaged for each species, age group, and anatomical location (provisionally five animals per group). For each loaded group, these mean values were then expressed as a difference from the mean value obtained in the respective sham group, to measure the degree of growth modulation in each group. Differences between the stress/growth-rate modulation relationship for groups of growth plates were examined by Analysis of Covariance. In these analyses the factors were: anatomical location (vertebra or proximal tibia); species (rat, rabbit, calf); age (younger versus older animals), with stress (corrected values based on measured growth plate values) included as the covariate. Linear regression analysis was used to obtain overall relationships between growth modulation and applied stress. Statistical observations having a probability less than 0.05 were considered significant.
RESULTS
There was a wide range in the rates of measured growth in the growth plates, with averages ranging from 30 microns/day for older rat vertebrae to 366 microns/day for younger rabbit proximal tibiae (Table 2). However, across species there was relatively little variation in growth at each anatomical site (tibiae and vertebrae) compared to the difference in size of the animals. In all cases the mean growth rate of compressed growth plates was decreased relative to the internal controls (Table 3). In most cases the growth plates under tensile stress had increased growth relative to controls (the two younger rats’ growth plates were the exception), but this finding was complicated by the ‘sham’ effect (altered growth associated with application of the loading apparatus, but without loads applied). Generally, the sham-loaded growth plates were observed to have lesser growth rates than their controls (Table 3). After compensating for the ‘sham’ effect by subtracting the mean value from each of the corresponding values for loaded growth plates, growth decreased on average by between −2 and 38 percent in the nominally −0.1 MPa compression groups, and decreased by between 19 and 61 percent in the nominally −0.2 MPa compression groups. It was increased by 2 to 36 percent for distracted growth plates (Figure 2).
Table 2.
Mean growth rates (and SD) for control growth plates, measured in μm per day. (N=provisionally 20)
| Younger Animals | Older Animals | |
|---|---|---|
| Rat Vertebra | 45 (8) [N=24] | 30 (8) [N=17] |
| Rat Tibia | 251 (29) [N=19] | 206 (51) [N=16] |
| Rabbit Tibia | 366 (42) [N=19] | 257 (42) [N=20] |
| Bovine Vertebra | 38 (13) [N=18] | - |
| Bovine Tibia | 179 (37) [N=18] | - |
Table 3.
Mean growth rate of loaded and control growth plates (μm per day, with values of the Standard Deviation in parentheses). The age is that of the animals at the time of growth measurement after administration of the second fluorochrome, i.e. seven days after installation of the loading apparatus. Group size was nominally five animals.
Negative stress = compression; 0 MPa=sham;
L= Loaded growth plates; C = Internal control growth plates
| Nominal Stress Group | |||||||||
|---|---|---|---|---|---|---|---|---|---|
| Species (age) | 0.1 MPa | 0 MPa | −0.1 MPa | −0.2 MPa | |||||
| C | L | C | L | C | L | C | L | ||
| Vertebrae | rat (45 days) | 46.7 (4.9) [N=7] | 46.3 (11) [N=7] | 46.6 (8) [N=5] | 44.5 (6) [N=5] | 39.5 (9) [N=4] | 32.1 (8) [N=4] | 44.0 (10) [N=8] | 24.3 (4) [N=8] |
| rat (65 days) | 22.5 (1.9) [N=3] | 26.4 (1) [N=3] | 28.8 (3) [N=5] | 27.3 (5) [N=5] | 33.4 (10) [N=5] | 28.5 (13) [N=5] | 31.1 (10) [N=4] | 20.8 (5) [N=4] | |
| calf (55 days) | 28.4 (7.2) [N=5] | 30.1 (9) [N=5] | 37.8 (7) [N=4] | 32.8 (7) [N=4] | 47.2 (15) [N=5] | 35.4 (6) [N=5] | 37.4 (14) [N=4] | 18.1 (10) [N=4] | |
| Tibiae | rat (45 days) | 244 (13) [N=4] | 226 (12) [N=4] | 256 (22) [N=5] | 231 (22) [N=5] | 236 (40) [N=4] | 162 (41) [N=4] | 261 (38) [N=6] | 187(44) [N=6] |
| rat (65 days) | 177 (12) [N=3] | 178 (13) [N=3] | 198 (12) [N=5] | 181 (5) [N=5] | 195 (35) [N=4] | 162 (37) [N=4] | 249(90) [N=4] | 147 (51) [N=4] | |
| rabbit (48 days) | 355 (33) [N=6] | 426 (16) [N=6] | 385 (34) [N=4] | 426 (33) [N=4] | 366 (56) [N=5] | 329 (77) [N=5] | 362 (52) [N=4] | 298 (25) [N=4] | |
| rabbit (69 days) | 228 (15) [N=5] | 284 (51) [N=5] | 255 (55) [N=5] | 285 (68) [N=5] | 267 (35) [N=5] | 261 (25) [N=5] | 278 (48) [N=5] | 190 (48) [N=5] | |
| calf (55 days) | 169 (33) [N=5] | 256 (57) [N=5] | 185 (42) [N=4] | 182 (44) [N=4] | 156 (37) [N=5] | 105 (36) [N=5] | 206 (24) [N=5] | 102 (17) [N=5] | |
Figure 2.
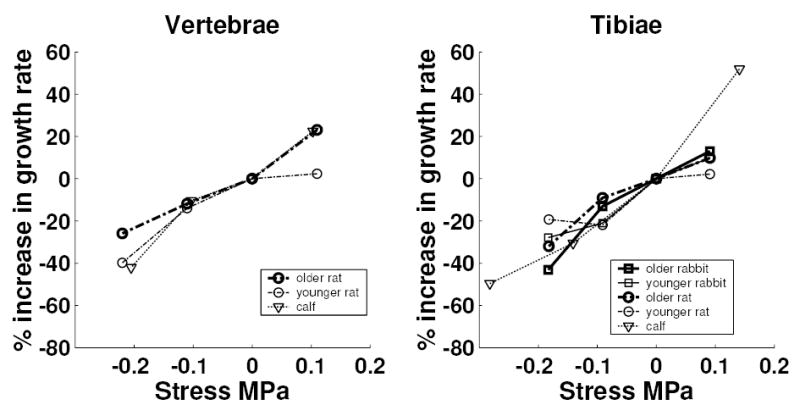
Relationship between applied stress and the percentage alteration in growth (relative to control) for the growth plates at 2 anatomical sites. The mean values from provisionally five animals are plotted. In each case, the mean values obtained from sham animals were subtracted (hence all mean values at 0 MPa are zero).
After subtracting the sham effect, the regression relationship between proportional modulation of growth and actual stress (growth-rate sensitivity to stress, as listed in Table 4) did not differ by species and age of animal, but was significantly greater in tibiae than vertebrae 18.6 and 15 percent per 0.1 MPa respectively). Overall (for all animals and anatomical locations) the growth-rate sensitivity to stress averaged 17.1% per 0.1 MPa.
Table 4.
Growth-rate sensitivity to stress (the gradient of the growth - stress relationships as shown in Figure 2) in each group of growth plates. The gradients were significantly different between anatomical locations (vertebrae versus proximal tibiae), but within each location gradients were not different between species, nor for younger versus older animals).
| Species | Growth plate | Gradient (percent per 0.1 MPa) | SE of gradient estimate |
|---|---|---|---|
| Calf | tail vertebra | 19.7 | 4.8 |
| Younger rat | tail vertebra | 13.0 | 1.9 |
| Older rat | tail vertebra | 14.1 | 3.0 |
| Calf | proximal tibia | 23.9 | 2.6 |
| Younger rat | proximal tibia | 9.2 | 2.0 |
| Older rat | proximal tibia | 15.1 | 1.9 |
| Younger rabbit | proximal tibia | 14.7 | 2.6 |
| Older rabbit | proximal tibia | 19.9 | 2.9 |
i.e. ß = 1.71 MPa−1 in a linear formulation G = Gm (1 + ß(σ − σm))
where: G = actual growth;
Gm = mean baseline growth (unaltered stress);
σ = actual stress on growth plate (compression negative);
σm = mean prevailing (baseline) stress on growth plate.
DISCUSSION
The relationship between actual stress and percentage growth modulation (percent difference between loaded and control growth plates) appeared to be linear, and quantitatively similar relationships were found for all three species, for different ages of animals, and at both anatomical locations, although a significant difference between tibiae and vertebrae was found. All groups had a significant correlation between growth alteration and stress. As expected, distraction accelerated growth and compression slowed growth. Doubling the compressive stress approximately doubled the proportional reduction in growth rate. These findings were consistent over a substantial range in the measured growth rates of control growth plates that averaged from 30 microns/day (older rat vertebrae) to 366 microns/day (younger rabbit proximal tibia). There was more variation evident between species in the growth modulation produced by distraction than by compression (Figure 2), and the reasons for this are not known. Thus, extrapolation from these findings to humans may be more reliable for growth plate compression than for distraction.
Extrapolation from the average rate of growth suppression of 17.1% per 0.1 MPa stress suggests that a sustained compressive stress of 0.6 MPa would result in a 100% reduction in growth rate, i.e. arrested growth, providing the stress-growth relationship follows the same linear relationship for higher compressive stresses. Studies directly addressing the stress required to arrest growth indicate values of 0.5 MPa [10], 1 MPa [12], more than 0.3 MPa [11], more than 0.5 MPa [13] and 0.15 MPa [14] (the last may be underestimated by bending of the pins).
It is generally accepted that the progression of scoliosis deformity and of tibia vara during growth is in part mechanically mediated by asymmetrical loading of growth plates. It is also possible that ‘overgrowth’ of immature limb bones after a fracture results from the unloading associated with pain and the favoring of that limb. Although usually attributed to vascular changes, clinical observations suggested that these are not necessarily a consistent explanation of the overgrowth phenomenon [21].
In these experiments the loading was constant (sustained over time). There is a much smaller effect of cyclic loading on growth [8,15,16]. Recent evidence [22] suggests that endochondral growth varies acutely and correlates inversely with activity level, but that over time the growth is relatively insensitive to cyclic loading. This differs from the mechanical stimulus required for bone remodelling (Wolff’s law), where the cyclic loading is thought to provide the mechanical stimulus [23].
The rate of endochondral growth in different growth plates has been found to depend on a combination of differing number and rate of proliferation of proliferative-zone cells, and differing amount of cell enlargement and matrix synthesis in the hypertrophic zone [24,25,26]. It was reported that sustained mechanical loading in this rat model (both vertebral and tibial growth plates) altered these parameters of growth plate activity [18], but the exact mechanisms of growth regulation and its mechanical modulation are not known.
The magnitude of the sustained stress imposed in these experiments (up to nominally 0.2 MPa of compression) was comparable with the alterations in the stresses acting on human growth plates in deformities such as scoliosis and tibia vara. Estimates of the normal physiological stresses acting on human vertebral end plates [27] are in the range 0.8 to 0.9 MPa, with differential compressive stress associated with the scoliosis curvature was on the order of +/− 10% of the total stress [28], i.e. about 0.1 MPa. Cook et al. [3] estimated that tibia vara increases the stress on the medial side of the tibia by up to 5 MPa, but this is likely an overestimate because of many simplifying assumptions about muscular activity. The compression forces acting on the rabbit knee have been estimated to be about 3 times bodyweight when hopping [29], implying a stress at the growth plate of about 0.5 MPa. The mean ultimate tensile stress of 5-month-old bovine growth plates was reported as 1.4 MPa [30].
In these animal studies it was initially assumed that the experimentally imposed forces were superimposed on (and did not alter) the prevailing physiological forces. The observed sham effect, which was significant, implied that the application of the apparatus alone did alter the underlying growth. This sham effect may have been due to altered loading of the growth plate associated with altered activity levels, or altered blood flow or other consequences of the surgical insult. The sham effect had to be taken into account in the analysis of the growth-modulation effect. In most cases sham operated growth plates had decreased growth, with rabbit proximal tibiae being the exception. The duration of the experiments was one week, with this time-frame based on known rates of chondrocyte turnover [26]. However, it may have exaggerated sham effects that might have been reduced after longer duration of postoperative healing. It was assumed that there was no alteration of the loading of control growth plates. In the tibiae there might have been some gait or other activity changes, and limitation of the use of the tail that could confound this assumption. The only subjective observations of such altered behavior was a ‘circumduction’ gait in the rats, and some limping in the calves.
For vertebral and tibial growth plates we relied on the stiffness of epiphyseal bone (as well as diaphyseal bone) to redistribute the forces applied through the transecting pins. Also, the apparatus was installed to distribute the loading springs as equally as possible around the growth plate.
The growth rates in the present series of experiments were in the range 30 to 366 microns per day, in three species that complete their skeletal growth more rapidly than humans. Spinal growth in human children is approximately 10 mm per year or 27 microns per day for the entire spine (averaging about 1 micron per day for each of 34 thoracic and lumbar growth plates) [31], with higher values to be expected during growth spurts. Spinal growth was estimated to be about 20 microns per day at age 8, and 10 microns per day at age 13 [32]. For the human proximal tibia, the growth averages about 10 mm per year or 27 microns per day [31]. Therefore, these experiments in young, rapidly growing animals correspond to growth rates that are generally higher than that seen in post-natal human growth. Skeletal maturation takes longer in humans relative to all three experimental animal species, e.g. by a factor of about 20 in rabbits [33].
The rationale for conservative management of progressive deformities during skeletal growth assumes a biomechanical mode of deformity progression (Hueter-Volkmann principle) [1,2,3]. The present study provides a quantitative basis for understanding the mechanisms underlying the natural history and management of these conditions. Based on the consistency of the growth modulation effect measured in non-human species it is anticipated that the findings can be applied to estimate the expected response of any human growth plate to a specific stress level.
Acknowledgments
Supported by NIH grant R01 AR 46543. Some apparatus used in experiments with calves was loaned by EBI (Parsippany NJ) and by Smith & Nephew Richards (Memphis TN). Statistical analyses were performed by Takamaru Ashikaga, Ph.D.
References
- 1.Roaf R. Vertebral growth and its mechanical control. J Bone Joint Surg Br. 1960;42:40–59. doi: 10.1302/0301-620X.42B1.40. [DOI] [PubMed] [Google Scholar]
- 2.Stokes IAF, Spence H, Aronsson DD, et al. Mechanical modulation of vertebral body growth: implications for scoliosis progression. Spine. 1996;21(10):1162–1167. doi: 10.1097/00007632-199605150-00007. [DOI] [PubMed] [Google Scholar]
- 3.Cook SD, Lavernia CJ, Burke SW, et al. A biomechanical analysis of the etiology of tibia vara. J Pediatr Orthop. 1983;3(4):449–454. doi: 10.1097/01241398-198309000-00006. [DOI] [PubMed] [Google Scholar]
- 4.Hueter C. Anatomische Studien an den Extremitaetengelenken Neugeborener und Erwachsener. Virkows Archiv Path Anat Physiol. 1862;25:572–599. [Google Scholar]
- 5.Volkmann R. 1882. Verletzungen und Kankenheiten der Bewegungsorgane. In: von Pitha FR, Billroth T: Handbuch der allgemeinen und speciellen Chirurgie Bd II Teil II. Stuttgart: Ferdinand Enke.
- 6.Delpech JM. 1828. de l’orthomorphie par rapport à l’espèce humaine. Paris: Gabon.
- 7.Porter RW. The effect of tension across a growing epiphysis. J Bone Joint Surg Br. 1978;60:252–255. doi: 10.1302/0301-620X.60B2.659475. [DOI] [PubMed] [Google Scholar]
- 8.Robling AG, Duijvelaar KM, Geevers JV, et al. Modulation of appositional and longitudinal bone growth in the rat ulna by applied static and dynamic force. Bone. 2001;29(2):105–113. doi: 10.1016/s8756-3282(01)00488-4. [DOI] [PubMed] [Google Scholar]
- 9.Wilson-MacDonald J, Houghton GR, Bradley J, et al. The relationship between periosteal division and compression or distraction of the growth plate. An experimental study in the rabbit. J Bone Joint Surg Br. 1990;72(2):303–308. doi: 10.1302/0301-620X.72B2.2312573. [DOI] [PubMed] [Google Scholar]
- 10.Strobino LJ, Colonna PC, Brodey RS, et al. The effect of compression on the growth of epiphyseal bone. Surg Gynecol Obstet. 1956;105:85–93. [PubMed] [Google Scholar]
- 11.Bonnel F, Peruchon E, Baldet P, et al. Effects of compression on growth plates in the rabbit. Acta Orthop Scand. 1983;54:730–3. doi: 10.3109/17453678308996619. [DOI] [PubMed] [Google Scholar]
- 12.Bylski-Austrow DI, Wall EJ, Rupert MP, et al. Growth plate forces in the adolescent human knee: a radiographic and mechanical study of epiphyseal staples. J Pediatr Orthop. 2001;21(6):817–823. [PubMed] [Google Scholar]
- 13.Safran MR, Eckardt JJ, Kabo JM, et al. Continued growth of the proximal part of the tibia after prosthetic reconstruction of the skeletally immature knee. Estimation of the minimum growth force in vivo in humans. J Bone Joint Surg Am. 1992;74:1172–9. [PubMed] [Google Scholar]
- 14.Sijbrandij S. Inhibition of tibial growth by means of compression of its proximal epiphysial disc in the rabbit. Acta Anat (Basel) 1963;55:278–285. doi: 10.1159/000142474. [DOI] [PubMed] [Google Scholar]
- 15.Niehoff A, Kersting UG, Zaucke F, et al. Adaptation of mechanical, morphological, and biochemical properties of the rat growth plate to dose-dependent voluntary exercise. Bone. 2004;35(4):899–908. doi: 10.1016/j.bone.2004.06.006. [DOI] [PubMed] [Google Scholar]
- 16.Ohashi N, Robling AG, Burr DB, Turner CH. The effects of dynamic axial loading on the rat growth plate. J Bone Miner Res. 2002;17(2):284–292. doi: 10.1359/jbmr.2002.17.2.284. [DOI] [PubMed] [Google Scholar]
- 17.Masoud I, Shapiro F, Kent R, et al. A longitudinal study of the growth of the New Zealand white rabbit: cumulative and biweekly incremental growth rates for body length, body weight, femoral length, and tibial length. J Orthop Res. 1986;4(2):221–31. doi: 10.1002/jor.1100040211. [DOI] [PubMed] [Google Scholar]
- 18.Stokes IA, Gwadera J, Dimock A, et al. Modulation of vertebral and tibial growth by compression loading: diurnal versus full-time loading. J Orthop Res. 2005;23:188–195. doi: 10.1016/j.orthres.2004.06.012. [DOI] [PubMed] [Google Scholar]
- 19.Aronsson DD, Stokes IAF, Rosovsky J, et al. Mechanical modulation of calf tail vertebral growth: implications for scoliosis progression. J Spinal Disorders. 1999;12(2):141–146. [PubMed] [Google Scholar]
- 20.Hunziker EB, Herrmann W, Schenk RK. Improved cartilage fixation by ruthenium hexaamine trichloride (RHT). A prerequisite for morphometry in growth cartilage. J Ultrastruct Res. 1982;81(1):1–12. doi: 10.1016/s0022-5320(82)90036-3. [DOI] [PubMed] [Google Scholar]
- 21.de Pablos J, Franzreb M, Barrios C. Longitudinal growth pattern of the radius after forearm fractures conservatively treated in children. J Pediatr Orthop. 1994;14(4):492–495. doi: 10.1097/01241398-199407000-00013. [DOI] [PubMed] [Google Scholar]
- 22.Noonan KJ, Farnum CE, Leiferman EM, et al. Growing pains: are they due to increased growth during recumbency as documented in a lamb model? J Pediatr Orthop. 2004;24(6):726–31. doi: 10.1097/00004694-200411000-00024. [DOI] [PubMed] [Google Scholar]
- 23.Rubin CT, Lanyon LE. Osteoregulatory nature of mechanical stimuli: Function as a determinant for adaptive remodeling in bone. J Orthop Res. 1987;5:300–31. doi: 10.1002/jor.1100050217. [DOI] [PubMed] [Google Scholar]
- 24.Apte SS, Kenwright JJ. Physeal distraction and cell proliferation in the growth plate. J Bone Joint Surg Br. 1994;76(5):837–843. [PubMed] [Google Scholar]
- 25.Hunziker EB, Schenk RK. Physiological mechanisms adopted by chondrocytes in regulating longitudinal bone growth in rats. J Physiol. 1989;414:55–7. doi: 10.1113/jphysiol.1989.sp017676. [DOI] [PMC free article] [PubMed] [Google Scholar]
- 26.Wilsman NJ, Farnum CE, Leiferman EM, et al. Differential growth by growth plates as a function of multiple parameters of chondrocytic kinetics. J Orthop Res. 1996;14(6):927–936. doi: 10.1002/jor.1100140613. [DOI] [PubMed] [Google Scholar]
- 27.Nachemson AL. Disc pressure measurements. Spine. 1981;6(1):93–97. doi: 10.1097/00007632-198101000-00020. [DOI] [PubMed] [Google Scholar]
- 28.Stokes IAF, Gardner-Morse M. Muscle activation strategies and symmetry of spinal loading in the lumbar spine with scoliosis. Spine. 2004;29(19):2103–2107. doi: 10.1097/01.brs.0000141182.42544.1f. [DOI] [PubMed] [Google Scholar]
- 29.Gushue DL, Houck J, Lerner AL. Rabbit knee joint biomechanics: motion analysis and modeling of forces during hopping. J Orthop Res. 2005;23(4):735–742. doi: 10.1016/j.orthres.2005.01.005. [DOI] [PubMed] [Google Scholar]
- 30.Williams JL, Do PD, Eick JD, et al. Tensile properties of the physis vary with anatomic location, thickness, strain rate and age. J Orthop Res. 2001;19(6):1043–1048. doi: 10.1016/S0736-0266(01)00040-7. [DOI] [PubMed] [Google Scholar]
- 31.Diméglio A. 2001. Growth in Paediatric Orthopaedics. In: Morrissy RT and Weinstein SL (Eds). Lovell and Winter’s Pediatric Orthopaedics 5th Ed. Philadelphia: Lippincott Williams and Wilkins, pp 33–62
- 32.Stokes IA, Windisch L. 2006. Vertebral height growth predominates over intervertebral disc height growth in adolescents with scoliosis. Spine (At press, to be published 15th June 2006). [DOI] [PMC free article] [PubMed]
- 33.Heikel HV. On ossification and growth of certain bones of the rabbit; with a comparison of the skeletal age in the rabbit and in man. Acta Orthop Scand. 1960;29:171–184. doi: 10.3109/17453675908988796. [DOI] [PubMed] [Google Scholar]