Abstract
Pharmaceutical compounds are molecular solids that frequently exhibit polymorphism of crystal form. One high profile case of polymorphism was ritonavir, a peptidomimetic drug used to treat HIV-1 infection and introduced in 1996. In 1998, a lower energy, more stable polymorph (form II) appeared, causing slowed dissolution of the marketed dosage form and compromising the oral bioavailability of the drug. This event forced the removal of the oral capsule formulation from the market. We have carried out high-throughput crystallization experiments to comprehensively explore ritonavir form diversity. A total of five forms were found: both known forms and three previously unknown forms. The novel forms include a metastable polymorph, a hydrate phase, and a formamide solvate. The solvate was converted to form I via the hydrate phase by using a simple washing procedure, providing an unusual route to prepare the form I “disappearing polymorph” [Dunitz, J. D. & Bernstein, J. (1995) Acc. Chem. Res. 28, 193–200]. Crystals of form I prepared by using this method retained the small needle morphology of the solvate and thus offer a potential strategy for particle size and morphology control.
Crystalline polymorphism, or the ability of a compound to exist in multiple solid-state structures (1, 2), has significant impact on the physical properties, performance, and safety of an active pharmaceutical ingredient (API) and its formulated product(s). Hence, control of drug substance polymorphism is of major importance in drug discovery and development and is monitored carefully by the regulatory agencies. Thorough understanding of the relationship between the physical form and the physicochemical and/or functional properties of an API is critical in selecting the most suitable form for development into a drug product. However, standard industry methods of solid form discovery rely on manual processes that are time consuming and often limited in scope because of the small amounts of material available at early stages of development. To overcome these challenges, high-throughput crystallization systems have been developed (3–5) permitting rapid and more comprehensive exploration of solid form diversity with only small amounts (<1 mg per trial) of API. Such systems also facilitate evaluation of the utility of all possible physical forms of a drug substance, enable rapid selection of the optimal solid form, and, thus, can accelerate the development process while minimizing the risk of downstream form-related manufacturing and performance issues (2).
Ritonavir [Norvir, Abbott Laboratories, North Chicago, IL (5S,8S,10S,11S)-10-hydroxy-2-methyl-5-(1-methylethyl)-1-[2-(1-methylethyl)-4-thiazolyl]-3,6-dioxo-8,11-bis(phenylmethyl)-2,4,7,12-tetraazatridecan-13-oic acid 5-thiazolylmethyl ester] is an important AIDS drug (6, 7) that garnered much attention when a previously unknown, thermodynamically more stable polymorph appeared unexpectedly, having serious implications for the marketed product and the patients taking the drug. During development and initial manufacture of ritonavir, only one monoclinic crystal form was known (8). This solid form, now known as form I, was not sufficiently bioavailable in the solid state by the oral route, requiring the product norvir to be formulated as a capsule filled with a hydroalcoholic solution containing the dissolved drug (8). Two years after entry into the market, several lots of norvir capsules began failing dissolution specifications. Evaluation of the failed drug products revealed that a second crystal form of ritonavir (form II) had precipitated from the formulation (8). This form was < 50% as soluble as form I, resulting in the observed poor dissolution behavior and eventual withdrawal of the capsule from the market. Substantial effort went into understanding the nature of the polymorphic shift (7), reformulating the drug (9), and identifying strategies to regenerate the original form I (10). At some considerable cost§ a new formulation of norvir was eventually developed and launched.
The ritonavir polymorphic shift illustrates the need for early and comprehensive identification of solid-form diversity of APIs. In this study, the polymorphic behavior of ritonavir was explored by using CrystalMax, a high-throughput crystallization platform, with the aim of finding known and novel crystal forms of the drug as a test model for the use of the system. Polymorph screens consisting of ≈2,000 experiments were carried out with ≈2 g of the API. We report here the discovery of three additional crystalline forms of ritonavir. These forms were found along with both known forms I and II, which were obtained from previously unreported solvent mixtures. Form III is a crystalline solvate that converts to form V, a previously unknown hydrated phase, upon exposure to aqueous medium. Form V in turn converts spontaneously to needle-like form I crystals. The process of preparing form I from III is an unusual route to a “disappearing polymorph” (13) and provides a novel strategy for control of particle size and morphology. Form IV is a true, unsolvated, metastable polymorph of ritonavir. This study highlights the benefits of high-throughput crystallization for solid-form discovery and the importance of exploring large numbers of parallel crystallization trials to comprehensively characterize form diversity of APIs.
Materials and Methods
An overview of the high-throughput polymorph screening process is illustrated in Scheme S1. These experiments involved a total of over 2,000 crystallization attempts in a 96-vessel format with a range of 1–10 mg of drug per tube, yielding ritonavir concentrations of 20, 60, 120, and 200 mg/ml at a total solvent well volume of 50 μl. Proprietary experimental design software (InForm) was used to define the combinatorial test conditions based on solvent selection from a library of 24 diverse solvents, listed in Solvents, which is published as supporting information on the PNAS web site, www.pnas.org. Solvents used in this study exhibited a broad range of chemical functionality and were selected from the GRAS (generally recognized as safe) list based on a set of physical properties and calculated descriptors that are important in describing and effecting intermolecular interactions (e.g., Hildebrand and Hansen solubility parameters, log P, hydrophile–lipophile balance, boiling point, and melting point). Screens were conducted with both single solvents and binary solvent mixtures of various composition ratios (i.e., 25/75, 50/50, and 75/25 by volume). Each sample composition was prepared in triplicate.
Scheme 1.
Methods used to isolate ritonavir from Norvir oral solution are provided in Ritonavir Isolation, which is published as supporting information on the PNAS web site. Isolated ritonavir was dissolved in methanol to form a 100 mg/ml ritonavir stock solution. Samples for the high-throughput screen were prepared by using a TECAN MiniPrep 75 minisample processor (Durham, NC) to deposit an appropriate aliquot of ritonavir stock solution into individual vials. A TurboVap 96 concentration workstation (Zymark, Hopkinton, MA), set at 70°C, was used to evaporate the methanol, yielding dried ritonavir solids. A SynQUAD dispenser (Cartesian Technologies, Irvine, CA), controlled by AxSys software, was used to combinatorially dispense the amounts of solvents required to obtain the desired sample compositions. Vials were subsequently crimp-sealed by using caps lined with polytetrafluoroethylene (PTFE)-coated rubber septa to prevent evaporation and contamination. Samples were heated to 70°C to dissolve the ritonavir solid (≈30–60 min). Not all solvent combinations were capable of fully solubilizing the solids, resulting in vials that contained undissolved solids after the heating cycle. These samples were flagged to aid interpretation of the experimental results. Supersaturation in the remaining wells was generated by cooling the samples at a rate of ≈5°C/min to 5°C. The samples were incubated at this temperature and monitored for crystallization over a 4-week period by using an automated optical scanning station, which periodically elevated rows of vials from the block, then illuminated and imaged them with the aid of a charge-coupled device (CCD) camera. Samples that crystallized were removed from the original array, the solvent was removed by aspiration, and the residue was dried with flowing nitrogen.
Optical imaging and in situ Raman spectroscopy were used to characterize newly formed crystals. Methods used to acquire Raman spectra are provided in Raman Spectroscopy, which is published as supporting information on the PNAS web site. Raman spectra were compared by using an automated analysis sequence and classified into clusters that represent different forms by using proprietary cheminformatics analysis tools. The automated comparison of Raman spectra was done as follows: (i) baseline filtering of the spectra by using a match filter algorithm; (ii) Raman shift assignment for each peak; (iii) peak comparison, looking for the presence and absence of shifts; and (iv) calculation and visualization of the Tanimoto distance coefficients for each pair of spectra in the data set. The Tanimoto distance coefficient, Tm, is defined as 1 − [Nab/(Na + Nb − Nab)], where Nab is the number of peaks in both spectrum a and spectrum b, Na is the number of peaks in spectrum a, and Nb is the number of peaks in spectrum b. Form assignments were confirmed by powder x-ray diffraction (PXRD), differential scanning calorimetry (DSC), thermogravimetric analysis (TGA), and optical microscopy, in selected cases. Methods used to perform these characterization techniques are published as supporting information on the PNAS web site.
Each of the novel forms found by means of high-throughput crystallization was scaled up to multiple milligram and gram levels. Compositions used to scale up the amounts of each of these forms are provided in Table 1. In each case, the appropriate amount of each constituent was deposited into a vial and the vial was crimp-capped. For the solvate and novel polymorph, scale-up samples were processed as outlined above for the high-throughput screen samples. Although stirring could have been used during the thermal processing, it was not used in this example. Crystals were removed from the supernatant by filtration, and were then air dried and characterized as described for the screen samples. In the case of the hydrated phase of ritonavir, 50 mg of the formamide solvate was placed on filter paper in a Büchner funnel connected to a vacuum flask. While vacuum was applied, 10 ml of deionized water was slowly poured over the solid ritonavir (III). The resulting material on the filter was dried over vacuum for ≈15 min and characterized immediately. Each of the novel forms of ritonavir was characterized by Raman spectroscopy, PXRD, DSC, and TGA. Solvated samples were characterized by solution-phase proton NMR spectroscopy. Methods used to perform NMR spectroscopy are provided in Proton NMR Spectroscopy, which is published as supporting information on the PNAS web site.
Table 1.
Compositions used to scale up amounts of ritonavir crystal forms
| Form | Amount of ritonavir, mg | Total solvent volume, μl | Solvent 1 | Volume of solvent 1, μl | Solvent 2 | Volume of solvent 2, μl |
|---|---|---|---|---|---|---|
| III | 100 | 500 | Formamide | 375 | Toluene | 125 |
| III | 100 | 500 | Formamide | 375 | Butyl acetate | 125 |
| III | 100 | 500 | Formamide | 375 | Acetone | 125 |
| IV | 100 | 500 | Acetonitrile | 125 | Butyl acetate | 375 |
| IV | 100 | 500 | Acetonitrile | 250 | Isobutyl acetate | 250 |
| IV | 100 | 500 | Acetonitrile | 250 | Isopropyl acetate | 250 |
| V | 50 (form III) | 10,000 | Deionized water | 10,000 |
Results and Discussion
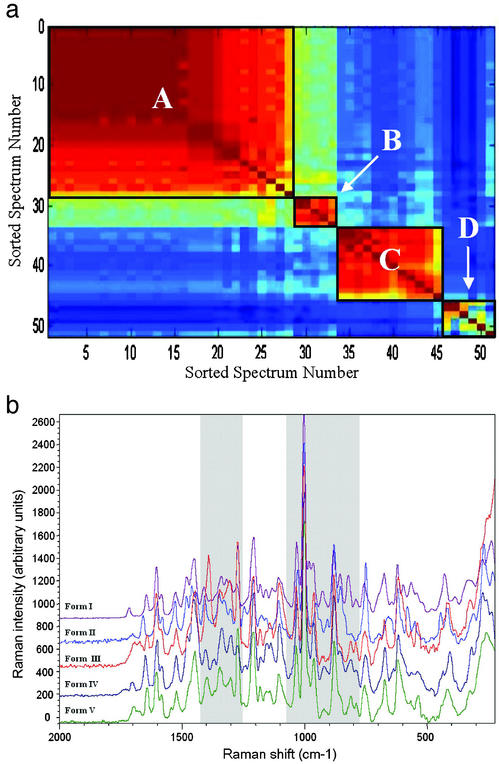
The high-throughput polymorph screen of ritonavir resulted in generation of 51 crystalline samples, giving a 2.5% hit rate. The Raman spectrum of each of these samples was filtered to remove background signal and noise by using proprietary software. Each filtered spectrum was compared with that of every other sample, and a similarity coefficient (i.e., Tanimoto distance coefficient) was calculated for all pairs of spectra by using QForm, a proprietary cheminformatics software suite. The coefficients were sorted, color-mapped, and displayed as an n-by-n matrix by sorted spectrum number for easy visualization for all samples resulting from the high-throughput polymorph screen, as shown in Fig. 1a. Clusters of similar spectra are indicated by warm-colored (reds) regions. Each cluster represents a distinct solid form, as differentiated by Raman spectroscopy. Note, the Tanimoto values and associated colors of the off-diagonal elements relating any two samples in opposite regions (e.g., samples 5 vs. 50) indicate lack of similarity between the sample regions. Fig. 1a reveals four clusters or regions of spectral similarity for samples resulting from the high-throughput screen. The clusters are represented by sorted sample numbers 1–28, 29–33, 34–45, and 46–51 and are labeled A–D, respectively, in Fig. 1a. The identification of these four clusters indicates that at least four distinct solid forms of ritonavir were generated. The filtered Raman spectra of representative samples from each cluster are shown in Fig. 1b, where the Raman intensity is plotted as a function of Raman shift. The main regions where differences are observed in the spectra are highlighted. An interesting feature of Raman spectroscopy, unlike PXRD or other common techniques, is the ability to monitor for solvent peaks used in processing a sample, allowing samples that may be solvates to be flagged. For example, broadening of the spectral features at 1,085 and 1,385 cm−1 in Fig. 1b for form III corresponds to the peaks observed for formamide, a solvent used in the composition yielding this form. Clearly, Raman spectroscopy is sensitive to the subtle differences in solid form structure, and the binning methods used are a convenient, rapid, and selective method to classify large sets of Raman spectra output from the high-throughput crystallization screens.
Figure 1.
(a) Raman cluster diagram showing n-by-n matrix of sorted spectrum numbers for all samples resulting from the high-throughput polymorph screen of ritonavir. Clusters are indicated by warm-colored (reds) regions, which have been outlined to guide the eye. (b) Filtered Raman spectra of representative samples from each cluster.
On the basis of the cluster assignments illustrated in Fig. 1a, several samples from each cluster were chosen for further characterization and solid form validation using PXRD, DSC, and TGA. The crystalline solids from cluster A exhibited a melting onset at ≈113 ± 0.5°C with a peak endotherm of ≈122 ± 0.5°C and show no significant weight loss before the onset of decomposition at ≈150°C, corresponding to form I as described in the literature (8). Samples in cluster C are comparable to form II, which has a melting point onset at ≈116 ± 0.5°C with a peak endotherm of ≈122 ± 0.5°C. PXRD patterns obtained for samples in clusters A and C correspond to those of form I and form II, respectively, as reported by Chemburkar et al. (10) and Bauer et al. (8). Representative characterization data for cluster A (form I) and cluster C (form II) are provided in Figs. 7 and 8, respectively, which are published as supporting information on the PNAS web site.
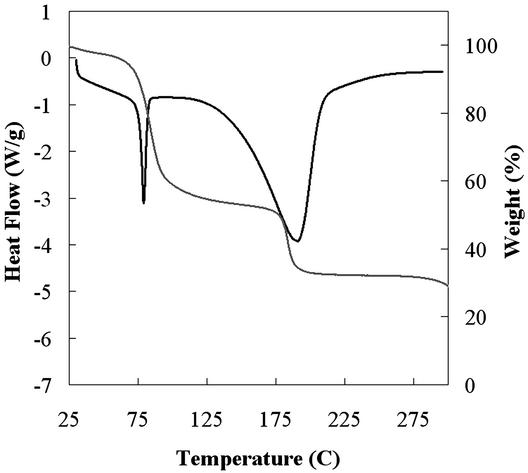
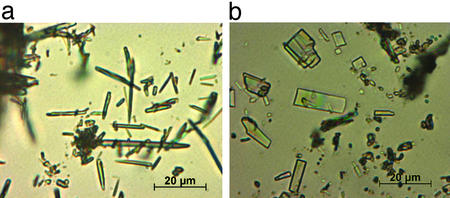
The samples that make up cluster D are crystalline solids that melt irreversibly in the range of 78–82°C (Fig. 2). This range is significantly lower than the melting points of the known forms of ritonavir and is accompanied by significant and variable weight loss of up to 30–60% upon melting (Fig. 2). The weight loss suggests the samples are solvated, and given the variability of the weight loss observed, the solvate is likely a nonstoichiometric solvate that can accommodate various amounts of solvent molecules within the structure (14, 15). Despite the low melting point, samples of form III show physical stability at room temperature in sealed vials for at least 3 months. In addition, heating of a sample of form III to 50°C on a microscope hot-stage and observation for up to 12 h reveals no significant change of the sample, which begins to melt at 78°C once the temperature is raised further. The form III crystals produced were needle-shaped as observed by optical microscopy, with a long axis measuring ≈1–5 μm, as shown in Fig. 3a, and were too small for x-ray crystal structure analysis.
Figure 2.
Overlay plot of DSC and TGA curves for a representative sample from cluster D from Fig. 1a, where heat flow (black) and percent weight loss (gray) are plotted as a function of temperature. Percent weight loss varied from 30% to 60%. Cluster identified as form III of ritonavir.
Figure 3.
(a) Optical photomicrograph of needle-shaped form III crystals. The long axis is ≈1–5 μm. (b) Optical photomicrograph of lath-shaped form IV crystals.
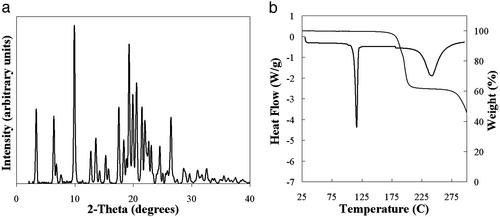
A fourth crystal form of ritonavir is represented by samples in cluster B. A unique PXRD pattern was observed for these samples, which exhibited a sharp melt transition at ≈116°C and no significant loss of volatile matter up to 150°C (Fig. 4). These observations point to the form being unsolvated and, thus, a true polymorphic crystal form of ritonavir. Optical microscopy showed that, similar to form I, the crystals of form IV have a lath morphology, as illustrated in Fig. 3b.
Figure 4.
Data for a representative sample from cluster B from Fig. 1a. (a) PXRD pattern where intensity is plotted as a function of 2θ. (b) Overlay plot of DSC and TGA curves where heat flow (black) and percent weight loss (gray) are plotted as a function of temperature. Cluster identified as form IV of ritonavir.
The solvent compositions used to generate the samples in each cluster, corresponding to each solid form of ritonavir, were inspected. No significant trends with solvent composition were observed for forms I and II, but each instance generally contained at least one acetate solvent. Two features that are unique to the making of form III were identified: (i) formamide (HCONH2) was present as a major solvent component (75%) in all cases, and (ii) a second solvent that is immiscible with formamide was present in the mixture (e.g., toluene, acetone, or butyl acetate). Similarly, the compositions producing form IV always contained 25–50% acetonitrile with the balance consisting of an acetate (e.g., isopropyl, isobutyl, or butyl acetate). These conditions were successfully used to scale up crystallization of each of the novel forms to provide hundreds of milligrams of material (see Materials and Methods) for further characterization. The preferred crystallization procedure for form III involves the use of toluene as the second solvent and mixing, which yields an emulsion-based method for preparing the desired product. The particle size of the resulting form III was consistently small, as might be expected from an interfacial crystallization process (16).
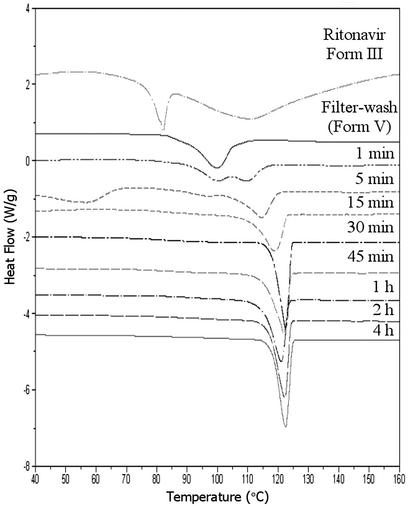
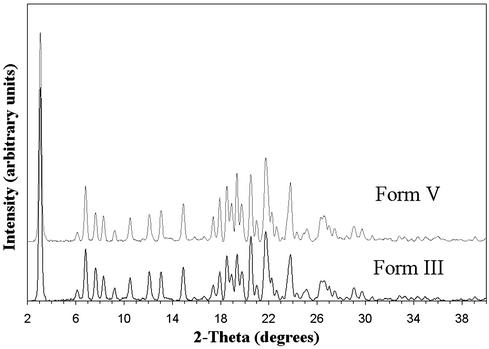
Aqueous washing of form III lead to solvent exchange, presumably because of the similarity between the formamide and water,¶ resulting in modification of the physical properties of the crystals. This solvent exchange was monitored by DSC analysis, as shown in Fig. 5, where the heat flow is plotted as a function of temperature for samples washed for various amounts of time. The melting endotherm was observed to shift to higher temperature with increasing exposure time in water. When the exposure time was 1 min or less, a novel form (form V) of ritonavir was produced which is characterized by a DSC melting endotherm at 97°C. This form retains the small needle shape of form III. Solution proton NMR of the washed material in CDCl3 revealed the absence of formamide, whereas TGA showed the loss of 6.5% mass attributed to water. These data suggest that a hydrate with a stoichiometry of approximately three water molecules per drug molecule was produced by complete exchange of water for formamide in the form III structure. Despite the unique thermal properties of the intermediate form V (see Fig. 5), the PXRD patterns of the forms III and V are essentially superimposable, as shown in Fig. 6, indicating temporary preservation of the crystal lattice. After 0.5 hr of exposure to water or 0.1 M HCl, form III converts via form V, to form I, as indicated by the 123°C melting point and PXRD pattern, which coincides with that of form I. Interestingly, the transformation of the solvate form III to form I, an anhydrous polymorph, through a hydrate requires the loss of water from the structure while in aqueous medium. This observation suggests that the intermediate hydrated form collapses to a more compact structure of significantly greater stability. Supernatant measurements during the equilibration process in 0.1 M HCl show an increase in apparent solubility of ≈1.5-fold during the first 15 min; however, the measured solubility after 30 min approximates that of form I, as expected on the basis of the observed conversion of form III to form I.
Figure 5.
DSC analysis for form III samples after exposure to water for various amounts of time at room temperature.
Figure 6.
PXRD patterns of form III and form V.
Crystals of form III were too small to allow single-crystal x-ray structure determination. Therefore, the PXRD traces in Fig. 6 were used to provide an initial indexing of the structures of forms III and V. The most likely unit cell is a monoclinic structure, which is slightly expanded relative to form I (8). The similarity between the proposed cell and that of form I suggests that a “blueprint” of the latter crystal form is embedded in the structures of forms III and V. The crystallization of ritonavir as form III and subsequent water exchange is therefore an unusual route to the “disappearing polymorph” (13) form I. Form I crystals thus obtained exist as very small, needle-like particles, which is a fundamentally different habit from the lath crystals previously described (10). The strategy of preparing form I by form III water exchange can therefore also be viewed as an example of particle size and morphology engineering of a crystal polymorph.
A summary of the known forms of ritonavir is presented in Table 2. Several conclusions can be drawn: (i) Form II remains the most stable of the known forms of ritonavir; (ii) a formamide solvate, form III, has been prepared and characterized; (iii) a trihydrate, form V, is obtained from exposing the form III to aqueous conditions; (iv) form V transforms readily to form I; and (v) form IV is a previously unreported polymorph of ritonavir. As a result of this parallel crystallization study, the number of known forms of ritonavir has more than doubled. The conclusions emphasize the advantage of combining parallel high-throughput crystallization experimentation with detailed physicochemical analyses to identify the diversity of solid forms in which a given molecule can exist (2). The issue of polymorphism control is of paramount importance in the area of pharmaceuticals, where functional properties of solid-state materials are the subject of detailed scrutiny and regulatory control. Our vision is to use the large amount of form diversity data generated by the high-throughput crystallization system to elucidate the factors that affect crystallization of particular forms.
Table 2.
Comparison of physical parameters of ritonavir crystal forms
Supplementary Material
Acknowledgments
We thank Ms. Liliana Gomez and Dr. Michael Read for technical assistance, and Drs. Colin Gardner, Matthew Peterson, and David Putnam for support and discussions.
Abbreviations
- API
active pharmaceutical ingredient
- PXRD
powder x-ray diffraction
- TGA
thermal gravimetric analysis
- DSC
differential scanning calorimetry
Footnotes
References
- 1.McCrone W C. In: Physics and Chemistry of the Organic Solid State. Fox D, Labes M M, Weissberger A, editors. Vol. 2. New York: Wiley; 1965. pp. 725–767. [Google Scholar]
- 2.Grant D J W. In: Polymorphism in Pharmaceutical Solids, Drugs and the Pharmaceutical Sciences. Brittain H, editor. Vol. 95. New York: Dekker; 1999. pp. 1–33. [Google Scholar]
- 3.Peterson M L, Morissette S L, McNulty C, Goldsweig A, Shaw P, LeQuesne M, Monagle J, Encina N, Marchionna J, Johnson A, et al. J Am Chem Soc. 2002;124:10958–10959. doi: 10.1021/ja020751w. [DOI] [PubMed] [Google Scholar]
- 4.Gardner C, Almarsson Ö, Chen H, Morissette S, Peterson M, Zhang Z, Wang S, Lemmo T, Gonzalez-Zugasti J, Monagle J, et al. In: Proceedings of the Fourth International Conference on Foundations of Computer-Aided Process Operations. Grossmann I E, McDonald C M, editors. 2003. in press. [Google Scholar]
- 5. Chen, H., Read, M., Morissette, S. & Gardner, C. (2003) Targets, in press.
- 6.Ho D D, Neumann A U, Perelson A S, Chen W, Leonard J M, Markowitz M. Nature. 1995;373:123–126. doi: 10.1038/373123a0. [DOI] [PubMed] [Google Scholar]
- 7.Kempf D J, Marsh K C, Denissen J F, McDonald E, Vasavanonda S, Flentge C A, Green B E, Fino L, Park C H, Kong X, et al. Proc Natl Acad Sci USA. 1995;92:2484–2488. doi: 10.1073/pnas.92.7.2484. [DOI] [PMC free article] [PubMed] [Google Scholar]
- 8.Bauer J, Spanton S, Henry R, Quick J, Dziki W, Porter W, Morris J. Pharm Res. 2001;18:859–866. doi: 10.1023/a:1011052932607. [DOI] [PubMed] [Google Scholar]
- 9.Law D, Krill S L, Schmitt E A, Fort J J, Qiu Y, Wang W, Porter W R. J Pharm Sci. 2001;90:1015–1025. doi: 10.1002/jps.1054. [DOI] [PubMed] [Google Scholar]
- 10.Chemburkar S R, Bauer J, Deming K, Spiwek H, Patel K, Morris J, Henry R, Spanton S, Dziki W, Porter W, et al. Org Proc Res Dev. 2000;4:413–417. [Google Scholar]
- 11. Anonymous (July 27, 1998) PR Newswire.
- 12. Anonymous (August 3, 1998) Marketletter Ltd.
- 13.Dunitz J D, Bernstein J. Acc Chem Res. 1995;28:193–200. [Google Scholar]
- 14.Byrn S R, Pfeiffer R R, Stowell J G. Solid-State Chemistry of Drugs. West Lafayette, IN: SSCI; 1999. pp. 23–25. [Google Scholar]
- 15.Chen L R, Young V G, Lechuga-Ballesteros D, Grant D J W. J Pharm Sci. 1999;88:1191–1200. doi: 10.1021/js9900710. [DOI] [PubMed] [Google Scholar]
- 16.Allen K, Davey R J, Ferrari E, Towler C, Tiddy G J, Jones M O, Pritchard R G. Cryst Growth Des. 2002;2:523–527. [Google Scholar]
- 17.Lide D R, editor. CRC Handbook of Chemistry and Physics. 83rd Ed. Boca Raton, FL: CRC Press; 2002. , Section 6, pp. 154–155. [Google Scholar]
Associated Data
This section collects any data citations, data availability statements, or supplementary materials included in this article.


