

Abstract
Obese African-American (AA) subjects have higher resting and stimulated insulin concentrations than obese Caucasians (C), which could not be explained by the severity of obesity or the degree of insulin sensitivity. We investigated whether differences in glucagon-like peptide-1 (GLP-1), the most potent incretin that regulates insulin secretion, might explain racial differences in insulin response. Accordingly, we measured fasting and stimulated glucose, insulin, and GLP-1 levels during a 3-h oral glucose tolerance test (OGTT) in 26 obese C (age 38 ± 2 y, body mass index 44 ± 1 kg/m2) and 16 obese AA (age 36 ± 2 y, BMI 46 ± 2 kg/m2) subjects. Corrected insulin response (CIR30), a measure of β-cell activity, whole body insulin sensitivity index (WBISI), and area under the curve (AUC) for insulin, GLP-1, and C-peptide/insulin ratio were computed from the OGTT.
Glucose levels, fasting and during the OGTT, were similar between racial groups; 32% of the C and 31% of the AA subjects had impaired glucose tolerance. With a similar WBISI, AAs had significantly higher CIR30 (2.3 ± 0.4 vs 1.01 ± 0.1), insulin response (IAUC: 23 974 ± 4828 vs 14 478 ± 1463), and lower insulin clearance (0.07 ± 0.01 vs 0.11 ± 0.01) than C (all, P<0.01). Obese AAs also had higher fasting GLP-1 (6.7 ± 2.5 vs 4.5 ± 1.1) and GLP-1AUC (1174.7 ± 412 vs 822.4 ± 191) than C (both, P<0.02). Our results indicate that obese AAs had higher concentrations of GLP-1 both at fasting and during the OGTT than obese C. The increased GLP-1 concentration could explain the greater insulin concentration and the increased prevalence of hyperinsulinemia-associated disorders including obesity and type 2 diabetes in AAs.
Keywords: GLP-1, insulin, racial, β-cell activity
Obesity is characterized by hyperinsulinemia and increased insulin resistance.1 Several in vitro and in vivo studies have shown that hyperinsulinemia may play an important role in the pathogenesis of obesity through regulation of appetite, fat cell metabolism, and energy expenditure.2–4 Recent different cross-sectional and longitudinal studies have reported that both lean and obese African Americans (AA) exhibit higher fasting and stimulated insulin levels when compared with their white counterparts.5,6 Several studies have reported increased β-cell activity as the primary mechanism for this hyperinsulinemic state in black patients; 6 while others, have suggested that the hyperinsulinemia is the result of decreased hepatic insulin clearance7 and reduced insulin sensitivity.8
Glucagon-like peptide-1 (GLP-1) and glucose-dependent insulinotropic polypeptide gastric inhibitory polypeptide (GIP) are the two most important incretins.9 In humans, GLP-1 results from post-translational processing of proglucagon in the intestinal L-cells and accounts for 80% of the intestinal incretin effect.10 GLP-1’s action is mediated by its binding to cell surface receptors (GLP-1R) that are highly expressed on the cell membranes of pancreatic β-cells.10,11 In addition to stimulating insulin secretion, GLP-1 has been shown to have other profound biological effects on β-cells.12 GLP-1 regulates β-cell function by maintaining a portion of the β-cell population in a glucose-competent state by making resistant islets glucose sensitive.13–16 Recent evidence suggests that GLP-1 may also promote regeneration of islet cells and expansion of the β-cell mass.12,17
Racial differences in GLP-1 concentrations in obese subjects have not been previously reported. Based on GLP-1’s effect on β-cell function and insulin secretion, we assessed whether differences in GLP-1 levels may account for the increased β-cell activity, insulin concentrations, and decreased insulin clearance in obese AAs.
Research design and methods
Subjects
The University of Tennessee’s Institutional Review Board approved the study protocol and all subjects gave written informed consent prior to eligibility confirmation. The 42 subjects were otherwise healthy obese adults taking no medication that affects insulin secretion, between the ages of 18 and 65 y, with a body mass index (BMI) ≥ 35 kg/m2. Subjects who met inclusion criteria underwent a screening evaluation consisting of a complete history and physical examination, and the following studies: gallbladder ultrasound, urine pregnancy test, laboratory analysis of electrolytes, creatinine, serum protein levels, and liver function. Subjects were excluded from study participation if the screening evaluation revealed the presence of hypertension, diabetes mellitus, renal, or liver disease.
Anthropometrics
Measurement of total body weight was obtained using a calibrated electronic scale with a precision of ± 0.02 kg. Height was measured using standard anthropometry and expressed in cm. BMI was calculated using the standard formula (weight in kg divided by height in meters squared). Waist and hip circumference measurements were obtained using a metal tape measure.
Dual-energy X-ray absorptiometry
Subjects were analyzed for total tissue, fat mass, and lean mass by dual-energy X-ray absorptimetry (DEXA), using a Lunar DPX-L machine (Madison, WI, USA). Evaluation of weight was limited to 137 kg, the upper limit for the table. Subjects received 0.06 mrem of radiation during the 40min scan. Auto width and length settings were utilized to reduce scan time and radiation exposure. The appropriate energy level was determined individually based on each subject’s body habitus.
Caloric intake and diet composition
Subjects completed a three-day food record diary prior to their visit after receiving individual instruction from the nutritionist. Each study subject met with the nutritionist who, using food models, determined the amounts and proportions of food eaten over the previous 72-h period. Macro- and micronutrient analyses of energy intake were determined by using the software program Ohio Distinctive Software (Columbus, OH, USA).
Laboratory measures and assays
A 3-h oral glucose tolerance test (OGTT) was performed after an overnight fast.18 Subjects drank 75gm dextrose (Allegiance, MacGaw Park, IL, USA), and blood samples were obtained at 0, 15, 30, 60, 90, 120, 150, and 180 min. The 1997 ADA diagnostic guidelines19 were used to distinguish normal vs impaired glucose tolerance (IGT). Serum glucose was measured by the glucose oxidase method.20 Serum immunoreactive insulin (μU/ml) and C-peptide (ng/ml) levels from each OGTT sample were measured by standard double-antibody radioimmunoassay (RIA) (Linco Research; St Louis, MO, USA). Total GLP-1 (pM) was measured by double-antibody RIA (Linco Research; St Louis, MO, USA). Leptin, a surrogate measure of fat mass,21,22 was measured by double-antibody RIA (ng/ml) (Linco Research; St Louis, MO, USA). All other laboratory studies were performed by Memphis Pathology Laboratory (Memphis, TN, USA).
From each OGTT, the following indices were computed using established formulas. (a) Insulin area under the curve (IAUC)23 is an index of the magnitude of the insulinemia during the OGTT. The trapezoid method was used to calculate IAUC. (b) The corrected insulin release at 30 min (CIR30)24 is an index of β-cell activity. (c) Whole body insulin sensitivity index (WBISI) as a measure of peripheral insulin sensitivity.25 (d) The molar ratio of area under the C-peptide curve/IAUC (CP/IAUC) as an index of hepatic insulin clearance during the OGTT26 (Table 1).
Table 1.
Insulin indices formulas
Statistics
All data analyses were performed using the SAS system (Cary, NC, USA). Descriptive statistics are reported as mean and standard error of the mean (s.e.m.) for continuous data and frequency and percent for categorical data. Area under the curve (AUC) was calculated by the trapezoidal method.27 Data were grouped by race. Statistical analyses applied to the data consisted of χ2, Pearson correlation, Spearman correlation (for data that were not normally distributed), independent t-tests, and analysis of variance. P-values less than or equal to 0.05 were considered significant, although trends (0.05<P<0.1) are also listed.
Results
Of the 42 subjects who participated in the study, the majority were female (93%) (with gender equally distributed between races), Caucasian (C) (62%), and had a mean age of 36 ± 1.9 y. Racial groups were similar in age (AA: 35.9 ± 1.6, C: 38.1 ± 1.7 y, P = NS), body weight (AA: 123 ± 4.5 kg, C: 123.3 ± 6.3 kg, P = NS), BMI (AA: 46.43 ± 1.7, C: 43.62 ± 1.39, P = NS), Waist-to-hip ratio (AA: 0.86 ± 0.02, C: 0.82 ± 0.01, P = NS), and baseline leptin levels (AA: 65.6 ± 7.27, C: 53.3 ± 3.68 ng/ml, P = 0.10).
The weight limit of the DEXA table (137 kg) precluded data acquisition in 11 subjects (25%). Total tissue and fat mass measures were obtained in 68% of the AA and 85% of the C subjects. In the subset of individuals, total tissue and fat mass were not different between racial groups (Table 1).
Glucose intolerance was equally distributed in both racial groups with 32% (n = 8) of the C and 31% (n = 5) of the AA groups having impaired glucose tolerance tests, however, no individual met ADA criteria for diabetes. Mean fasting insulin (AA: 22.1 ± 3.2, C: 17.7 ± 2.0, P = NS), fasting glucose (AA: 88.4 ± 6.5, C: 93.3 ± 1.9, P = NS), glucose AUC (AA: 21 527 ± 677, C: 22 488 ± 495, P = NS) were similar between racial groups (Table 2). Total caloric (2509 ± 202 vs 2165 ± 133 in AA and C, respectively, P = NS) and macronutrient intake were similar between racial groups. Carbohydrates accounted for the majority of caloric intake in both groups (45 vs 46% in AA and C, respectively, P = NS), with both racial groups having a similar percentage of calories resulting from fat (39% in AA vs 37% in C, P = NS) and protein (16% both groups).
Table 2.
Body composition measures, insulin indices and enteroinsular axis measures by race
| African Americans (n = 16) | Caucasians (n = 26) | |
|---|---|---|
| Weight (kg) | 122.97 ± 4.97 | 123.34 ± 6.37 |
| BMI (kg/m2) | 46.43 ± 1.70 | 43.62 ± 1.39 |
| Fasting glucose (mg/dl) | 88.4 ± 6.3 | 93.3 ± 1.9 |
| Glucose AUC | 21 527 ± 677 | 22 488 ± 495 |
| Fasting insulin (μU/ml) | 22.1 ± 3.2 | 17.7 ± 2.0 |
| CIR30 | 2.26 ± 0.40 | 1.02 ± 0.12* |
| IAUC | 23 974 ± 4828 | 14 478 ± 1463** |
| WBISI | 2.54 ± 0.43 | 3.16 ± 0.29 |
| CP/IAUC | 0.07 ± 0.01 | 0.11 ± 0.01* |
| C-peptide AUC | 1363 ± 127 | 1464 ± 97 |
| Fasting GLP-1 (pM) | 6.67 ± 2.53 | 4.46 ± 1.11** |
| GLP-1 AUC (pM) | 1175 ± 412 | 822 ± 191** |
| DEXA Analysisa | ||
| Total tissue mass (kg) | 108.7 ± 2.4 | 103.0 ± 2.0 |
| Fat mass (kg) | 57.6 ± 2.2 | 55.9 ± 1.8 |
Sample size for DEXA variable: AA (n = 11) and C (n = 22).
P<0.01,
P<0.05 between racial groups.
All values expressed as mean ± s.e.m.
During the OGTT, AA subjects exhibited higher CIR30 (2.26 ± 0.40 vs 1.02 ± 0.12, P<0.01) and hyperinsulinemia (IAUC: 23 974 ± 4828 vs 14 478 ± 1463, P = 0.02) and decreased hepatic insulin clearance (CP/IAUC: 0.07 ± 0.01 vs 0.11 ± 0.01, P<0.01) than C subjects (Figure 1). However, WBISI (AA: 2.54 ± 0.43 vs C: 3.16 ± 0.29, P = NS) and C-peptide AUC (AA: 1363 ± 127 vs C: 1464 ± 97, P = NS) were not significantly different between racial groups (Table 2).
Figure 1.
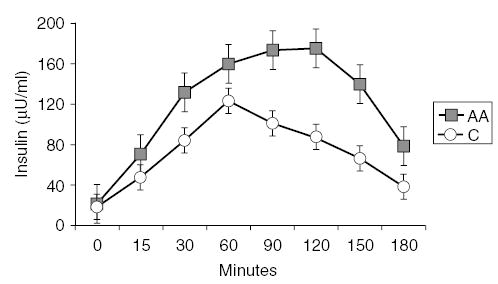
Insulin excursions (μU/ml) during 3-h OGTT in 26 obese C subjects (white circle) and 16 AA subjects (black square). Error bars denote standard error of the mean. ANOVA with repeated measures document significant differences between the insulin curves for AAs and C (P<0.01).
Fasting and changes of insulin and GLP-1 concentrations during OGTT are shown in Figures 1 and 2. In obese AA subjects, fasting GLP-1 levels were significantly higher than fasting levels in obese Cs (6.67 ± 2.53 vs 4.46 ± 1.11, P = 0.02). After glucose load, GLP-1 levels were also higher in obese AAs compared to obese C (GLP-1AUC = 1175 ± 412 vs 822 ± 191, P = 0.02). These differences between racial groups persisted after correction by BMI, WHR, waist circumference, and fat mass. Correlation analyses in both racial groups indicate that IAUC correlated with WBISI (AA: r = −0.90, P<0.001; C: r = −0.92, P<0.001) and CIR30 (AA: r = 0.59, P = 0.03; C: r = 0.67, P<0.001).
Figure 2.
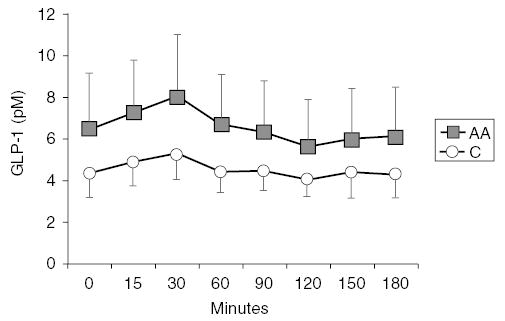
GLP-1 levels (pM) during 3-h OGTT in 26 obese C subjects (white circle) and 16 AA subjects (black square). Error bars denote standard error of the mean. ANOVA with repeated measures document significant differences in GLP-1 area under the curves for AAs and C (P = 0.05).
Discussion
This study was undertaken to explore whether increased GLP-1 levels could explain the increased β-cell activity, insulin level or lower insulin sensitivity reported in obese AA subjects. Higher fasting and stimulated insulin concentrations 6,28,29 in AAs have been explained by a diversity of mechanisms.6,7 Haffner et al6 reported both increased first-phase insulin secretion and reduced insulin sensitivity as the two major determinants of the higher insulin concentrations in AAs. Conversely, Jiang et al,7 in a biracial sample of 1157 adolescents from the Bogalusa Heart Study, reported that the higher insulin concentration in AAs was mainly explained by reduced hepatic insulin clearance as determined by a lower C-peptide/insulin ratio. Arslanian et al,8 suggested that the higher insulin secretion in AAs (50% first-phase and 38% second phase) represented a compensatory mechanism to overcome the 35% decrease in insulin sensitivity. In agreement with these reports, our study indicates that at comparable levels of insulin sensitivity, obese AAs have higher β-cell activity and impaired insulin clearance compared to obese C.
A novel finding in this study is that at similar levels of glucose, BMI, fat mass (DEXA, WHR, leptin), dietary intake, and insulin sensitivity, obese AAs have significantly higher fasting and stimulated GLP-1 concentrations than obese C. Changes in GLP-1 levels paralleled changes in β-cell activity (CIR30) and preceded the peak insulin response during the OGTT. Our results do not explain if higher concentrations of GLP-1 are the result of increased secretion, differences in metabolic clearance, or a combination of both.
Elimination of bioactive GLP-1 from the circulation may occur via at least three different mechanisms: renal clearance, 30–32 hepatic clearance,31 and degradation in the circulation by mainly dipeptidyl peptidase IV (DPP IV; EC 3.4.14.5).33,34 The differences in GLP-1 and insulin concentrations and dynamics between AAs and C, warrants further exploration.
Our study indicates that racial differences in the insulin concentrations could be explained by an increased enteroinsular axis (EIA) activity. Hyperfunction of the EIA, and increased GLP-1 levels, may account for the observed enhanced first- and second-phase of insulin secretion in AAs. GLP-1’s action is mediated by binding to cell surface receptors that are highly expressed on the cell membranes of pancreatic β-cells.10,11 GLP-1 stimulates the formation of the second messenger, cAMP, which activates a cAMP-dependent protein kinase and phosphorylation of key proteins in the control of insulin secretion.12,35 The binding of GLP-1 to its receptor also depolarizes the cellular membrane and induces a rise in free intracellular calcium concentration, followed by a potentiation of the glucose-induced insulin secretion dependent upon extracellular sodium.16 In addition to the insulin stimulatory effect, GLP-1 may affect the hepatic insulin extraction. Brandt et al,13 although not finding a direct effect of GLP-1 on the hepatic insulin clearance, suggested that the increased insulin secretion in response to GLP-1 itself may drive the reduction of hepatic insulin extraction.11 The reduced insulin clearance is presumably due to alterations in insulin receptor number and/or affinity, in view of the importance of the insulin receptor in mediating insulin clearance.36
The effect of higher GLP-1 concentration may also be a potential factor to explain the higher prevalence of obesity and type 2 diabetes in AAs by fostering a hyperinsulinemic state.1 Insulin is the primary hormonal mediator of energy storage in humans.37 Within the adipocyte, insulin regulates: (a) GLUT4 expression; (b) acetyl-CoA carboxylase; (c) fatty acid synthase; and (d) lipoprotein lipase.37 Hyperinsulinemia has also been associated with an enhanced craving for carbohydrates, hyperphagia, and decreased fat oxidation and physical activity. Furthermore, increased levels of GLP-1 induce homologous desensitization and internalization of the β-cell GLP-1R setting up a sequence of events that are thought to result from ligand-induced changes in receptor conformation. The desensitization of the β-cell GLP-1R occurs by homologous desensitization, which is caused by repeated stimulation of the same receptor, and by heterologous desensitization, which decreases the response of the receptor as a result of activation of other membrane receptors, as has been shown with the activation of the protein kinase C by phorbol esters.38 Receptor desensitization participates in the mechanisms to control insulin secretion, perhaps to reduce the risks of hypoglycemia, but it also could possibly play a role in type 2 diabetes by decreasing the sensitivity of the GLP-1R and consequently the secretory activity of the β-cells. Accumulation of GLP-1 after dipeptidyl peptidase IV (DPP IV) degradation in the circulation may also promote type 2 diabetes. Recently, it has been shown that GLP-1 (9–36) amide could antagonize the effects of GLP-1 (7–36).39 However, whether sufficient quantities of this metabolite GLP-1 (9–36) amide exist in vivo to act as an antagonist of GLP-1, or possibly to mediate other biological activities, remains to be determined.
In summary, we have demonstrated that at comparable levels of insulin resistance, glucose tolerance, BMI, WHR, waist circumference, leptin, and fat mass, obese AAs have significantly higher fasting and stimulated GLP-1 concentrations. Changes in GLP-1 levels paralleled changes in β-cell activity and preceded the peak insulin response during the OGTT. Increased GLP-1 concentration might account for the greater insulin concentrations and the increased prevalence of hyperinsulinemia-associated disorders in AAs.
Acknowledgments
The funding for this study was provided in part by Novartis Pharmaceuticals Corporation and the University of Tennessee Health Science Center General Clinical Resource Center (USPH Grant# RR000211).
References
- 1.Campfield LA, Smith FJ. The pathogenesis of obesity. Baillieres Best Pract Res Clin Endocrinol Metab. 1999;13:13–30. doi: 10.1053/beem.1999.0004. [DOI] [PubMed] [Google Scholar]
- 2.Le Stunff C, Bougneres P. Early changes in postprandial insulin secretion, not in insulin sensitivity, characterize juvenile obesity. Diabetes. 1994;43:696–702. doi: 10.2337/diab.43.5.696. [DOI] [PubMed] [Google Scholar]
- 3.Odeleye OE, de Courten M, Pettitt DJ, Ravussin E. Fasting hyperinsulinemia is a predictor of increased body weight gain and obesity in Pima Indian children. Diabetes. 1997;46:1341–1345. doi: 10.2337/diab.46.8.1341. [DOI] [PubMed] [Google Scholar]
- 4.Zannolli R, Rebeggiani A, Chiarelli F, Morgese G. Hyperinsulinism as a marker in obese children. Am J Dis Child. 1993;147:837–841. doi: 10.1001/archpedi.1993.02160320039016. [DOI] [PubMed] [Google Scholar]
- 5.Dowling HJ, Pi-Sunyer FX. Race-dependent health risks of upper body obesity. Diabetes. 1993;42:537–543. [PubMed] [Google Scholar]
- 6.Haffner SM, D’Agostino R, Saad MF, Rewers M, Mykkanen L, Selby J, Howard G, Savage PJ, Hamman RF, Wagenknecht LE, Bergman RN. Increased insulin resistance and insulin secretion in non-diabetic African-Americans and Hispanics compared with non-Hispanic whites. The Insulin Resistance Atherosclerosis Study. Diabetes. 1996;45:742–748. doi: 10.2337/diab.45.6.742. [DOI] [PubMed] [Google Scholar]
- 7.Jiang X, Srinivasan SR, Radhakrishnamurthy B, Dalferes ER, Berenson GS. Racial (black–white) differences in insulin secretion and clearance in adolescents: the Bogalusa heart study. Pediatrics. 1996;97:357–760. [PubMed] [Google Scholar]
- 8.Arslanian S, Suprasongsin C. Differences in the in vivo insulin secretion and sensitivity of healthy black versus white adolescents. J Pediatr. 1996;129:440–443. doi: 10.1016/s0022-3476(96)70078-1. [DOI] [PubMed] [Google Scholar]
- 9.Unger RH, Eisentraut AM. Entero-insular axis. Arch Intern Med. 1969;123:261–266. [PubMed] [Google Scholar]
- 10.Holst JJ. Glucagonlike peptide 1: a newly discovered gastrointestinal hormone. Gastroenterology. 1994;107:1848–1855. doi: 10.1016/0016-5085(94)90831-1. [DOI] [PubMed] [Google Scholar]
- 11.Ferrannini E, Wahren J, Faber OK, Felig P, Binder C, DeFronzo RA. Splanchnic and renal metabolism of insulin in human subjects: a dose–response study. Am J Physiol. 1983;244:E517–E527. doi: 10.1152/ajpendo.1983.244.6.E517. [DOI] [PubMed] [Google Scholar]
- 12.Perfetti R, Merkel P. Glucagon-like peptide-1: a major regulator of pancreatic beta-cell function. Eur J Endocrinol. 2000;143:717–725. doi: 10.1530/eje.0.1430717. [DOI] [PubMed] [Google Scholar]
- 13.Brandt A, Katschinski M, Arnold R, Polonsky KS, Goke B, Byrne MM. GLP-1-induced alterations in the glucose-stimulated insulin secretory dose–response curve. Am J Physiol Endocrinol Metab. 2001;281:E242–E247. doi: 10.1152/ajpendo.2001.281.2.E242. [DOI] [PubMed] [Google Scholar]
- 14.Holz GGt, Kuhtreiber WM, Habener JF. Pancreatic beta-cells are rendered glucose-competent by the insulinotropic hormone glucagon-like peptide-1(7–37) Nature. 1993;361:362–365. doi: 10.1038/361362a0. [DOI] [PMC free article] [PubMed] [Google Scholar]
- 15.Leech CA, Holz GG, Habener JF. Signal transduction of PACAP and GLP-1 in pancreatic beta cells. Ann NY Acad Sci. 1996;805:81–92. doi: 10.1111/j.1749-6632.1996.tb17475.x. discussion 92–93. [DOI] [PMC free article] [PubMed] [Google Scholar]
- 16.Holz GG, Leech CA, Heller RS, Castonguay M, Habener JF. cAMP-dependent mobilization of intracellular Ca2+ stores by activation of ryanodine receptors in pancreatic beta-cells. A Ca2+, signaling system stimulated by the insulinotropic hormone glucagon-like peptide-1-(7–37) J Biol Chem. 1999;274:14147–14156. doi: 10.1074/jbc.274.20.14147. [DOI] [PMC free article] [PubMed] [Google Scholar]
- 17.Nie Y, Nakashima M, Brubaker PL, Li QL, Perfetti R, Jansen E, Zambre Y, Pipeleers D, Friedman TC. Regulation of pancreatic PC1 and PC2 associated with increased glucagon-like peptide 1 in diabetic rats. J Clin Invest. 2000;105:955–965. doi: 10.1172/JCI7456. [DOI] [PMC free article] [PubMed] [Google Scholar]
- 18.Reaven GM, Brand RJ, Chen YD, Mathur AK, Goldfine I. Insulin resistance and insulin secretion are determinants of oral glucose tolerance in normal individuals. Diabetes. 1993;42:1324–1332. doi: 10.2337/diab.42.9.1324. [DOI] [PubMed] [Google Scholar]
- 19.ADA. Report of the Expert Committee on the Diagnosis and Classification of Diabetes Mellitus. Diabetes Care. 1997;20:1183–1197. doi: 10.2337/diacare.20.7.1183. [DOI] [PubMed] [Google Scholar]
- 20.Kadish AH, Little RH, Sternberg JC. A new and rapid method for the determination of glucose by measurement of rate of oxygen consumption. Clin Chem. 1968;14:116–119. [Google Scholar]
- 21.Guven S, El-Bershawi A, Sonnenberg GE, Wilson CR, Hoffmann RG, Krakower GR, Kissebah AH. Plasma leptin and insulin levels in weight-reduced obese women with normal body mass index: relationships with body composition and insulin. Diabetes. 1999;48:347–352. doi: 10.2337/diabetes.48.2.347. [DOI] [PubMed] [Google Scholar]
- 22.Jensen MD, Hensrud D, O’Brien PC, Nielsen S. Collection and interpretation of plasma leptin concentration data in humans. Obes Res. 1999;7:241–245. doi: 10.1002/j.1550-8528.1999.tb00402.x. [DOI] [PubMed] [Google Scholar]
- 23.Toft I, Bonaa KH, Lindal S, Jenssen T. Insulin kinetics, insulin action, and muscle morphology in lean or slightly overweight persons with impaired glucose tolerance. Metabolism. 1998;47:848–854. doi: 10.1016/s0026-0495(98)90125-1. [DOI] [PubMed] [Google Scholar]
- 24.Sluiter WJ, Erkelens DW, Terpstra P, Reitsma WD, Doorenbos H. Glucose tolerance and insulin release, a mathematical approach. II. Approximation of the peripheral insulin resistance after oral glucose loading. Diabetes. 1976;25:245–249. doi: 10.2337/diab.25.4.245. [DOI] [PubMed] [Google Scholar]
- 25.Matsuda M, DeFronzo RA. Insulin sensitivity indices obtained from oral glucose tolerance testing: comparison with the euglycemic insulin clamp. Diabetes Care. 1999;22:1462–1470. doi: 10.2337/diacare.22.9.1462. [DOI] [PubMed] [Google Scholar]
- 26.Uwaifo GI, Nguyen TT, Keil MF, Russell DL, Nicholson JC, Bonat SH, McDuffie JR, Yanovski JA. Differences in insulin secretion and sensitivity of Caucasian and African American prepubertal children. J Pediatr. 2002;140:673–680. doi: 10.1067/mpd.2002.124312. [DOI] [PubMed] [Google Scholar]
- 27.Tallarida RJ, Murray RB. Manual of pharmacologic calculations with computer programs Springer-Verlag: New York; 1986. pp 77–81.
- 28.McKeigue PM, Shah B, Marmot MG. Relation of central obesity and insulin resistance with high diabetes prevalence and cardiovascular risk in South Asians. Lancet. 1991;337:382–386. doi: 10.1016/0140-6736(91)91164-p. [DOI] [PubMed] [Google Scholar]
- 29.Svec F, Nastasi K, Hilton C, Bao W, Srinivasan SR, Berenson GS. Black–white contrasts in insulin levels during pubertal development. The Bogalusa Heart Study. Diabetes. 1992;41:313–317. doi: 10.2337/diab.41.3.313. [DOI] [PubMed] [Google Scholar]
- 30.Orskov C, Andreasen J, Holst JJ. All products of proglucagon are elevated in plasma from uremic patients. J Clin Endocrinol Metab. 1992;74:379–384. doi: 10.1210/jcem.74.2.1730817. [DOI] [PubMed] [Google Scholar]
- 31.Deacon CF, Pridal L, Klarskov L, Olesen M, Holst JJ. Glucagon-like peptide 1 undergoes differential tissue-specific metabolism in the anesthetized pig. Am J Physiol. 1996;271:E458–E464. doi: 10.1152/ajpendo.1996.271.3.E458. [DOI] [PubMed] [Google Scholar]
- 32.Ruiz-Grande C, Alarcon C, Alcantara A, Castilla C, Lopez Novoa JM, Villanueva-Penacarrillo ML, Valverde I. Renal catabolism of truncated glucagon-like peptide 1. Horm Metab Res. 1993;25:612–616. doi: 10.1055/s-2007-1002190. [DOI] [PubMed] [Google Scholar]
- 33.Kieffer TJ, McIntosh CH, Pederson RA. Degradation of glucose-dependent insulinotropic polypeptide and truncated glucagon-like peptide 1 in vitro and in vivo by dipeptidyl peptidase IV. Endocrinology. 1995;136:3585–3596. doi: 10.1210/endo.136.8.7628397. [DOI] [PubMed] [Google Scholar]
- 34.Deacon CF, Nauck MA, Toft-Nielsen M, Pridal L, Willms B, Holst JJ. Both subcutaneously and intravenously administered glucagon- like peptide I are rapidly degraded from the NH2-terminus in type II diabetic patients and in healthy subjects. Diabetes. 1995;44:1126–1131. doi: 10.2337/diab.44.9.1126. [DOI] [PubMed] [Google Scholar]
- 35.Kieffer TJ, Habener JF. The glucagon-like peptides. Endocr Rev. 1999;20:876–913. doi: 10.1210/edrv.20.6.0385. [DOI] [PubMed] [Google Scholar]
- 36.Freidenberg GR, Klein HH, Cordera R, Olefsky JM. Insulin receptor kinase activity in rat liver. Regulation by fasting and high carbohydrate feeding. J Biol Chem. 1985;260:12444–12453. [PubMed] [Google Scholar]
- 37.Ramsay TG. Fat cells. Endocrinol Metab Clin North Am. 1996;25:847–870. doi: 10.1016/s0889-8529(05)70358-3. [DOI] [PubMed] [Google Scholar]
- 38.Widmann C, Dolci W, Thorens B. Desensitization and phosphorylation of the glucagon-like peptide-1 (GLP-1) receptor by GLP-1 and 4-phorbol 12-myristate 13-acetate. Mol Endocrinol. 1996;10:62–75. doi: 10.1210/mend.10.1.8838146. [DOI] [PubMed] [Google Scholar]
- 39.Wettergren A, Wojdemann M, Holst JJ. The inhibitory effect of glucagon-like peptide-1 (7–36)amide on antral motility is antagonized by its N-terminally truncated primary metabolite GLP-1 (9–36)amide. Peptides. 1998;19:877–882. doi: 10.1016/s0196-9781(98)00020-5. [DOI] [PubMed] [Google Scholar]