Abstract
Pardaxins are a class of ichthyotoxic peptides isolated from fish mucous glands. Pardaxins physically interact with cell membranes by forming pores or voltage-gated ion channels that disrupt cellular functions. Here we report the high-resolution structure of synthetic pardaxin Pa4 in sodium dodecylphosphocholine micelles, as determined by 1H solution NMR spectroscopy. The peptide adopts a bend-helix-bend-helix motif with an angle between the two structure helices of 122 ± 9°, making this structure substantially different from the one previously determined in organic solvents. In addition, paramagnetic solution NMR experiments on Pa4 in micelles reveal that except for the C terminus, the peptide is not solventexposed. These results are complemented by solid-state NMR experiments on Pa4 in lipid bilayers. In particular, 13C-15N rotational echo double-resonance experiments in multilamellar vesicles support the helical conformation of the C-terminal segment, whereas 2H NMR experiments show that the peptide induces considerable disorder in both the head-groups and the hydrophobic core of the bilayers. These solid-state NMR studies indicate that the C-terminal helix has a transmembrane orientation in DMPC bilayers, whereas in POPC bilayers, this domain is heterogeneously oriented on the lipid surface and undergoes slow motion on the NMR time scale. These new data help explain how the non-covalent interactions of Pa4 with lipid membranes induce a stable secondary structure and provide an atomic view of the membrane insertion process of Pa4.
Pardaxins belong to a class of small amphipathic peptides that form part of the defense mechanism secreted by sole fish of the genus Pardachirus(1). These polypeptides are postulated to be shark-repelling and toxic to several different organisms (2, 3). The physiology and pharmacology of pardaxins is rather complex; their effects range from interference with ionic transport in both the epithelium and nerve cells to morphological changes in the synaptic vesicles of lipid membranes (4-6). At minimum inhibitory concentrations (3 to 40 μM), pardaxins are able to kill bacteria, whereas at higher concentrations (>50 μM), they lyse red blood cell membranes. In addition, pardaxins can disrupt the ionic transport of the osmoregulatory epithelium and presynaptic activity in mammals by forming voltage-dependent and ionselective channels (1, 7, 8).
An important characteristic of these membrane active peptides is their selective interaction with specific lipid membranes. Several mechanistic studies carried out with synthetic lipids suggest that pardaxins interact with the lipid surface by aggregating and forming pores, and eventually causing leakage of the cellular content (4). The widely accepted mechanism for pardaxin interactions with these membranes is the so-called “barrel-stave” model. This is a multistep mechanism in which the peptides are thought to a) bind the membrane in an α-helical structure, b) self-aggregate on the membrane surface, c) insert themselves into the hydrocarbon core of the membrane, and d) recruit more monomers, progressively increasing the size of the pore. Helicity, hydrophobic moment, hydrophobicity, charges, and the angle subtended by the hydrophilic/hydrophobic helix surfaces are all crucial structural parameters that modulate both the activity and selectivity of these membrane active peptides (9, 10).
Several biophysical studies show that the known sequences of pardaxins (Fig. 1) contain a single polypeptide chain with a high propensity to aggregate in aqueous solutions (7, 11). It has been predicted that this family of peptides is composed of two α-helices (from residues 2-10 and 13-27, respectively) that are joined by a short hinge flanked by two prolines at positions 7 and 13. The N-terminal segment of the peptide is thought to be inserted into the hydrophobic core of the lipid membranes, whereas the C-terminal helix probably represents the ion channel-lining segment of pardaxin (1, 12).
FIG. 1.

Primary sequences of isolated pardaxins.
Several CD studies have also been carried out on pardaxins. The conclusions of these studies are that pardaxins are generally unstructured in aqueous solutions and become highly helical upon the addition of increasing amounts of organic solvent (such as TFE)1 or synthetic lipids. In 1991, Zagorski and co-workers reported the first atomic resolution structure of pardaxin P2 in organic solvent (13). In a mixture of TFE/H2O (1:1 ratio), pardaxin P2 adopts an L-shaped conformation with proline-13 that promotes the unwinding of the helix, facilitating the formation of a bend. Both the N-and C-terminal residues are unstructured. Although these studies represent a good starting point for the investigation of pardaxin structures, a more rigorous study of the interactions of pardaxin with lipids is necessary to identify pardaxin's lipid specificity (1).
Solution and solid-state NMR complement each other in the study of small and medium size membrane polypeptides (14). Whereas solution NMR can give atomic resolution information about polypeptides in lipid micelles, solid-state NMR can complement this information by characterizing the interactions of polypeptides with membrane mimicking models that more closely resemble biological membranes. Our previous solid-state NMR investigation showed that the mechanism of membrane disruption by pardaxin P1 is highly dependent on membrane composition. In the present article, we used both solution and solid-state NMR in micelles and lipids, respectively, to gain an atomic view of pardaxin's (Pa4) membrane insertion process.
MATERIALS AND METHODS
Materials—9-Fluorenylmethoxy carbonyl amino acids were purchased from Applied Biosystems (Foster City, CA) and Advanced ChemTech (Louisville, KY). All phospholipids were purchased from Avanti Polar Lipids (Alabaster, AL). Isotopically labeled 9-fluorenylmethoxycarbonyl amino acids and d31-DPC were obtained from Cambridge Isotope Laboratories (Andover, MA). All other chemicals were purchased from Aldrich.
Peptide Synthesis—The carboxy-amide of pardaxin (Pa4; denoted as P1a in our previous publication) was synthesized using standard 9-fluorenylmethoxycarbonylbased solid-phase methods with an ABI 431A peptide synthesizer (Applied Biosystems) as described previously (12). The sequence of the synthesized pardaxin (Pa4) is identical to that of the peptide isolated from Pardachirus marmoratus, G-F-F-A-L-I-P-K-I-I-S-S-P-L-F-K-T-L-L-S-A-V-G-S-A-L-S-S-S-G-G-Q-E (15). The peptide was purified by reversed-phase high pressure liquid chromatography using a C18 column. Peptide purity (>97%) was confirmed by high pressure liquid chromatography traces, amino acid analysis, peptide sequencing, and mass spectrometry.
Sample Preparation—Pa4 peptide labeled with 15N-Leu19 was used in all samples prepared for solution NMR experiments on micelles, 2H NMR experiments on MLVs, and solid-state NMR experiments on mechanically aligned samples. Samples for REDOR experiments used Pa4 labeled with 13C'-Leu18 and 15N-Leu19. All peptide concentrations are reported as peptide/lipid mole ratio, or are given in mole percent of peptide relative to the total moles of peptide plus other components of the sample. Solution NMR samples were prepared by dissolving ∼1.5 mg of lyophilized Pa4 in 500 μl of 20 mM phosphate buffered saline (phosphate-buffered saline, pH 6.5), containing 300 mM d31-DPC and 10% 2H2O. The sample pH was then adjusted to ∼4.5 with NaOH. All mechanically aligned bilayer samples were prepared as described previously (12, 16, 17). MLV samples were prepared by dissolving the peptide and lipids in 2:1 CHCl3/MeOH, drying the sample first under a stream of nitrogen and then under vacuum overnight to remove any residual solvent. MLV samples were hydrated with 100 weight % water, vortexed for about 5 min above the lipid phase transition temperature, and freeze-thawed using liquid nitrogen several times to ensure a uniform mixture of lipid and peptide. All MLV samples were stored at -20 °C before use.
Solution NMR—All NMR spectra were recorded using a Varian Inova spectrometer operating at 600.48 or 800.24 MHz at a temperature of 303 K and equipped with an inverse detection triple-resonance probe. Resonance assignments were obtained using 2D 1H/1H total correlation spectroscopy (75-ms mixing time) and 1H/1H NOESY (100-, 200-, and 300-ms mixing times) experiments (18). Water suppression was achieved using the WATERGATE technique (19). Spectra were collected with 256 and 1024 complex data points in the t1 and t2 dimensions, respectively. Total correlation spectra were acquired using a DIPSI (Decoupling In the Presence of Scalar Interactions)-2 pulse sequence (20, 21). The spectral widths were 8 KHz on both the t1 and t2 dimensions.
Proton chemical shifts were referenced to internal 3-(trimethylsilyl)-propionic acid. NMR spectra were processed using NMRPipe (22) and analyzed using SPARKY (23). 2D spectra were processed with a sine bell window function shifted by 90°. The data were zero-filled to twice their size before Fourier transformation. In the NOESY spectrum, obtained with a mixing time of 300 ms, NOE cross-peaks were integrated and used for the structure calculations. The NOE volumes were calibrated using the average NOE volume from resolved aromatic vicinal protons of F2, and from the and cross-peaks of G23. The NOE volumes were classified as strong, medium, and weak, corresponding to distance restraints of 1.9-2.7, 1.9-3.3, and 1.9-5.0 Å, respectively (24).
Solvent accessibility of the amide backbone signals was determined by proton/deuterium exchange studies. Samples were prepared by dissolving the lyophilized protein sample in d31-DPC into 2H2O and monitoring the disappearance of the NH peaks by 2D NOESY spectra. After a period of >5 h, most of the resonances of the N-terminal portion of the polypeptide disappeared except for residues 5, 6, and 9. The most solvent-protected region was between residues 14 and 26, whose resonances remained after several days.
Solid-state NMR—All spectra from lipid bilayers were acquired using a Varian/Chemagnetics 400 MHz spectrometer operating with 1H, 31P, 13C, 2H, and 15N frequencies of 400.14, 161.978, 100.62, 61.62, and 40.55 MHz, respectively. Home-built (double-resonance for 15N and31P and single-resonance for 2H experiments) flat-coil probes were used for the mechanically aligned samples. Flat coils were made of 2-mm wide flat copper wire with 1-mm spacing between turns and four to six turns per coil. Bilayers were oriented with the bilayer normal parallel to the magnetic field. A commercial Varian/Chemagnetics double resonance magic angle spinning probe with a 5-mm glass tube was used to acquire the static 2H spectra of unoriented MLV samples. Spectra were processed using Chemagnetics Spinsight software on a Sun Sparc workstation. 31P chemical shift spectra of mechanically aligned bilayer samples were obtained using a chemical shift echo sequence, 90°-τ-90°-τacq, with τ = 100 μs and 35 kHz 1H decoupling. Typical 31P 90° pulse lengths were 3-3.5 μs, and the spectral width was 50 kHz. An average of 128 scans was used with a recycle delay of 3 s. The spectra of oriented samples were referenced with respect to 85% H3PO4 between glass plates (0 ppm). The FID was processed beginning at the top of the echo with 100 Hz exponential broadening, zero-filled to 2048 points, and Fourier transformed. Samples for each 31P experiment were prepared several times independently, and the spectra were compared to confirm the results.
For 2H acquisition, a quadrupole echo sequence, 90°-τ-90°-τ-acq with τ = 100 μs, was used with a radio frequency field strength of 83.3 kHz. 5,000 transients for MLVs and 2,000 for oriented samples were collected with a recycle delay of 2 s. The free induction decay was processed beginning at the top of the echo with 250 Hz (for d31-POPCMLVs) or 100 Hz (for oriented d 4-POPCbilayers) exponential broadening, zero-filled to 4096 points, and Fourier-transformed. The quadrupolar splitting was determined directly from the de-Paked spectrum and used to calculate the order parameter, SCD, using Δ vQ = 3/4 = χQ(3cos2 θ - 1)SCD, where θ = 0° and χQ = 167 kHz (in the de-Paked spectra, the average bilayer normal is parallel to the laboratory frame) (25).
A mechanically aligned sample was prepared using ∼6.5 mg of pardaxin in 50 mg of lipids (2 mol % peptide) on 25 glass plates. 15N spectra were acquired using ramp cross-polarization with a 1H 90° pulse length of 4.5 μs, 35 kHz (with ± 6 kHz ramp) CP (26) power for 1 ms, and 1H decoupling of 70 kHz during acquisition. A spectral width of 50 kHz and 80,000 scans with a recycle delay of 3 s was used. All the spectra were processed with 250 Hz exponential broadening and referenced to powder (15NH4)2SO4 at 24.1 ppm relative to liquid NH3. A 5-mm triple-resonance (1H/13C/15N) magic angle spinning probe was used at 8 kHz spinning speed for REDOR experiments on MLVs at 0 °C. 1.5-ms ramp-cross-polarization was followed by a REDOR dephasing period and then direct 13C detection with a recycle delay of 3 s. A single 55 kHz 13C refocusing 180° pulse was placed at the center of the REDOR dephasing time; 74-kHz two-pulse phase-modulated decoupling (27) was applied on the 1H channel during both dephasing and detection. The 13C and 15N transmitters were set at 175 ppm (relative to tetramethylsilane) and 115 ppm (relative to liquid ammonia at 25 °C), respectively. For the S 1 acquisition, a 45-kHz 15N 180° pulse at the middle and end of each rotor period in the dephasing time was applied. Other details of the REDOR filtering experiment can be found elsewhere (28). Spectra of DMPC MLVs containing 3 mol % pardaxin suggest that the 13C-labeled site (13Ć-Leu) has an isotropic chemical shift value (referenced relative to tetramethylsilane) in the range characteristic of residues in an α-helical conformation (10, 29, 30).
Structure Calculations—Structure calculations were performed using XPLOR 3.851 (31), starting from extended structures and using random simulated annealing calculations (32). An initial high-temperature phase consisting of 6000 restrained molecular dynamics steps of 0.5 fs each was performed at a temperature of 1,000 K. During this stage, all force constants were fixed. A molecular dynamics coolingphase composed of 3,000 steps of 0.5 fs each was then employed, with the temperature decreasing from 1,000 to 100 K during this interval. To refine the generated conformers, simulated annealing was carried out a second time starting at 2,000 K, including the full van der Waals potential. The temperature was decreased from 2,000 to 0 K. During the high temperature steps, the dihedral angles were constrained using a harmonic potential with a force constant of 200 kcal/mol. A final minimization of 500 steps was undertaken with conjugated gradients (33). A total of 335 NOEs were used in the calculations, of which 81 were intraresidue and 254 were inter-residue NOEs. In addition, hydrogen bond constraints were added for residues 14 through 26. Because the secondary structure at the N-terminal portion of the polypeptide is not a regular α-helix, we omitted the hydrogen bond constraints for resides 5, 6, and 9 in the calculations.
All NOEs were unambiguously assigned, and pseudo atoms were employed where appropriate using the center of mass approach when stereo-specific assignments could not be made. The 20 lowest energy structures generated gave a backbone RMSD on the average of 0.28 ± 0.10 Å. Conformers were accepted on the basis of the lowest NOE violations using the “accept.inp” routine included in the XPLOR software package. The 20 structures showed no NOE violations greater than 0.5 Å, no bond angle violations greater than 5°, and no bond length violations greater than 0.05 Å. The covalent geometry of the conformers generated was analyzed using PROCHECK_NMR (34).
Peptide Localization in Micelles—For localization of Pa4 relative to the micelle surface, we used three different paramagnetic agents: MnCl2 (0.1:1 and 0.2:1 [Mn2+]:[Pa4]), 5-doxylstearic acid (1:1 and 10:1 [5-doxyl]:[Pa4]), and 16-doxylstearic acid (10:1 and 20:1 [16-doxyl]: [Pa4]) (35). By observing the subsequent line broadening as a result of paramagnetic effects, it was possible to position the peptide relative to the micelle surface. Paramagnetic effects were estimated by the percentage reduction of the backbone HN-H α resonances using 2D 1H NOESY experiments at a mixing time of 100 ms (35, 36).
RESULTS
Structure of Pardaxin in Micelles—Pardaxin Pa4 has been reported to aggregate and form tetramers in aqueous solutions (1, 7). Under our experimental conditions, this polypeptide is mostly insoluble in aqueous solutions at pH ∼ 6.5. The peptide solutions become clear only at a lower pH (∼ 4.5), but the quality of the spectra is rather poor, indicating substantial aggregation (data not shown). These findings are in agreement with previous studies by CD spectroscopy, which reported that in H2O, pardaxin is mostly unstructured, although it adopts a helical conformation upon addition of increasing amounts of TFE (37, 38, 57, 58). We chose DPC micelles for this work because of the affinity of pardaxins for membranes containing phosphatidylcholine (12, 39). In DPC detergent micelles, Pa4 is soluble up ∼ 1.0 mM. Because the polypeptide resonances become undetectably broad at higher concentrations, hampering NMR spectroscopy studies, all our experiments were carried out using Pa4 in a concentration range between 0.5 and 1.0 mM. Under our experimental conditions, the Pa4 peptide samples were stable for several weeks, as determined by 1D proton spectra.
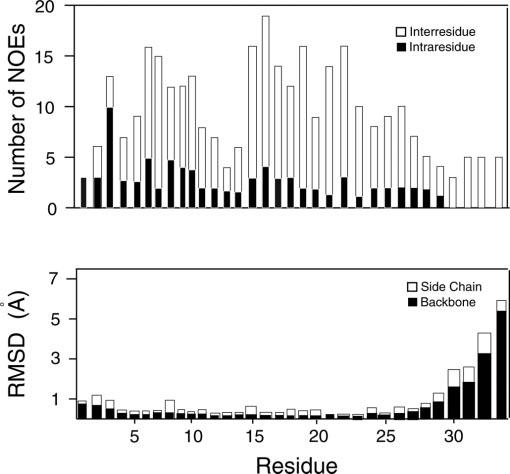
To assign the backbone and side chain resonances, a combination of 1H/1H 2D-total correlation spectroscopy and NOESY spectra at different mixing times were used. The high resolution in these spectra allowed us to assign these resonances completely. Two portions of the NOESY spectrum at 100 ms of mixing time are shown in Fig. 2. The complete resonance assignment is given in the supplementary materials. The fingerprint region (Hα-NH cross peaks region) of the total correlation spectroscopy has been assigned, with the exception of Gly-1, Phe-2, Pro-7, and Pro-13, which are absent in this spectrum but present in the 2D NOESY experiment. From analysis of the 2D NOESY spectra, we were able to assign a total of 335 NOEs, 81 of which were intraresidue and 254 were inter-residue. Fig. 3 summarizes the backbone NOEs for the secondary structure assignment with a histogram, indicating the number of NOEs per residue.
FIG. 2.
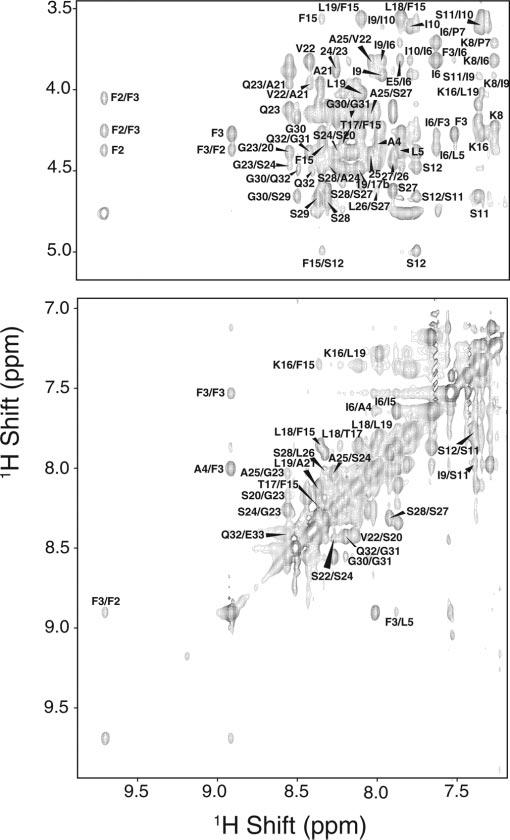
Selected regions from a two-dimensional 1H/1H NOESY experiment with a 300-ms mixing time for the Pa4 peptide in sodium DPC micelles.
FIG. 3.
Top, a histogram depicting the number of intra-and interresidue NOEs as a function of the residue number. Bottom, root-meansquare deviation of backbone and side chains versus residues for the 30 lowest energy conformers derived from simulated annealing calculations.
Both the backbone NOE pattern and the Hα chemical shift index indicate the presence of a helical domain in the region of 14-28 (Fig. 4). The observation of both dαN(i,i + 1) and dNN(i,i + 1) NOEs in conjunction with dαN(i,i + 3) and dαN(i,i + 4) connectivities is diagnostic of a regular α-helix (see Fig. 3) (40). We also detected several dNN(i,i + 1), dαN(i,i + 1), and an overlapping series of dNN(i,i + 2) involving residues Leu-14-Ala-25, whereas dαN(i,i + 3) and dαN(i,i + 4) connectivities mostly involve residues Phe-15-Leu-26. In the latter polypeptide segment, there are also three dαβ(i,i + 3) connectivities between residues Leu-14-Thr-17, Phe-15-Leu-18 and Leu-19-Ala-22, pointing to a helical secondary structure. The dαN(i,i + 1) NOEs are present from residues Phe-2 through Ile-6, Lys-8 through Ser-11, and Leu-14 through Ser-27 with a break between Leu-19 and Ser-20.
FIG. 4.
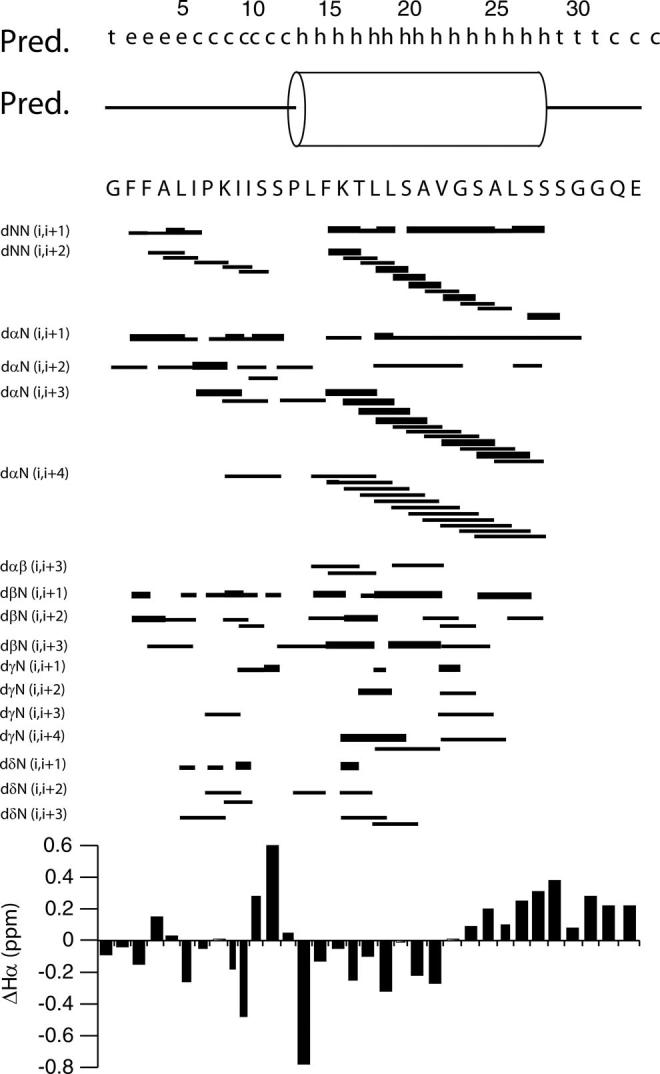
Summary of NMR structural parameters of Pa4 in DPC micelles determined from NMR experiments. The correlations indicated with thick lines correspond to strong NOE, whereas correlations indicated with thin lines correspond to medium NOEs.
Although most of the NOEs are localized in the center of the peptide, several long-range NOEs are also present in the N-terminal region of pardaxin. Nonetheless, the presence of only two dαN(i,i + 3) connectivities involving residues Ile-6 and Ile-9, and Lys-8 and Ser-11, and one dαN(i,i + 4) connectivity involving Lys-8 and Ser-12, excludes the presence of a well defined α-helix in the N-terminal region of the peptide. Moreover, we count a dense population of long-range backbone connectivities in the region 14-28: 11 dαN(i,i + 3) and 11 dαN(i,i + 4) connectivities. Although the quality of the spectra allowed us to assign both resonances and the NOEs, it was not possible to obtain accurate values for the J-coupling constants using 1H/1H double quantum-filtered or exclusive correlation spectroscopy experiments because of the intrinsic line broadening of peptides and proteins solubilized in detergent micelles (41-43). Therefore, the constraints for the structure calculations were derived from NOEs and hydrogen bond constraints.
Fig. 5 shows the results from our calculations using the simulated annealing protocol built into XPLOR routines. After a first stage of simulated annealing without Lennard-Jones parameters, the van der Waals interactions were introduced to further refine the structures (see “Materials and Methods”). The resulting structures were analyzed, and those with the lowest conformational energy were selected. These structures are superimposed at the Cα from residues 2 through 30, giving a backbone root-mean-square deviation of ∼ 0.53 Å. In reality, the lowest values of root-mean-square deviation were obtained by superimposing the Cα atoms of the segments comprising residues 16-30 (∼ 0.45 Å) or residues 2-12 (∼ 0.22 Å). This shows that the proline residue at position 13 may constitute a point of flexibility between two very well defined domains. The first domain comprises a structured turn from residues 2 through 6 and one turn of a helix from residues 7 through 13. On the other hand, the second structural domain contains a turn (14 through 16), and a well defined α-helix (17 through 30) with a more disordered C terminus. The two domains form an angle of ∼122 ± 9°, making this molecule similar to a “crowbar” rather than the “L-shaped” topology reported by Zagorski and co-workers (13). The energetic and geometric parameters for the 20 lowest energy structures are summarized in Table I. The ribbon representation of Pa4 backbone is reported in Fig. 6 showing the amphipathic nature of the C-terminal helix.
FIG. 5.
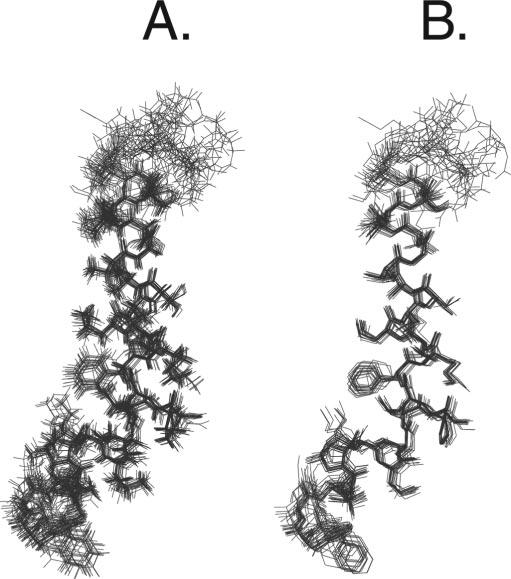
Superpositions of the 20 lowest energy conformers from simulated annealing calculations. A, full atom representation. B, heavy atom representation. The overlay of the structures was performed by superposition of the backbone atoms from residues 2 to 30.
TABLE I.
Experimental NMR restraints and structural statistics for the 20 lowest energy conformers of the Pa4 peptide in DPC micelles All statistics were carried out using XPLOR. Ramachandran analysis was performed using PROCHECK_NMR. The unstructured C terminus was excluded from the Ramachandran analysis.
| NOEs | |
| Total | 335 |
| Intraresidue | 81 |
| Inter-residue | 254 |
| Hydrogen Bonds | 12 |
| Average Energies (Kcal mol-1) | |
| Etot | 143 ± 13 |
| ENOE | 48 ± 3 |
| Ebond | 9 ± 1 |
| Eangle | 42 ± 2 |
| Eimproper | 5 ± 1 |
| EVDW | 48 ± 2 |
| Root-Mean-Square Deviation (Å) | |
| Superposition Cα F2-G30 | 0.53 ± 0.17 |
| Superposition Cα K16-G30 | 0.45 ± 0.24 |
| Superposition Cα F2-S12 | 0.22 ± 0.18 |
| Ramachadran analysis | |
| Residues in most favored regions | 80.7 |
| Residues in additional allowed regions | 11.6 |
| Residues in generously allowed regions | 7.7 |
| Residues in disallowed regions | 0 |
FIG. 6.
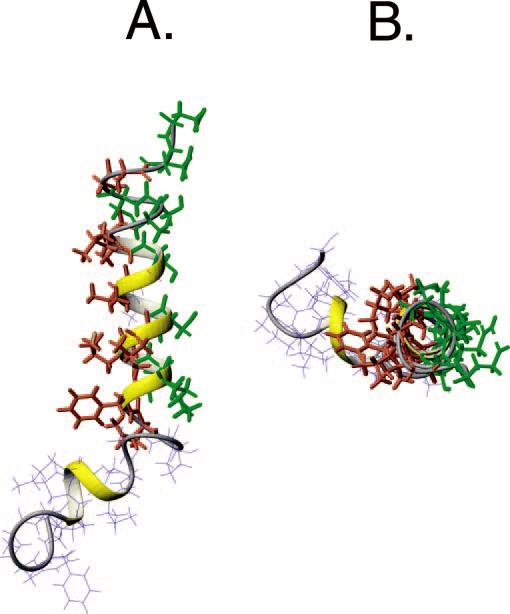
Average structure of Pa4 showing the hydrophobic residues (coral) and hydrophylic residues (green).
Conformation of the C-terminal Segment in Lipid Bilayers—Because a lipid bilayer is considered to be a better model for mimicking a cell membrane than a detergent micelle, the backbone conformation of pardaxin and the peptide-induced disorder were measured using solid-state NMR experiments in phospholipid bilayers. Although solving the entire structure of the peptide in lipid bilayers using solid-state NMR techniques is one of the main goals of the project, in this study, we wanted to compare the site-specific conformations of the peptide in micelles and lipid bilayers. To confirm the helicity of the Cterminal amphipathic segment (residues 17 through 30) of pardaxin as determined in DPC micelles, we used solid-state REDOR experiments. REDOR experiments were performed on MLVs containing 3% pardaxin specifically labeled with 13C'-Leu-18 and 15N-Leu-19. The REDOR filtered 13C chemical shift spectrum in Fig. 7 consists of a single peak with a frequency value consistent with the helical conformation of this domain, proving that the peptide has a similar conformation in both micelles and lipid bilayers. This finding ensures that the structure determined from solution NMR experiments in micelles is biologically relevant.
FIG. 7.
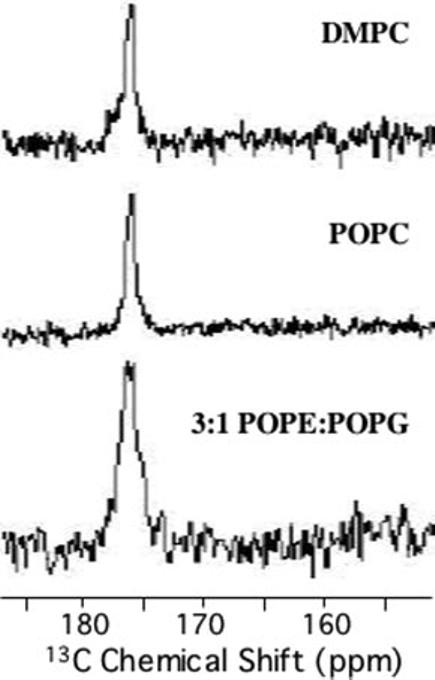
REDOR dephased spectra of pardaxin in DMPC, POPC, and 3:1 POPE:POPG multilamellar vesicles. POPE, 1-palmitoyl-2-oleoyl-sn-glycero-3-phosphatidylethanolamine; POPG, 1-palmitoyl-2-oleoylsn-glycero-3-phosphatidylglycerol.
Topology of Pardaxin in Micelles—Pardaxin's topological orientation with respect to the micelle was determined using line broadening of the NMR resonances upon the addition of different paramagnetic agents. The position of pardaxin with respect to the micelle surface was estimated from the percentage reductions of the HN-Hα 1H NOESY cross-peaks for the backbone and side chains, respectively (35, 36). Fig. 8, A-C, shows the normalized intensity retention upon the addition of Mn2+, 5-doxyl stearic acid, and 16-doxyl stearic acid, respectively. Upon the addition of Mn2+ the resonances of residues Ser-12, Leu-19, Val-22, and Gly-23 are only marginally affected, whereas the resonances of residues Ser-127, Ser-128, and Ser-129 become undetectably broad. On the other hand, the addition of 5-doxyl stearic acid causes a decrease in the resonances located in positions Phe-3, Phe-15, and between Ala-21 and Gly-23, whereas no substantial perturbations of the resonances were observed for residues 10-12 and residues 17 and 19. Upon the addition of 16-doxyl stearic acid, it is possible to observe a progressive decrease in the signal intensities from residue 23 up to residue 2. Taken all together, the paramagnetic mapping experiments indicate that the peptide does not entirely cross the micelle; rather it is inserted in the micellar core with residues 21-23 close to the detergent headgroups and with residues 24-33 more exposed to the bulk solvent. It is interesting that the resonances of Gly-30, Gly-31, Gln-32, and Glu-33 that belong to the C terminus are not accessible to the Mn2+ ions. A molecular map of the changes in cross-peak volumes for the different residues is given in Fig. 8D.
FIG. 8.
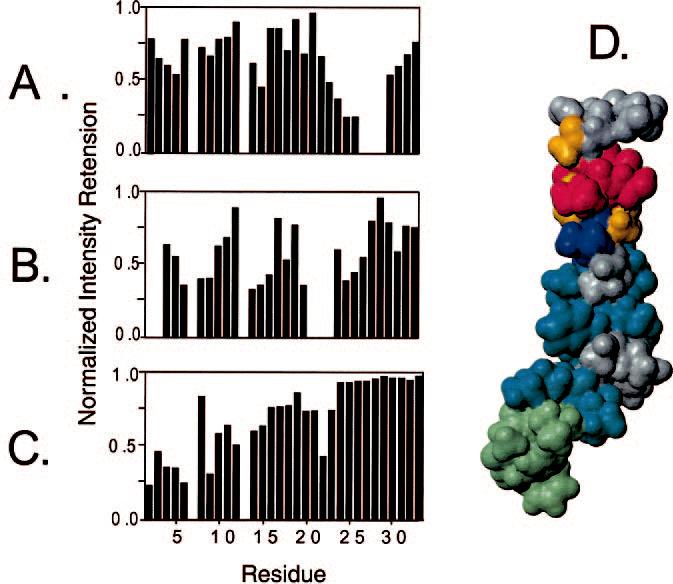
Normalized reduction in signal intensity of NOESY spectra of pardaxin P4 in DPC micelles upon interaction with paramagnetic agents. Reductions in signal intensity of HN-Hα NOESY cross-peaks in the presence of 80 μM Mn2+ (A), 8.0 mM 5-doxylstearic acid (B), and 17.0 mM 16 doxylstearic acid (C). The signal reductions greater than 50% are mapped onto the contact surface of pardaxin (D). Residues that disappear upon addition of Mn2+ are colored red. Residues that are quenched (>50%) upon addition of Mn2+ are colored orange. Residues quenched completely by 5-doxylstearic acid are colored blue, whereas residues quenched significantly (>40%) by 5-doxylstearic acid are colored turquoise. Residues quenched by 16-doxylstearic acid are colored pale green. The residues only marginally affected by the paramagnetics are colored gray.
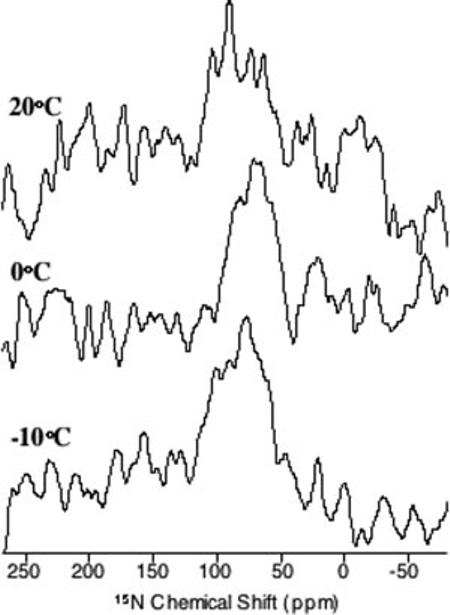
Topology of the C-terminal Helix in Lipid Bilayers—Mechanically aligned lipid bilayers containing pardaxin labeled with 15N-Leu19 were used to obtain the orientation of the peptide. Our previous studies suggested that the C-terminal helix of the peptide has a transmembrane orientation in DMPC, which agrees well with the results obtained from micelles, and a surface orientation in POPC bilayers (12) However, the signalto-noise ratio from our previous experiments on POPC bilayers was poor, a complication attributed to the interference of the peptide dynamics with cross-polarization (12). Because we had recently demonstrated that the bilayers could be aligned at low temperatures (17), we conducted further experiments on POPC bilayers at various temperatures to confirm the dynamics of the peptide as well as the results obtained from micelles. As shown in Fig. 9, the 15N chemical shift spectrum consists of a single broad peak (spanning from approximately 60 to 110 ppm), suggesting that the helical segment is not transmembrane in POPC bilayers but has a heterogeneous surface orientation. Improvement in the signal-to-noise ratio at low temperatures (0 and -10 °C) confirms that the slow dynamics of the peptide (in the millisecond time scale) interferes with solid-state NMR experiments at higher temperatures, particularly with crosspolarization and decoupling during signal acquisition, explaining the poor signal-to-noise ratio in the previously reported 15N spectrum of pardaxin in POPC bilayers (12).
FIG. 9.
15N chemical shift spectra of mechanically aligned POPC bilayers containing 2 mol % pardaxin.
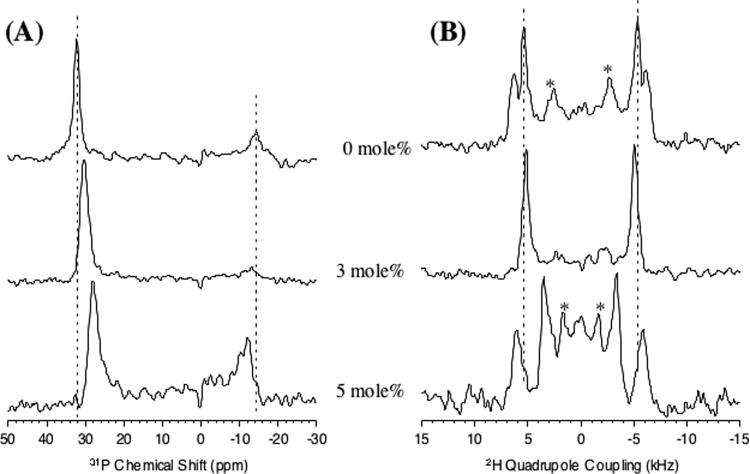
2HSolid-state NMR Spectroscopy of Lipid Bilayers with Pardaxin—2H NMR quadrupolar echo spectra of d31-POPC multilamellar vesicles with and without pardaxin were obtained. The spectra of unaligned bilayers (data not shown) were de-Paked to obtain oriented spectra (shown in Fig. 10A) with the bilayer normal parallel to the magnetic field (44). Because the spectral lineshapes in the presence of pardaxin are similar to the pure lipid spectra (see Fig. 10A), the peaks in samples containing pardaxin were assigned in the same manner as for pure lipids (45). 31P experiments were also performed on these samples to confirm that the lipids were in a fluid lamellar phase both before and after the 2H NMR spectra were obtained (spectra not shown). The quadrupolar splitting is reduced in the presence of pardaxin at all positions along the acyl chain and decreases with increasing peptide concentration. Deuterium order parameters are plotted in Fig. 10B and were calculated from the de-Paked spectra as explained in the literature (25, 45). It is clear that the presence of the peptide increases disorder along the acyl chain and the degree of disorder is dependent on the concentration of the peptide. To measure the peptide-induced disorder or structural changes in the head group region of lipids, solid-state NMR experiments were performed on mechanically aligned d4-DMPC bilayers. The 31P and 2H spectra of d4-DMPC bilayers with and without peptide given in Fig. 11 reveal a number of interesting features. The presence of pardaxin decreases the 31P CSA span, as observed from MLVs (data not shown) as well as from the residual unoriented component of the spectra given in Fig. 11A. The presence of the peptide also decreases 2H quadrupole splitting at the Cα site, whereas it increases 2H quadrupole splitting at the Cβ site. The changes in the 31P CSA span and 2H quadrupolar splittings will be discussed below.
FIG. 10.
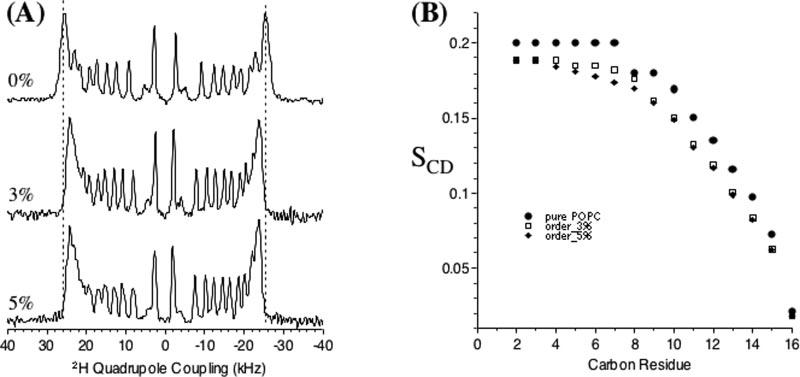
A, dePaked 2H NMR spectra of POPC MLVs containing 0, 3, and 5 mol % pardaxin. B, order parameters (SCD) measured from spectra given in A.
FIG. 11.
31P (A) and 2H (B) NMR spectra of mechanically aligned d4-DMPC bilayers containing 0, 3, and 5 mol % pardaxin. Signals marked with asteriskswere caused by unoriented lipids in the sample.
DISCUSSION
Topology of Pardaxin—Several different studies point to a “barrel-stave” mechanism of action for pardaxin in lipid membranes. The N-terminal portion of this peptide is thought to be involved in both the insertion of the peptide in the lipid bilayers and in the aggregation process (46, 47). On the other hand, the C-terminal helix, which is markedly amphipathic, is involved in the formation of ion-channels (46, 47). Our previous solidstate NMR studies in mechanically aligned DMPC bilayers suggested that the C-terminal amphipathic helix is transmembrane, which corroborates its role in the formation of ionchannels (12). This observation is in complete agreement with the solution NMR results in detergent micelles as well as consistent with the barrel-stave mechanism of membrane-disruption by pardaxin. On the other hand, the 15N solid-state NMR spectrum of pardaxin in POPC bilayers indicates that pardaxin is oriented topologically with the amphipathic Cterminal-helix approximately perpendicular to the bilayer normal (12). It also shows that the peptide undergoes motion on a timescale that interferes with the transfer of magnetization from protons to 15N, and/or with proton decoupling during signal acquisition in a cross-polarization experiment.
The increase in signal-to-noise ratio at low temperatures and the broad line width of the spectral line obtained from aligned samples (Fig. 9) in the present study suggest that the C-terminal helix has heterogeneous orientations on the surface of the bilayer. Because the hydrophobic thickness of the DMPC and POPC bilayers differs by only 3 Å, this discrepancy cannot be explained by a hydrophobic mismatch alone (48). In addition, both differential scanning calorimetry and31P spectroscopy showed that pardaxin behaves rather complexly in the presence of different lipids. For instance, the effects of pardaxin on POPC and 1-palmitoyl-2-oleoyl-sn-glycero-3-phosphatidylethanolamine bilayers are quite different (12), indicating that the difference in the acyl chains between POPC and DMPC is not the only factor that can affect peptide activity. These observations are further supported by 2H NMR data in d31-POPC (Fig. 10) suggesting that pardaxin increases disorder in the acyl chain of POPC bilayers in a concentration-dependent manner, which is in good agreement with similar trends observed for other surface-oriented peptides (25). At the same time, under the concentrations used in this study, the peptide does not alter the lamellar phase structure of lipid bilayers, ruling out the detergent-type micellization mechanism of membrane-disruption. The topology and physicochemical properties elucidated here can be correlated with the reported fusogenic property of pardaxin.
Does Pardaxin Induce Changes in the Conformation and Dynamics of the Lipid Headgroup?—2H and31P NMR experiments were performed on DMPC bilayers with and without pardaxin to measure the peptide-induced changes in the headgroup region of lipid bilayers. The addition of pardaxin to d4-DMPC bilayers decreases quadrupole coupling at the Cα site, whereas it increases at the Cβ site (Fig. 11B). These changes can be interpreted in terms of modulation of headgroup dynamics and/or conformation. Because any changes caused by the dynamics of the lipid headgroup (alteration of disorder or order or angular fluctuations) would have the same effect on α and β segments, they would cause the quadrupole couplings to change in the same direction for both the carbon sites. The observed counter-directional changes in the quadrupole couplings cannot therefore be explained by the changes in the dynamics of the headgroups. On the other hand, these results can be interpreted in terms of a conformational change in the phosphocholine headgroup. NMR studies have shown that the -P-N+ dipole of the phosphocholine headgroups that is oriented almost parallel to the plane of the bilayer surface can be altered in the presence of electric charges. For example, the addition of a cationic amphiphile moves the N+end of the dipole toward the water phase, whereas an anionic amphiphile has the opposite effect (49).Because the net charge of pardaxin at neutral pH is + 2, it could repel the N+ end of the -P-N+ dipole vector that would move the dipole toward the water phase of the bilayer, thus changing the phosphocholine conformation. This interpretation is in good agreement with the results reported for the effects of cations on the conformation of the lipid headgroup (49).
According to previous studies (49), a conformational change in the lipid head group may increase the 31P CSA span; however, the 31P CSA spans measured from DMPC and POPC bilayers are reduced in the presence of the peptide (Fig. 11A). This observation could be the result of other factors that alter the CSA span (50, 59). In addition, it is unlikely that the peptide is increasing the dynamics at the 31P site without affecting the Cα&β sites. These results suggest that choline headgroups do not prevent membrane disruption by pardaxin, which correlates well with pardaxin's toxicity toward eukaryotic cells whose membranes contain zwitterionic lipids.
High-resolution Structure of Pardaxin—The solution NMR investigation of pardaxin in detergent micelles is complementary to solid-state NMR results obtained from lipid bilayers. In particular, the quality of the NMR spectra allowed us to obtain a high-resolution structure for pardaxin in membrane-mimicking environments. The large number of NOE constraints allowed us to define the secondary structure elements and to elucidate the relative orientation of the N-and C-helical domains-with greater accuracy. The previously obtained structure of pardaxin was solved using the helix-inducing TFE membrane-mimicking environment. Although this study provided some insights into the structure, it has been reported that the structure-inducing driving forces of isotropic environments (such as organic solvent mixtures) are substantially different from those of non-isotropic phases (such as micelles or vesicles) so that membrane active polypeptides can have different secondary structure elements in different environments. This has been the case for pardaxin, which displays either an α-helical or β-strand arrangement of the backbone depending on the membrane-mimicking system used. Therefore, it is not surprising that the structure presented here differs from the one proposed by Zagorski and co-workers (13).
Although the overall shape of the molecule is substantially similar (bend-helix-bend-helix), there are many differences in each of the secondary structure domains. First, Zagorski and co-workers identified five different structural domains (1-5, 6-11, 12-13, 14-26, 27-33), with two unstructured regions (12-6 and 27-33). In DPC micelles, the N-terminal region of the peptide is highly structured. The two aromatic rings display several NOEs, making this region a well defined bend. Because the P7A mutant of pardaxin shows enhanced helicity and consequently more pronounced hemolytic activity, the structure of this region might play an important role in the specificity of pardaxin for bacterial over mammalian cells (9, 37). Second, the structure in TFE is L-shaped, with proline 13 causing the helix to unwind. This in turn results in a bend of ∼90° between the two helical domains. In DPC micelles, the proline plays a similar role except that the angle between these two domains is 122 ± 9°. This larger angle may better explain the ability of pardaxin to insert itself in lipid membranes, forming a “funnel” like oligomer in the membrane bilayers. The considerable differences between the two structures in TFE and DPC can be attributed to the effects of alcohols on polypeptide structures in which alcohols weaken non-local hydrophobic interactions, favoring local polar interactions such as hydrogen bonding (9). The disruptive effects of organic solvent mixtures such as alcohol/water have also been demonstrated with larger polypeptides such as phospholamban (42).
Membrane-lytic Activity of Pardaxin—Unlike that of most of the other membrane active antimicrobial peptides, such as LL-37, magainin, MSI-78, or cecropin, the secondary structure of pardaxin is rather complex. Although the above-mentioned polypeptides comprise mainly a single α-helix, pardaxin's secondary structure is a composite bend-helix-bend-helix, with an overall topology similar to that of M2 protein from influenza A virus. A model structure of this protein was recently proposed (51). The structure of the pore-forming monomer was proposed to have two distinct regions: one hydrophobic region, inserted in the hydrocarbon region of the membrane with a tilt angle of 25° with respect to the bilayer normal, and the second an amphipathic helix lying on the surface of the bilayer with an angle of 80°. The angle between the two domains is about 125°, which is near the topological arrangement of pardaxin, whose angle between the two helical domains is 122 ± 9°. These topological similarities suggest that a comparable mechanism might be taking place for the oligomerization of both M2 protein from influenza A virus and pardaxin, with the structure in DPC micelles supporting a mechanism of aggregation consistent with the proposed “barrel-stave” model (47, 52): the Nterminal domain seems to be involved in the insertion in the lipid bilayer, whereas the C-terminal amphipathic helix constitutes the putative ion-channel lining segment.
Although pardaxin has been thought to be a “melittin-like” peptide even though its toxicity is considerably lower than that of melittin, our study clearly suggests that the structures of pardaxin and melittin (53, 54) differ significantly. Both these peptides have two structural domains, and the angle between the domains is similar. Although this similarity may explain their cytotoxicity, the differences in their structural details could be useful in understanding the differences in their activities. In addition, the mechanisms of membrane-disruption by these peptides are considerably different. Pardaxin induces a negative curvature on lipid bilayers (12), whereas melittin induces a positive curvature strain (55). Melittin lyses membranes into micelles (56), but pardaxin's membrane-disruptive mechanism is dependent on membrane composition. In addition, pardaxin's ability to disrupt lipid bilayers is substantially reduced by the addition of cholesterol, showing that this peptide has a preference for bacterial over mammalian cells, even though its selectivity is poor compared with that of other antimicrobial peptides. This explains why pardaxin, unlike melittin, is selective toward bacterial membranes at low concentrations and toxic to eukaryotic cells at higher concentrations.
CONCLUSIONS
We have determined the high-resolution structure and topology of pardaxin P4 in DPC micelles. Although the overall secondary structure resembles the one proposed by Zagorski et al.(13), there are many differences in the length and nature of each secondary structure domain. The structure presented here shows a mostly structured N terminus, with the residues in a tight bend conformation, and the N-terminal helix nucleated by a proline in position 7 contains only one turn of a helix, which is interrupted by a second proline in position 13. The amphipathic C-terminal helix spans residues 14-30, forming a 122 ± 9° angle with the N-terminal helix. Moreover, we found that the N-terminal domain is solvent-protected, whereas the C-terminal residues 30-33 are solvent-exposed. Residues 21-23 lie beneath the polar heads of the detergent micelles.
The backbone conformation of the C-terminal segment and its topology determined from lipid bilayers using solid-state NMR methods are in good agreement with the results obtained from micelles, further confirming the biological relevance of our pardaxin structure. 31P and 2H Solid-state NMR data from lipid bilayers suggest that pardaxin alters the headgroup dynamics and conformation. Although these data help interpret the membrane activity of pardaxin, they provide only a rough model for its insertion into the lipid bilayers. Further solution and solid-state NMR studies on pardaxin and its analogs are in progress to more fully elucidate the mechanism of membrane-disruption.
Supplementary Material
Acknowledgments
We would like to thank R. Di Fonzo, D. Live, and B. Ostrowski for assisting with the NMR experiments.
Footnotes
This research was partly supported by an National Science Foundation Grant (CAREER development award to A. R) and funds from the National Institutes of Health (Grant AI054515-01A1). NMR instrumentation was provided with funds from the National Science Foundation (Grant BIR-961477) and the University of Minnesota Medical School. The costs of publication of this article were defrayed in part by the payment of page charges. This article must therefore be hereby marked “advertisement” in accordance with 18 U.S.C. Section 1734 solely to indicate this fact.
The on-line version of this article (available at http://www.jbc.org) contains a supplemental table.
The atomic coordinates and structure factors (code 1XC0) have been deposited in the Protein Data Bank, Research Collaboratory for Structural Bioinformatics, Rutgers University, New Brunswick, NJ (http://www.rcsb.org/).
The abbreviations used are: TFE, trifluoroethanol; DPC, sodium dodecylphosphocholine; MLV, multilamellar vesicle; REDOR, rotational echo double resonance; 2D, two dimensional; NOESY, nuclear Overhauser effect (or enhancement) spectroscopy; NOE, nuclear Overhauser effect; DMPC, 1,2-dimyristoyl-sn-glycero-3-phosphatidylcholine; POPC, 1-palmitoyl-2-oleoyl-sn-glycero-3-phosphatidylcholine.
REFERENCES
- 1.Lazarovici P. Toxin Rev. 2002;21:392–421. [Google Scholar]
- 2.Primor N, Parness J, Zlotkin E. Toxicon Suppl. 1978;1:539–547. [Google Scholar]
- 3.Primor N. Experientia. 1985;41:693–695. doi: 10.1007/BF02007726. [DOI] [PubMed] [Google Scholar]
- 4.Shai Y. Toxicol. 1994;87:109–129. doi: 10.1016/0300-483x(94)90157-0. [DOI] [PubMed] [Google Scholar]
- 5.Renner PC, C. G, Waser PG, Lazarovici P, Primor N. Neurosci. 1987;23:319–325. doi: 10.1016/0306-4522(87)90292-2. [DOI] [PubMed] [Google Scholar]
- 6.Arribas M, Blasi J, Lazarovici P, Marsal J. J. Neurochem. 1993;60:552–558. doi: 10.1111/j.1471-4159.1993.tb03184.x. [DOI] [PubMed] [Google Scholar]
- 7.Lazarovici P, Primor N, Loew LM. J. Biol. Chem. 1986;261:16704–16713. [PubMed] [Google Scholar]
- 8.Lazarovici P, Primor N, Caratsch CG, Munz K, Lelkes P, Loew LM, Shai Y, McPhie P, Louini A, Contreras ML, Fox J, Shih YL, Edwards C. In: Neurotoxins in Neurochemistry. Dolly OJ, editor. Ellis Horwood; Chichester: 1998. p. 219. [Google Scholar]
- 9.Dathe M, Wieprecht T. Biochim. Biophys. Acta. 1999;1462:71–87. doi: 10.1016/s0005-2736(99)00201-1. [DOI] [PubMed] [Google Scholar]
- 10.Wildman KAH, Wilson EE, Lee D, Ramamoorthy A. Solid State NMR. 2003;24:94–109. doi: 10.1016/s0926-2040(03)00048-1. [DOI] [PubMed] [Google Scholar]
- 11.Lazarovici P, Edwards C, Raghunathan G, Guy HR. J. Nat. Toxins. 1992;1:1–15. [Google Scholar]
- 12.Hallock KJ, Lee D, Omnaas J, Mosberg HI, Ramamoorthy A. Biophys. J. 2002;83:1004–1013. doi: 10.1016/S0006-3495(02)75226-0. [DOI] [PMC free article] [PubMed] [Google Scholar]
- 13.Zagorski MG, Norman DG, Barrow CJ, Iwashita T, Tachibana K, Patel DJ. Biochemistry. 1991;30:8009–8017. doi: 10.1021/bi00246a019. [DOI] [PubMed] [Google Scholar]
- 14.Opella SJ. Nat. Struct. Biol. 1997;10(Suppl4):845–848. [PubMed] [Google Scholar]
- 15.Shai Y, Fox J, Caratsch C, Shih YL, Edwards C, Lazarovici P. FEBS Lett. 1988;242:161–166. doi: 10.1016/0014-5793(88)81007-x. [DOI] [PubMed] [Google Scholar]
- 16.Hallock KJ, Wildman KAH, Lee DK, Ramamoorthy A. Biophys. J. 2002;82:2499–2503. doi: 10.1016/S0006-3495(02)75592-6. [DOI] [PMC free article] [PubMed] [Google Scholar]
- 17.Lee D, Wildman KH, Ramamoorthy A. J. Am. Chem. Soc. 2004;126:2318–2319. doi: 10.1021/ja039077o. [DOI] [PubMed] [Google Scholar]
- 18.Kumar AE, R. R, Wuthrich K. Biochem. Biophys. Res. Commun. 1980;95:1–6. doi: 10.1016/0006-291x(80)90695-6. [DOI] [PubMed] [Google Scholar]
- 19.Piotto M, Saudek V, Sklenar VJ. J. Biomol. NMR. 1992;2:661–665. doi: 10.1007/BF02192855. [DOI] [PubMed] [Google Scholar]
- 20.Bax A, Davis DG. J. Magn. Reson. 1985;65:355–360. [Google Scholar]
- 21.Shaka AJ, Lee CJ, Pines A. J. Magn. Reson. 1988;77:274–293. [Google Scholar]
- 22.Delaglio F, Grzesiek S, Vuister GW, Zhu G, Pfeifer J, Bax A. J. Biomol. NMR. 1995;6:277–293. doi: 10.1007/BF00197809. [DOI] [PubMed] [Google Scholar]
- 23.Goddard TD, Kneller DG. University of California; San Francisco: 1999. [Google Scholar]
- 24.Roberts GCK. In: NMR of Macromolucules. Rickwood D, Hames BD, editors. IRL Press; New York: 1993. pp. 315–387. [Google Scholar]
- 25.Henzler-Wildman KA, Martinez GV, Brown MF, Ramamoorthy A. Biochemistry. 2004;43:8459–8469. doi: 10.1021/bi036284s. [DOI] [PubMed] [Google Scholar]
- 26.Metz G, Wu X, Frommberger F, Hoffmann M, Husmann D, Keil J, Nakamura S. J. Magn. Reson. A. 1994;110:219–227. [Google Scholar]
- 27.Bennet AE, Rienstra CM, Auger M, Lakshmi KV, Griffin RG. J. Chem. Phys. 1995;103:6951–6958. [Google Scholar]
- 28.Yang J, Parkanzky PD, Bodner ML, Duskin CA, Weliky DP. J. Magn. Reson. 2002;159:101–110. doi: 10.1016/s1090-7807(02)00033-2. [DOI] [PubMed] [Google Scholar]
- 29.Lee D, Ramamoorthy A. J. Phys. Chem. B. 1999;103:271–275. [Google Scholar]
- 30.Wildman KAH, Lee D, Ramamoorthy A. Biopol. 2002;64:246–254. doi: 10.1002/bip.10180. [DOI] [PubMed] [Google Scholar]
- 31.Brunger A. X-PLOR Version 3.1: A System for X-ray Crystallography and NMR. Yale University; New Haven: 1992. [Google Scholar]
- 32.Nilges M, Gronenborn AM, Brunger AT, Clore GM. Protein Eng. 1988;2:27–38. doi: 10.1093/protein/2.1.27. [DOI] [PubMed] [Google Scholar]
- 33.Garret DS, Kuszewski J, Hancock TJ, Lodi PJ, Vuister GW, Groneneborn AM, Clore GM. J. Magn. Reson. B. 1994;104:99–103. doi: 10.1006/jmrb.1994.1061. [DOI] [PubMed] [Google Scholar]
- 34.Laskowski RA, Rullman JAC, MacArther MW, Kaptein R, Thornton JM. J. Biomol. NMR. 1998;8:477–486. doi: 10.1007/BF00228148. [DOI] [PubMed] [Google Scholar]
- 35.Damberg P, Jarvet J, Graslund A. Methods Enzymol. 2001;229:271–285. doi: 10.1016/s0076-6879(01)39318-7. [DOI] [PubMed] [Google Scholar]
- 36.Beswick V, Guerois R, Cordier-Ochsenbien F, Coic YM, Huynh-Dinh T, Tostian J, Noel JP, Sanson A, Neumann JM. Eur. Biophys. J. 1998;28:48–58. doi: 10.1007/s002490050182. [DOI] [PubMed] [Google Scholar]
- 37.Thennarasu S, Nagaraj R. Biopol. 1997;41:635–645. doi: 10.1002/(SICI)1097-0282(199705)41:6<635::AID-BIP4>3.0.CO;2-R. [DOI] [PubMed] [Google Scholar]
- 38.Thennarasu S, Nagaraj R. Int. J. Pept. Protein Res., 1995;46:480–486. doi: 10.1111/j.1399-3011.1995.tb01603.x. [DOI] [PubMed] [Google Scholar]
- 39.Lelkes PI, Lazarovici P. FEBS Lett. 1988;230:131–136. doi: 10.1016/0014-5793(88)80656-2. [DOI] [PubMed] [Google Scholar]
- 40.Dyson HJ, Wright PE. Annu. Rev. Biophys. Biophys. Chem. 1991;20:519–538. doi: 10.1146/annurev.bb.20.060191.002511. [DOI] [PubMed] [Google Scholar]
- 41.Mascioni A, Karim C, Barany G, Thomas DD, Veglia G. Biochemistry. 2002;41:475–482. doi: 10.1021/bi011243m. [DOI] [PubMed] [Google Scholar]
- 42.Zamoon J, Mascioni A, Thomas DD, Veglia G. Biophys. J. 2003;85:2589–2598. doi: 10.1016/s0006-3495(03)74681-5. [DOI] [PMC free article] [PubMed] [Google Scholar]
- 43.Mascioni A, Porcelli F, Ilangovan U, Ramamoorthy A, Veglia G. Biopol. 2003;69:29–41. doi: 10.1002/bip.10305. [DOI] [PubMed] [Google Scholar]
- 44.Bloom M, Davis JH, Mackay AL. Chem. Phys. Lett. 1981;80:198–202. [Google Scholar]
- 45.Martinez GV, Dykstra EM, Lope-Piedrafita S, Brown MF. Langmuir. 2004;20:1043–1046. doi: 10.1021/la036063n. [DOI] [PubMed] [Google Scholar]
- 46.Saberwal G, Nagaraj R. J. Biol. Chem. 1993;268:14081–14089. [PubMed] [Google Scholar]
- 47.Shai Y. Biochim. Biophys. Acta. 1999;1462:55–70. doi: 10.1016/s0005-2736(99)00200-x. [DOI] [PubMed] [Google Scholar]
- 48.Harzer U, Bechinger B. Biochemistry. 2000;39:13106–13144. doi: 10.1021/bi000770n. [DOI] [PubMed] [Google Scholar]
- 49.Scherer PG, Seelig J. Biochemistry. 1989;28:7720–7728. doi: 10.1021/bi00445a030. [DOI] [PubMed] [Google Scholar]
- 50.Thayer AM, Kohler SJ. Biochemistry. 1981;20:6831–6834. doi: 10.1021/bi00527a014. [DOI] [PubMed] [Google Scholar]
- 51.Tian C, Gao PF, Pinto LH, Lamb RA, Cross TA. Protein Sci. 2003;12:2597–2605. doi: 10.1110/ps.03168503. [DOI] [PMC free article] [PubMed] [Google Scholar]
- 52.Oren Z, Shai Y. Biopol. 1998;47:451–463. doi: 10.1002/(SICI)1097-0282(1998)47:6<451::AID-BIP4>3.0.CO;2-F. [DOI] [PubMed] [Google Scholar]
- 53.Lam YH, Wassall SR, Morton CJ, Smith R, Separovic F. Biophys. J. 2001;81:2752–2761. doi: 10.1016/S0006-3495(01)75918-8. [DOI] [PMC free article] [PubMed] [Google Scholar]
- 54.Smith R, Separovic F, Milne TJ, Whittaker A, Bennett FM, Cornell BA, Makriyannis A. J. Mol. Biol. 1994;241:456–466. doi: 10.1006/jmbi.1994.1520. [DOI] [PubMed] [Google Scholar]
- 55.Batenburg AM, Van Esch JH, De Kruijff B. Biochemistry. 1988;27:2324–2331. doi: 10.1021/bi00407a013. [DOI] [PubMed] [Google Scholar]
- 56.Dufourcq J, Faucon JF, Fourche G, Dasseux JL, Le Marie M, Gulik-Krzywicki T. Biochim. Biophys. Acta. 1986;859:33–48. doi: 10.1016/0005-2736(86)90315-9. [DOI] [PubMed] [Google Scholar]
- 57.Thennarasu S, Nagaraj R. Protien Eng. 1996;9:1219–1224. doi: 10.1093/protein/9.12.1219. [DOI] [PubMed] [Google Scholar]
- 58.Nagaraj R. Curr. Sci. 1997;72:819–825. [Google Scholar]
- 59.Hallock KJ, Lee DK, Ramamoorthy A. Biophys. J. 2003;84:3052–3060. doi: 10.1016/S0006-3495(03)70031-9. [DOI] [PMC free article] [PubMed] [Google Scholar]
Associated Data
This section collects any data citations, data availability statements, or supplementary materials included in this article.


