

Abstract
Bone structure is an important determinant of osteoporotic fracture. In women bone structure is highly heritable and several quantitative trait loci (QTL) have been reported. There are few comparable data in men. This study in men aimed at establishing the heritability of bone structure at the proximal femur, identifying QTL contributing to normal variation in bone structure, and determining which QTL might be sex-specific. Bone structure at the proximal femur was measured in 205 pairs of brothers age 18–61. Heritability was calculated and linkage analysis performed on phenotypes at the proximal femur. Heritability estimates ranged from 0.99 to 0.39. A genome wide scan identified suggestive QTL (LOD>2.2) for femoral shaft width on chromosome 14q (LOD=2.69 at position 99cM), calcar femorale at chromosome 2p (LOD= 3.97 at position 194cM) and at the X chromosome (LOD= 3.01 at position 77cM), femoral neck width on chromosome 5p (LOD=2.28 at position 0 cM), femoral head width on chromosome 11q (LOD=2.30 at position 131 cM) and 15q (LOD=3.11 at position 90 cM), and pelvic axis length on chromosome 4q (LOD= 4.16 at 99cM) and 17q (LOD=2.80 at position 112 cM). Comparison with published data in 437 pairs of premenopausal sisters from the same geographical region suggested that 3 of the 7 autosomal QTL were male-specific. This study demonstrates that bone structure at the proximal femur in healthy men is highly heritable. The occurrence of sex-specific genes in humans for bone structure has important implications for the pathogenesis and treatment of osteoporosis.
Keywords: femoral structure, sex-specific, QTL, men, proximal femur
INTRODUCTION
Decreased bone strength is a major determinant of age-related osteoporotic hip fracture. With age there is a universal loss of bone mass at the hip [1] which decreases bone strength and a increase in bone size [2] [3] which at some structural sites improves bone strength [4]. Bone structure contributes substantially to bone strength at the hip and a number of structural variables predict the risk of hip fracture [5] [6] [7]. American white women have differences in bone structure at the proximal femur as compared to American black women [8] [9] and have about three times the incidence of osteoporotic hip fracture [10, 11]. Women have smaller skeletons than men and have about four times the incidence of osteoporotic fracture [10]. Although the incidence of osteoporotic hip fracture in men is less than in women, it has been estimated that of the 1.66 million hip fractures occurring world wide in 1990 about 28% occurred in men [12].
It is generally considered that bone strength is a polygenic trait and that age-related osteoporosis is a complex disease, with both genetic and environmental determinants [13]. In women, heritability of bone structure at the hip is high [13] and a number of QTL have been identified [9]. In men, however, there are few comparable studies.
Studies in congenic mice [14] strongly suggest that some of the genes underlying femoral structure in the mouse are sex-specific. It was shown that QTL on mouse chromosomes 1 and 18 impart sex-specific effects on femoral structure in mice as quantified by polar moment of inertia. Some studies in humans demonstrate that heritability of bone strength is higher in mother-daughter and father-son pairs than across sexes [15] [16] [17], suggesting that there may be sex-specific genes for bone structure. Sex-specific genes may underlie the marked differences in skeletal size and structure that are observed between men and women of the same race. The presence of sex-specific genes may also imply that there are sex-specific variations in the response of bone to both environment and medications aimed at preventing and treating osteoporosis and other metabolic bone diseases.
The aims of this study were to establish the heritability of bone structure at the proximal femur in healthy men; to perform a genome wide scan to identify QTL underlying bone structure; and to examine whether some of these loci may be sex-specific by comparing the QTL identified in men with the QTL previously published from a sample of healthy premenopausal sister pairs drawn from the same geographical location [9].
MATERIALS AND METHODS
Subjects
The sample of men comprised 205 pairs (351 individuals) of healthy, white, full brother pairs, aged 18 to 61 years, recruited from 1999 to 2003 (Table 1). The sample of women used for comparison comprised 437 pairs (661 individuals) of white healthy full sister pairs, aged 20 to 45 years from the same geographical region of the USA as the men [9] (Table 1). The studies were performed on the General Clinical Research Center at Indiana University. A blood sample was collected for DNA, health and life style questionnaires were administered, anthropometrics obtained and radiographs of the proximal femur obtained for measure of bone structure. In addition, blood was collected for DNA from one or both parents, where possible. No phenotypic information was obtained from the parents but the genotypic data were used in the linkage analysis to improve the ability to accurately estimate marker allele sharing among brother pairs. Informed written consent, approved by Indiana University-Purdue University Indianapolis and Clarian IRB, was obtained from all subjects.
Table 1.
Height, weight, age and bone structure in men in the current study and in women in our published study [9].
| Men | Women | ||||
|---|---|---|---|---|---|
| Variable | N | Mean (SD) | N | Mean (SD) | p-value |
| Height (cm) | 351 | 178.3 (6.9) | 661 | 165.2 (6.1) | 0.001 |
| Weight (kg) | 351 | 87.3 (16.4) | 661 | 68.6 (15.1) | 0.001 |
| Age (years) | 351 | 34.2 (10.7) | 661 | 33.4 (7.1) | 0.24 |
| Femoral shaft width (mm) | 351 | 34.1 (3.2) | 661 | 30.5 (2.7) | 0.001 |
| Femoral medulla width (mm) | 351 | 13.8 (2.2) | 661 | 11.8 (1.9) | 0.001 |
| Calcar femorale width (mm) | 351 | 6.7 (1.5) | 661 | 5.5 (1.2) | 0.001 |
| Femoral head width (mm) | 350 | 59.3 (3.7) | 661 | 52.4 (3.0) | 0.001 |
| Femoral neck width (mm) | 350 | 42.9 (3.8) | 661 | 35.7 (2.7) | 0.001 |
| Femoral axis length (mm) | 350 | 122.3 (8.2) | 661 | 110.1 (6.7) | 0.001 |
| Pelvic axis length (mm) | 349 | 23.9 (4.7) | 661 | 19.1 (4.1) | 0.001 |
Methods
Radiographs of the lower pelvis to include both upper femurs in 15° internal rotation were taken on standard X-ray equipment using a focal distance of 40 inches (100 cm) and PDG1 Kodak film. The width of the femur shaft and medulla at the midshaft (narrowest diameter), length of the femur neck and pelvic axis, maximal width of the femur head, minimal width of the femoral neck and widest thickness of the calcar femorale [18] (Peacock M, Liu G, Carey M, Ambrosius W, Turner CH, Hui S, Johnston CC. Bone mass and structure at the hip in men and women over the age of 60 Osteoporosis International. 1998;8:231–239) (Figure 1) were measured directly from the radiographs by one observer using a Digimatic Caliper (Mitutoyo, Japan) as previously described[18]. Height and weight were measured using a Harpenden Stadiometer and a Scale-Tronix weighing scale, which were regularly calibrated throughout the study.
Figure 1.
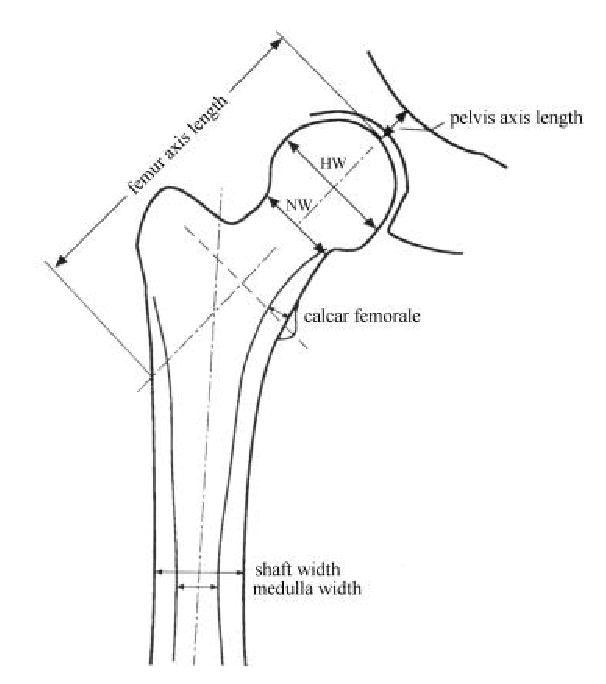
Diagram of the proximal femur showing the structural variables measured from radiograph (NW= minimum width of femoral neck, HW= maximum width of femoral head)
DNA and Marker Genotyping
DNA was isolated using standard techniques and stored in a DNA repository. A genome scan was performed at the Center for Inherited Disease Research using automated fluorescent microsatellite analysis. PCR products were sized on an ABI 3700 sequencer. The marker set used was a modification of the Cooperative Human Linkage Center version 9 marker set with 402 markers, at average spacing of 9cM and average heterozygosity of 0.76 [www.cidr.jhmi.edu]. A total of 178,029 genotypes were produced from 464 samples. The error rate on duplicate samples was 0.05% and the genotypic data missing was 3.53% The marker genotype data were used to verify full sibling relationships among subjects using the computer programs RELATIVE [19] and RELPAIR [20], and half sibling pairs (n=13) were eliminated from further analysis.
Genetic analysis
Stepwise regression analysis was employed on bone structure phenotypes using height, weight, pack-years of smoking, and age to identify significant covariates with bone structure. Height, which was a significant predictor of bone structure (p<0.10) in regression model fitting, was used as a covariate in the heritability and linkage analyses.
Heritability of hip structure phenotypes were calculated from the sibpair data using variance components modeling as implemented in the polygenic command of the computer program SOLAR [21]. Differences in heritability estimates between males and females were tested by transforming the calculated heritability values into normal deviates using Fisher’s z-transformation [22]. The statistical comparison was then made using a standard z-test. Multipoint quantitative linkage analysis was performed for the bone structure phenotypes using the maximum likelihood variance estimation method as implemented in the computer package Mapmaker/SIBS [23]. Chromosomal positions, marker order and sex-averaged map positions were obtained from the Marshfield electronic data base [www.marshmed.org/genetics/]. LOD scores were computed at 1cM intervals along each autosome and the X chromosome. In families with more than two brothers, all possible sibling pairs were used in the analysis. Observed allele frequencies in the individuals genotyped for the genome screen were used. To confirm the robustness of linkage, analyses were also performed using only independent sibling pairs and implementing the more conservative Haseman-Elston regression approach [24].
Evaluation of Sex-Specific QTL
Premenopausal sister pairs (n=437) from the same geographical region in the USA (Indiana) were studied under an identical protocol [9]. A genome wide scan was performed by the Center for Inherited Disease Research using an identical panel of microsatellite markers. QTL for structure at the hip were identified using Mapmaker/SIBS [23]. Genotypic and phenotypic data from the brother and sister sample were combined to perform a joint linkage analysis in chromosomal regions demonstrating linkage in the brother sample. To correct for structural differences between men and women sex-specific regression residuals were computed separately for each sex. These sex-specific residuals, representing the degree to which an individual’s structural phenotype differed from the mean for her/his sex, were employed as the phenotype in the combined male/female linkage analysis.
To formally test the hypothesis that QTL identified in the brothers’ genome screen were sex-specific, the traditional Haseman-Elston regression test for linkage [24] was extended. This test uses structure phenotypic data and marker genotype from each sibling pair. In each sibling pair, the difference in structure phenotype is calculated and then squared. The genotypic marker information is used to compute the number of alleles identical by descent (IBD) that is shared by the sibling pair. Alleles are IBD if siblings inherit the same allele from the same parent. Since each sibling has inherited two alleles at a marker locus for each autosomal chromosome, a sibling pair can share 0, 1 or 2 alleles IBD.
The Haseman-Elston regression test is based on the principle that if the marker being tested is in close physical proximity to a gene influencing structure phenotype, then siblings with similar structure phenotype would be expected to share marker alleles IBD near the structure phenotype locus. Conversely, siblings with dissimilar structure phenotype would be expected to share few marker alleles IBD near a structure phenotype locus. The original formulation [1] of the Haseman-Elston linkage test employs a regression approach to examine the relationship between the difference in structure phenotype between sibling pairs and the extent of marker IBD allele sharing.
| (1) |
In this formula, m is the regression slope and c is the intercept. The dependent variable is the square of the difference in structure phenotype between individuals of the sibling pair. This is regressed on the proportion of alleles shared identical by descent (IBD) by the sibling pairs at the marker locus. Each sibling pair provides a single observation in the regression model. Under the null hypothesis of no linkage, the slope of the regression line will not significantly deviate from zero, suggesting that there is no relationship between structure phenotype values and the extent of marker IBD allele sharing among sibling pairs. Under the alternative hypothesis of linkage, the slope of the regression line would significantly differ from zero and must have a negative slope in order to be consistent with linkage. In this instance, those sibling pairs with similar structure phenotype values would share more alleles IBD and those siblings with differing structure phenotype values would share fewer alleles IBD.
We have modified the Haseman-Elston model in order to employ this approach to test for sex-specific effects of a QTL. The key change to the regression formula is the addition of a variable ‘pair type’ which indicates whether the sibling pair is a male/male or female/female pair. The model now becomes:
| (2) |
where c and m are defined as in (1) and pair type indicates whether the sibling pair is a male or female pair. Because we have now included a new variable in the equation, we have two new quantities. The first is ‘pair type’ along with its coefficient ‘a’. The coefficient ‘a’ is estimated from the data and allows the regression lines for the male/male and female/female siblings to have differing Y intercepts. This parameter is not biologically relevant for our test of sex-specific QTL. The second quantity is ‘pair type * IBD’, and along with its coefficient ‘b’ is the key addition to our extended model. This quantity includes the interaction between the type of sibling pair and their IBD allele sharing at a marker in the QTL region. The coefficient ‘b’ represents the difference in the slope of the regression lines between male and female sibling pairs. Under the null hypothesis that there are no sex differences in the effect of the QTL, the estimate of ‘b’ would not be significantly different from zero due to the similar male and female regression slopes. Under the alternative hypothesis that the QTL has effect in males but not females, the slopes would differ and the estimate of b would be significantly different from zero.
Test for sex-specificity of QTL was performed only at QTL where linkage was detected in brother pairs, and only for autosomal QTL because of lack of power to detect X-linked loci in sister pairs [25]. Multipoint estimates for IBD were obtained for each sibling pair at the QTL to be tested using the Mapmaker/SIBS software package [23]. The analysis of covariance model, equation 2 described above, is fitted using the generalized linear models procedure in the SAS software package version 9 (2004). A Bonferroni adjustment for multiple comparisons was used to set the significance level of the p-values for the test of sex-specificity, taking the number of independent chromosome regions tested into account.
RESULTS
The men were taller and heavier (p<0.001), but were not significantly older in comparison to our published sample of women (Table 1). All structural variables were significantly greater (p<0.001) in the men than the women (Table 1). The number of parents of men genotyped was 131 whereas in women it was 122 (Table 2). Heritability of structure variables at the proximal femur in men were high ranging from 0.99 to 0.39 and were comparable to those in women which ranged from 0.81 to 0.55 (Table3). Only femoral shaft width heritability was significantly lower in women than men (p<0.02).
Table 2.
Number of families, pairs and parents genotyped
| Sex | Families | Pairs | All Possible Pairs | Parents Genotyped |
|---|---|---|---|---|
| Brother | 167 | 184 | 205 | 113 |
| Sister | 303 | 366 | 437 | 122 |
A genome wide scan in men identified 8 QTL for bone structure with maximum LOD scores >2.2, the criterion proposed for suggestive evidence of linkage [26](Table 4). Evidence of linkage on chromosomes 2p was with calcar femorale (LOD=3.97 at Marshfield position 194 cM), 4p with pelvic axis length (LOD=4.16 at position 99cM), on chromosome 5p with femoral neck width (LOD= 2.28 at position 0cM), on chromosome 11q with femoral head width(LOD=2.30 at position 131 cM), on chromosome 14q with femoral midshaft width (LOD=2.69 at position 99 cM), chromosome 15q with femoral head width (LOD=3.11 at position 99cM), on chromosome 17q with pelvic axis length (LOD=2.80 at position 112 cM), and on the X chromosome with calcar femorale (LOD=3.01 at position 77cM). Linkage results were similar using only independent sibling pairs and when implementing the more conservative Haseman-Elston regression approach [24].
Table 4.
Suggestive QTL for height-adjusted femoral structure identified in men and the corresponding LOD scores for women alone and men and women combined. Male-specific QTL (p<0.007) are in bold. The Marshfield map position is shown in cM.
| Men | Women | Men + Women | Sex-specific | |||
|---|---|---|---|---|---|---|
| Phenotype | Chromosome | Position | LOD | LOD | LOD | p-value |
| Femoral shaft width | 14q | 99 | 2.69 | 0.00 | 0.51 | 0.0084 |
| Calcar femorale width | 2p | 194 | 3.97 | 0.00 | 2.01 | 0.0001 |
| Calcar femorale width | X | 77 | 3.01 | 0.14 | 0.79 | N/A |
| Femoral neck width | 5p | 0 | 2.28 | 0.00 | 0.78 | 0.0001 |
| Femoral head width | 11q | 131 | 2.30 | 0.80 | 2.09 | 0.0267 |
| Femoral head width | 15q | 90 | 3.11 | 1.20 | 4.31 | 0.0072 |
| Pelvic axis length | 4p | 99 | 4.16 | 0.00 | 0.80 | 0.0001 |
| Pelvic axis length | 17q | 112 | 2.80 | 0.04 | 0.99 | 0.0372 |
Comparison of the linkage evidence in the brother and sister samples [9] suggested that the QTL for calcar femorale on chromosome 2p, for femoral neck on 5p and pelvic axis on 4p were male-specific (p<0.007) (Table 4) (Figure 2).
Figure 2.
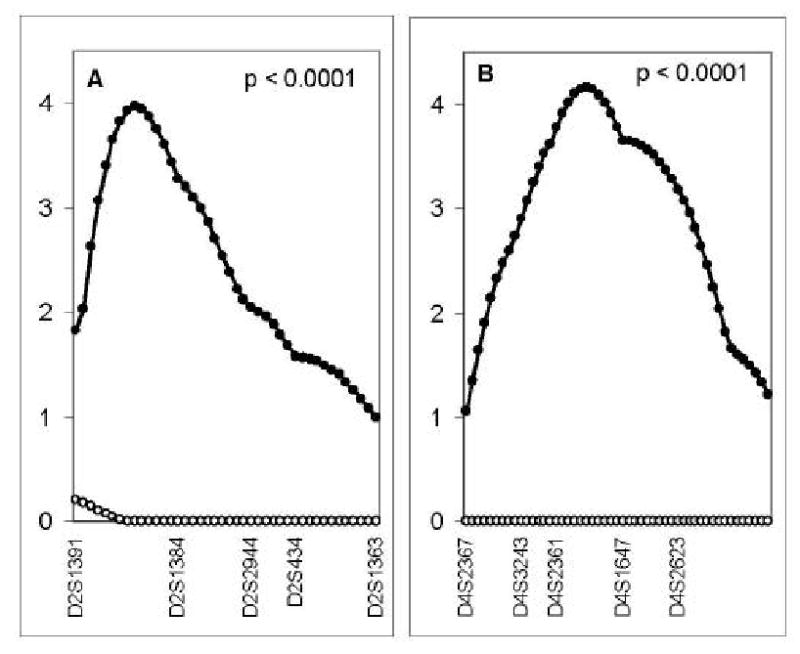
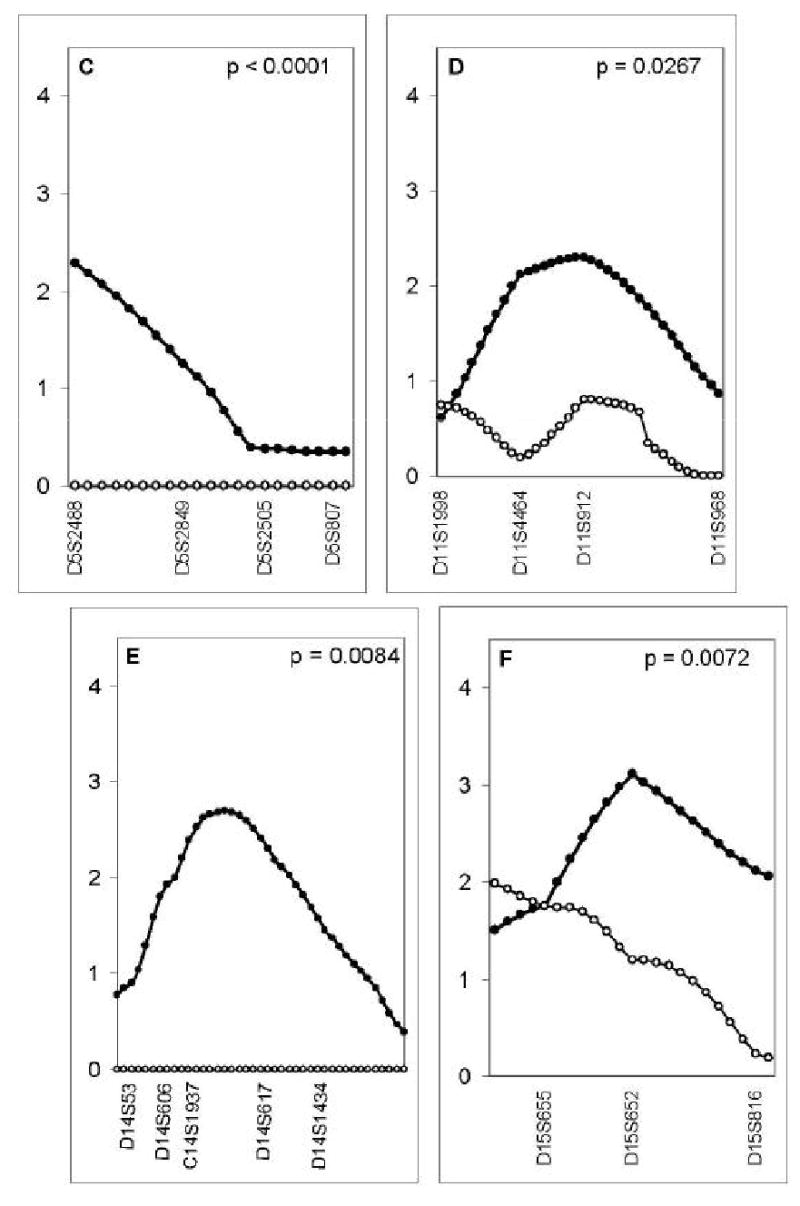
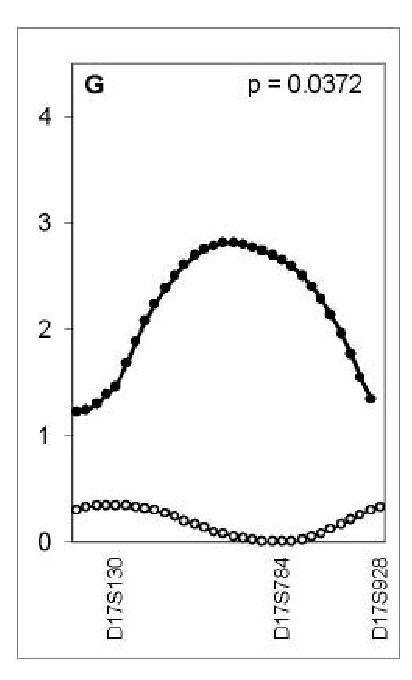
Maximum LOD score (y axis) for linkage in men (closed dots, distance between dots=1cM) and in women (open dots, distance between dots=1cM) at 7 autosomal QTL identified as having suggestive linkage in men from a genome wide scan: calcar femorale width on chromosome 2p (A), pelvic axis length on chromosome 4p (B), femoral neck width on chromosome 5p (C), femoral head width on chromosome 11q (D), femoral shaft width on chromosome 14q (E), femoral head width at chromosome 15q (F), and pelvic axis length on chromosome 17q (G). Markers spanning the QTL are shown on the lower x-axis. The sex-specific p values are shown in each panel.
DISCUSSION
This is one of the first studies to focus on the identification of genes underlying bone structure at the proximal femur in men. In comparison to our published sample of premenopausal women, men were taller and heavier and, as expected, structural measurements at the proximal femur were all greater in men. Heritability estimates of bone structure at the proximal femur were found to be as high, or higher, as those reported in premenopausal women. It should be noted that heritability estimates from sibling pair data may be inflated due to the confounding effects of a shared environment. However, this is not a confounding factor in twin studies, and for those structure phenotypes for which twin data are available, the heritability estimates are in agreement with those obtained in our studies in sibling pairs [13]
This genome wide scan in men identified 8 QTL whose maximum LOD score was greater than 2.2, suggesting linkage with bone structure. On chromosomes 4p the LOD score for calcar femorale and pelvic axis length were greater than 3.6, the level considered as significant evidence of linkage [26]. None of the 8 QTL in men was identified as having suggestive linkage in our study in women [9].
Criteria for identifying sex-specific QTL have not been established. In one study of inbred mice, the investigators defined sex-specific effects as three orders of magnitude differences in the P values [27]. In congenic mouse studies, sex-specific effects were determined by analysis of variance [14]. In our study we have used a relatively novel approach based on the Haseman-Elston test of linkage for sibpair data. We have extended this model to include a term representing an interaction between the sex of the sibpair members and genetic sharing at marker loci. The significance of this interaction term has been examined for all autosomal chromosomal regions demonstrating evidence of linkage in our sample of brother pairs. Significance criteria for the test of sex-specificity were obtained using a Bonferroni correction, taking the number of chromosomal regions tested into account. Using these criteria, we concluded that 3 of the 7 autosomal QTL identified in our study were male-specific.
This high number of sex-specific QTL is perhaps surprising since it is generally assumed that most of the genes underlying a complex trait are the same in both sexes. However, this is apparently not the case for bone mass since studies in mice indicate that there are more sex-specific QTL than sex-shared QTL. In studies of recombinant strains of mice it was found that 9 QTL for total body bone mineral density were in males and 7 in females [27]. However, only two of the QTL were shared between the two sexes and 5 QTL were specific to female mice and 6 QTL were male-specific. In the studies with congenic mice, 5 QTL were identified that influenced femoral strength. Of these, two imparted sex-specific effects on femoral structure and 1QTL influenced bone structure and bone strength.
The study has several limitations. The sample size in the brothers is relatively small for a linkage study. The samples of brothers and sisters are confined to American whites from Indiana. Thus these findings need to be replicated in a larger sample size and in samples from other racial groups. Although the measurement of most structural variables from radiographs is relatively precise because bone surface edges are clearly seen, some measures such as calcar femorale are more difficult and carry a larger error. Further, positioning of the subject and magnification differences in image due to patient size may introduce variation. The observation that QTL appear to be site-specific for structural phenotypes that are interrelated is potentially confusing. Suggestive linkage is set at a LOD >2.2 and phenotypes with lower LOD scores are not reported. For example, the QTL for head width on chromosome 15 also contained femoral neck width (LOD of 1.4) which has a correlation coefficient of 0.8 with head width.
In conclusion we found that heritability of bone structure at the proximal femur in men is high and that in a sample of brother pairs, 8 suggestive QTL underlying bone structure have been identified. Using sister pairs from the same geographical region studied under an identical protocol it appears that 3 of the 7 autosomal QTL may be male-specific. Our study suggests that sex-specific genes underlie differences between men and women in the structural variables at the hip contributing to bone strength and thus the risk of age-related hip fracture. This may contribute to our understanding of the reasons for the higher risk of osteoporotic fracture in women than men. The genes responsible for these differences may also provide targets for novel therapy aimed at prevention and treatment of hip fracture
Table 3.
Heritability, H2 (standard error), of height-adjusted femoral structure in brothers (n=275 pairs) and sisters (n=437 pairs).
| Phenotype | Brother H2 | Sister H2 | p-valuea |
|---|---|---|---|
| Femoral shaft width | 0.99 (0.13) | 0.66 (0.08) | 0.02 |
| Femoral medulla width | 0.76 (0.12) | 0.67 (0.08) | 0.54 |
| Calcar femorale width | 0.39 (0.13) | 0. 55 (0.08) | 0.32 |
| Femoral head width | 0.99 (0.13) | 0.74 (0.08) | 0.06 |
| Femoral neck width | 0.86 (0.11) | 0.70 (0.08) | 0.27 |
| Femoral axis length | 0.99 (0.13) | 0.81 (0.08) | 0.16 |
| Pelvic axis length | 0.71 (0.12) | 0.75 (0.08) | 0.79 |
For z-test of null hypothesis : heritability in men = heritability in women
Acknowledgments
We gratefully acknowledge the brothers and parents who participated in this study, as well as the study coordinators, without whom this work could not have been accomplished. This work was supported by NIH Grants, P01 AG-18397, R0 AR-43476, MO1 RR-00750, and K24 AR-02095. Genotyping was performed by CIDR
Footnotes
This work is supported by NIH Grants, P01 AG-18397, M01 RR-00750, K24 AR-02095
References
- 1.Looker AC, Wahner HW, Dunn WL, Calvo MS, Harris TB, Heyse SP, Johnston CC, Jr, Lindsay R. Updated data on proximal femur bone mineral levels of US adults. Osteoporos Int. 1998;8:468–89. doi: 10.1007/s001980050093. [DOI] [PubMed] [Google Scholar]
- 2.Smith RW, Jr, Walker RR. Femoral Expansion in Aging Women: Implications for Osteoporosis and Fracture. Science. 1964;145:156–7. doi: 10.1126/science.145.3628.156. [DOI] [PubMed] [Google Scholar]
- 3.Heaney RP, Barger-Lux MJ, Davies KM, Ryan RA, Johnson ML, Gong G. Bone dimensional change with age: interactions of genetic, hormonal, and body size variables. Osteoporos Int. 1997;7:426–31. doi: 10.1007/pl00004150. [DOI] [PubMed] [Google Scholar]
- 4.Beck TJ, Looker AC, Ruff CB, Sievanen H, Wahner HW. Structural trends in the aging femoral neck and proximal shaft: Analysis of the Third National Health and Nutrition Examination Survey dual-energy X-ray absorptiometry data. J Bone Miner Res. 2000;15:2297–304. doi: 10.1359/jbmr.2000.15.12.2297. [DOI] [PubMed] [Google Scholar]
- 5.Horsman A, Nordin BEC, Simpson M, Speed R. Cortical and trabecular bone status in elderly women with femoral neck fracture. Clin Orthop. 1982;166:143–51. [PubMed] [Google Scholar]
- 6.Faulkner KG, Cummings SR, Black D, Palermo L, Glüer CC, Genant HK. Simple Measurement of Femoral Geometry Predicts Hip Fracture: The Study of Osteoporotic Fractures. J Bone Min Res. 1993;8 (10):1211–7. doi: 10.1002/jbmr.5650081008. [DOI] [PubMed] [Google Scholar]
- 7.Peacock M, Turner CH, Liu G, Manatunga AK, Timmerman L, Johnston CC., Jr Better discrimination of hip fracture using bone density, geometry and architecture. Osteoporosis International. 1995;5:167–73. doi: 10.1007/BF02106096. [DOI] [PubMed] [Google Scholar]
- 8.Mikhail MB, Vaswani AN, Aloia JF. Racial differences in femoral dimensions and their relation to hip fracture. Osteoporos Int. 1996;6:22–4. doi: 10.1007/BF01626533. [DOI] [PubMed] [Google Scholar]
- 9.Koller DL, White K, Liu G, Hui SL, Conneally PM, Johnston CC, Econs MJ, Foroud T, Peacock M. Linkage of Structure at the Proximal Femur to Chromosomes 3, 7, 8 and 19. Journal of Bone & Mineral Research. 2003;18:1057–65. doi: 10.1359/jbmr.2003.18.6.1057. [DOI] [PubMed] [Google Scholar]
- 10.Kellie SE, Brody JA. Sex-specific and race-specific hip fracture rates. Am J Public Health. 1990;80:326–8. doi: 10.2105/ajph.80.3.326. [DOI] [PMC free article] [PubMed] [Google Scholar]
- 11.Silverman SL, Madison RE. Decreased incidence of hip fracture in Hispanics, Asians, and Blacks: California Hospital Discharge Data. AJPH. 1988;78:1482–3. doi: 10.2105/ajph.78.11.1482. [DOI] [PMC free article] [PubMed] [Google Scholar]
- 12.Cooper C, Campion G, Melton LJ., III Hip fractures in the elderly: A world-wide projection. Osteoporosis Int. 1992;2:285–9. doi: 10.1007/BF01623184. [DOI] [PubMed] [Google Scholar]
- 13.Peacock M, Turner CH, Econs MJ, Foroud T. Genetics of Osteoporosis. Endo Rev. 2002;23:303–26. doi: 10.1210/edrv.23.3.0464. [DOI] [PubMed] [Google Scholar]
- 14.Turner CH, Sun Q, Schriefer J, Pitner N, Price R, Bouxsein ML, Rosen CJ, Donahue LR, Shultz KL, Beamer WG. Congenic mice reveal sex-specific genetic regulation of femoral structure and strength. Calcif Tissue Int. 2003;73:297–303. doi: 10.1007/s00223-002-1062-1. [DOI] [PubMed] [Google Scholar]
- 15.Duncan EL, Cardon LR, Sinsheimer JS, Wass JA, Brown MA. Site and gender specificity of inheritance of bone mineral density. J Bone Miner Res. 2003;18:1531–8. doi: 10.1359/jbmr.2003.18.8.1531. [DOI] [PubMed] [Google Scholar]
- 16.Van P, I, Goemaere S, Zmierczak H, De Bacquer D, Kaufman JM. Deficient acquisition of bone during maturation underlies idiopathic osteoporosis in men: evidence from a three-generation family study. J Bone Miner Res. 2003;18:303–11. doi: 10.1359/jbmr.2003.18.2.303. [DOI] [PubMed] [Google Scholar]
- 17.Jones G, Nguyen TV. Associations between maternal peak bone mass and bone mass in prepubertal male and female children. J Bone Miner Res. 2000;15:1998–2004. doi: 10.1359/jbmr.2000.15.10.1998. [DOI] [PubMed] [Google Scholar]
- 18.Peacock M, Liu G, Carey M, Ambrosius W, Turner CH, Hui SL, Johnston CC., Jr Bone mass and structure at the hip in men and women over the age of 60 years. Osteoporosis International. 1998;8:231–9. doi: 10.1007/s001980050059. [DOI] [PubMed] [Google Scholar]
- 19.Goring HH, Ott J. Relationship estimation in affected sib pair analysis of late-onset diseases. Eur J Hum Genet. 1997;5:69–77. [PubMed] [Google Scholar]
- 20.Boehnke M, Cox NJ. Accurate inference of relationships in sib-pair linkage studies. Am J Hum Genet. 1997;61:423–9. doi: 10.1086/514862. [DOI] [PMC free article] [PubMed] [Google Scholar]
- 21.Almasy L, Blangero J. Multipoint quantitative-trait linkage analysis in general pedigrees. Am J Hum Genet. 1998;62:1198–211. doi: 10.1086/301844. [DOI] [PMC free article] [PubMed] [Google Scholar]
- 22.Sham P. Statistics in Human Genetics. New York: Oxford University Press; 1988, p. 194.
- 23.Kruglyak L, Lander ES. Complete multipoint sib-pair analysis of qualitative and quantitative traits. Am J Hum Genet. 1995;57:439–54. [PMC free article] [PubMed] [Google Scholar]
- 24.Haseman JK, Elston RC. The investigation of linkage between a quantitative trait and a marker locus. Behav Genet. 1972;2:3–19. doi: 10.1007/BF01066731. [DOI] [PubMed] [Google Scholar]
- 25.Song KK, Feingold E, Weeks DE. Statistics for nonparametric linkage analysis of X-linked traits in general pedigrees. Am J Hum Genet. 2002;70:181–91. doi: 10.1086/338308. [DOI] [PMC free article] [PubMed] [Google Scholar]
- 26.Lander ES, Kruglyak L. Genetic dissection of complex traits: guidelines for interpreting and reporting linkage results. Nature Genetics. 1995;11:241–7. doi: 10.1038/ng1195-241. [DOI] [PubMed] [Google Scholar]
- 27.Orwoll ES, Belknap JK, Klein RF. Gender specificity in the genetic determinants of peak bone mass1. J Bone Miner Res. 2001;16:1962–71. doi: 10.1359/jbmr.2001.16.11.1962. [DOI] [PubMed] [Google Scholar]