

Abstract
The photochemistry of the 13-desmethyl (DM) analog of bacteriorhodopsin (BR) is examined by using spectroscopy, molecular orbital theory and chromophore extraction followed by conformational analysis. The removal of the 13-methyl group permits the direct photochemical formation of a thermally stable, photochemically reversible state, P1DM, (λmax = 525 nm) which can be generated efficiently by exciting the resting state, bRDM with yellow or red light (λ > 590 nm). Chromophore extraction analysis reveals that the retinal configuration in P1DM is 9-cis, identical to that of retinal in the native BR P1 state. FTIR and Raman experiments on P1DM indicate an anti configuration around the C15=N bond, as would be expected of an O-state photoproduct. However, low temperature spectroscopy and ambient, time-resolved studies indicate that the P1DM state forms primarily via thermal relaxation from the LDDM state. Theoretical studies on the BR binding site show that 13-dm retinal is capable of isomerizing into a 9-cis configuration with minimal steric hindrance from surrounding residues, in contrast to the native chromophore in which surrounding residues significantly obstruct the corresponding motion. Analysis of the photokinetic experiments indicates that the Arrhenius activation energy of the bRDM → P1DM transition in 13-dm-BR is less than 0.6 kcal/mol (vs. 22 ± 5 kcal/mol measured for the bR → P (P1 and P2) reaction in 85:15 glycerol:water suspensions of WT). Consequently, the P1DM state in 13-dm-BR can form directly from all-trans, 15-anti intermediates (bRDM and ODM) or all-trans, 15-syn (KDDM/LDDM) intermediates. This study demonstrates that the 13-methyl group and its interactions with nearby binding site residues is primarily responsible for channeling one-photon photochemical and thermal reactions and is limited to the all-trans and 13-cis species interconversions in the native protein.
Keywords: retinal, branched photocycle, bioelectronics, P state, Q state, Halobacteria
1. Introduction
Retinal proteins operate as G-protein coupled receptors in visual photoreceptor cells, and as light-driven proton pumps and phototaxis receptors in archae and oceanic eubacteria.1–4 While the visual, archael and eubacterial retinal proteins are believed to have evolved independently, all share a similar tertiary structure involving seven transmembrane helices enclosing a retinal chromophore that is bound to the seventh helical segment via a Schiff base linkage to lysine. However, these retinal proteins differ significantly in terms of chromophore photochemistry. Whereas all visual pigments use a photobleaching sequence that constrains the protein to 11-cis to 11-trans interconversion, the bacterial and archael pigments constrain the photochemical and dark reactions to 13-trans and 13-cis interconversion. An important question that remains to be fully elucidated is how the protein mediates the conformational specificity and directionality of the bound chromophores. Steric constraints, electrostatic fields, and dispersive interactions all play an important role in wavelength selection in retinal proteins,5–7 and all three mechanisms likely contribute to directing the photochemical trajectories of bound chromophores.
Bacteriorhodopsin, the proton pump in the purple membrane of Halobacterium salinarum, provides an opportunity to examine the mechanistic details of photochemical steering because this protein shows remarkable stability when the chromophore or binding site residues are modified via chemical or genetic methods. Small perturbations in the chromophore or the surrounding protein are known to open up new photochemical pathways that allow examination of the relative importance of steric constraints, electrostatic fields, and dispersive interactions in detail.7–30 The goal of this study is to examine the role of steric interactions between the 13-methyl group of the chromophore and binding site residues on dark adaptation and photoisomerization by examining the photocycles associated with 13-desmethyl bacteriorhodopsin. As we will demonstrate, this analog provides a unique window into the role of steric interactions in inhibiting the all-trans to 9-cis photochemical pathway in the native protein.
The native protein, bacteriorhodopsin (BR), has seven trans-membrane α-helices and a retinal chromophore bound covalently to Lysine-216 through a protonated Schiff base (Structure 1 and Figure 1a).
Figure 1.
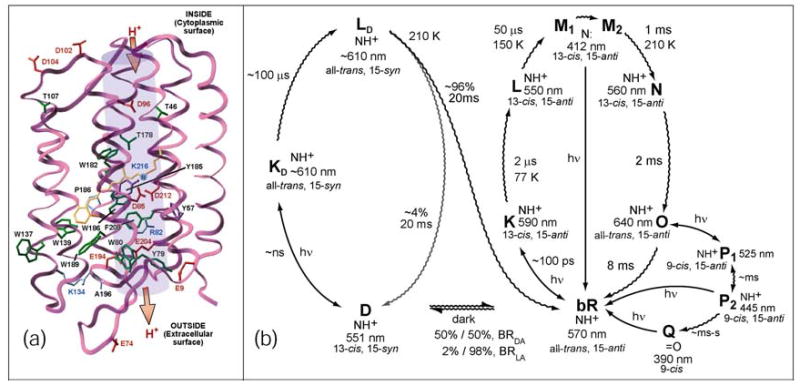
(a) A schematic representation of the bacteriorhodopsin tertiary structure. (b) The light adapted, branched (O → P → Q) (right) and dark-to-light (left) photocycles of BR. The dark adaptation process (bR → D) is believed to occur with a lifetime of ~2000 seconds .32
Structure 1.
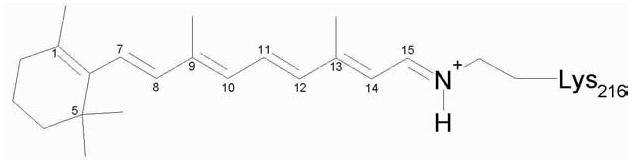
Retinylidene chromophore in the resting state of BR (all-trans, 15-anti retinal bound by a PSB linkage to Lys-216)
Light adapted BR (BRLA) consists of a majority (>98%) of the protein in the bR state (all-trans, 15-anti retinal) with a minority (<2%) in the D state (13-cis, 15-syn retinal).31 Light absorption by the all-trans form of the chromophore contained in the bR state initiates the portion of the photocycle shown in Figure 1b. The primary photochemical event involves all-trans to 13-cis photoisomerization forming the K state, the first thermally trappable intermediate. Proton pumping is effected through a series of dark reactions, forming in succession the L, M, N, and O intermediates, which ultimately reset the protein back to the bR resting state. The bacteriorhodopsin photocycle facilitates photophosphorylation in H. salinarum by generating a trans-membrane proton gradient, which can be used by the cell to do work, specifically through the generation of ATP.
Dark-adapted BR (BRDA), which forms at room temperature if the protein is left in the dark, exists in a thermodynamic equilibrium of two states, which are defined by the following chromophore configuration: all-trans, 15-anti retinal (bR, 53%) and 13-cis, 15-syn retinal (D, 47%).32 Both states respond to light, but only the light-adapted form pumps protons. To begin the dark-adapted photocycle (shown in the left in Figure 1b), the 13-cis, 15-syn D state chromophore isomerizes to all-trans, 15-syn upon light absorption (Figure 1b), forming the putative KD state (~ns formation time, subscript D denotes a product originating from the D state). The chromophore in the KD state thermally rearranges to form the LD state (~μs). Most of the protein (~96%) eventually relaxes back to the bR resting state (~ms), but a small amount returns to the D state (~4%, as extrapolated from Reference 31). The D state photocycle does not provide photochemical energy to H. salinarum, but converts a majority of the dark-adapted species to the light-adapted bR state.
Balashov has reviewed the complex photochemical branching that accompanies excitation of the various intermediates of the bR photocycle.7 Most of the photochemical intermediates involve all-trans ↔ 13-cis interconversion, but Popp et al. were the first to demonstrate that branching from the O state is unique.33 The conclusion of this study was that the all-trans conformation in the O state could be photochemically isomerized to form a 9-cis photoproduct, thereby generating distinct intermediates called the P and Q states.33 More recently, Gillespie et al. have shown that the Q state is formed via a two-step process involving two P-like states: P1 (λmax = 525 nm) → P2 (λmax = 445 nm) → Q (λmax = 390 nm).34 This study also examined the possible roll that the branched-photocycle might play in protecting the organism from UVA photodamage.34 In native BR, the bound 9-cis chromophore configuration is thought to be unstable in the binding site due to steric interactions of C9 and C13-methyl groups with nearby residues (Figure 2).14,28–30,34,35 Instability associated with these interactions ultimately results in the hydrolysis of the protonated Schiff base linkage and produces the unbound, trapped 9-cis retinal of the Q intermediate. The formation rates of the P and Q states in acrylamide gels have been shown to be thermally dependent,34,36 indicating a significant energy barrier to the formation of 9-cis chromophore-containing products in WT BR. To explore this steric-strain hypothesis, the concept that the rotational barrier to the formation of the 9-cis photoproduct is due primarily to steric hindrance, 13-dm-BR was prepared and its photochemistry was examined.
Figure 2.
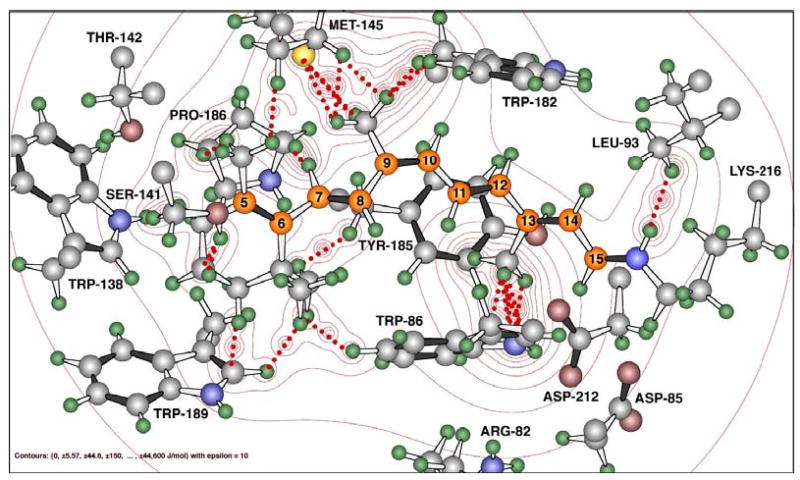
A theoretical model of the P state in native BR (based on work in from Tallent, et al.14) with the retinal chromophore in a 9-cis conformation indicating the steric strain between the two bulky residues – W86 and Y185, and the 13-methyl group of retinal. A similar model was also built for 13-dm-BR in this study with the same theoretical approach.
The photocycle of 13-dm-BR differs from that of WT BR.11–13,37,38 Gärtner et al. have shown that the 13-dm BR chromophore in the resting state comprises 15% all-trans, 15-anti retinal (bRDM) and 85% 13-cis, 15-syn retinal (DDM; superscript, DM, denotes 13-dm-BR and no superscript indicates native, or wild type (WT) BR) 11,32,39. Similar to the D state in WT BR, the DDM state does not readily pump protons (1 to 3%); however, the bRDM form is much less active than the native light-adapted form. Upon excitation of 13-dm-BR, the DDM chromophore isomerizes to an all-trans, 15-syn configuration, thereby forming the KDDM state, a KD-like species, with λmax = 600 nm. This state, with a lifetime on the μs time scale, isomerizes to another red-shifted intermediate, LDDM, (λmax = 610 nm), which has a relatively long lifetime of several milliseconds. Other studies have shown two M-like states, one short-lived (τ = 25 ms) and one long-lived (various lifetimes), form from both the 13-cis and all-trans resting states of 13-dm-BR.10–13
The present study finds only one M-like state, but this state has two potential reversion pathways. Furthermore, we have found a long-lived (τ > days), thermally stable, blue-shifted state, P1DM that is produced upon exposure of 13-dm-BR to yellow or red light. This state has an absorption maximum of 525 nm with a 9-cis chromophore configuration, identical to the P1 state of native BR. The ability to form this stable photoproduct in high yield provides a valuable window into the chromophore-protein interactions that serve to direct the photochemistry in the native protein. This study demonstrates that the 13-methyl group and its interactions with nearby binding site residues are primarily responsible for channeling both photochemical and thermal interconversions of the retinal chromophore to be limited to the all-trans and 13-cis species.
2. Materials and Methods
Sample Preparation
The chromophore analog, 13-desmethyl retinal, was synthesized using a published procedure.40 The product was purified with HPLC and characterized by NMR spectroscopy.
To generate 13-dm-BR, the apo-membrane first had to be isolated from WT BR. Purple membrane (PM) fractions were purified according to standard procedures41,42 and then diluted to 1.5 mg/mL with a solution of 0.5 M NH2OH·HCl (hydroxylamine hydrochloride) and 0.01 M TAPS (N-tris [hydroxymethyl] methyl-3-aminopropanesulfonic acid sodium salt) buffer (pH 8.5). Samples were then illuminated for 48 hours with light generated by a 400 W projector and passed through a Schott type OG (orange glass) non-interference filter and a 10-cm path length water cell. Samples were centrifuged and resuspended in a 0.01 M TAPS buffer (pH 8.5). This process of centrifugation and resuspension was repeated five times.
The chromophore analog, 13-desmethyl retinal, dissolved in a minimal amount of ethanol, was then added in 3-fold molar excess to reconstitute the apo-membrane. After reconstitution for ~12 hours, the new pigment was resuspended in a solution of 2% BSA in 0.05 M TAPS buffer (pH 8.5), and 0.01 M NaN3. Fifteen iterations, consisting of centrifugation followed by resuspension in BSA solution, were needed to wash the pigment and remove excess retinal analog. Finally, BSA was removed with ten washes of 0.01 M TAPS buffer (pH 8.5).
Retinal Extraction and Analysis
All operations were carried out in dim red light and using the protocol described by P. Scherrer and co-workers.39 Purple membrane suspension (~100 μL) was rapidly mixed with 250 μL of ice-cold ethanol in a vortex mixer. For those samples already at low temperature (i.e. 210 K for trapped MDM state), ethanol was precooled on a mixture of methanol and dry ice. After two minutes on ice with intermittent vortexing, 250 μL of ice-cold hexane was mixed continuously with the sample for 2 minutes. The resulting emulsion was centrifuged for 60 s (CLAY ADAMS® Brand compact II centrifuge). Retinal isomers, which are soluble in hexane, were separated using HPLC (Waters 600 Controller & Pump). Two preparatory silica columns (3.9 x 300 mm Nova-Pak HR®, Waters, WAT038501) were used, in series, to separate the isomers. The mobile phase, comprised of 4% tert-butyl methyl ether (TBME) in n-hexane, passed through the column at 1.4 mL/min. The peaks were identified and quantified in accordance with an HPLC study of 13-desmethyl retinal isomers.
UV-visible spectroscopy
A steady-state UV-visible spectrum was taken of 13-dm-BR in ~10 mM TAPS buffer (pH 8.5) from 260 to 850 nm at 1-nm resolution with a Cary 50 spectrophotometer (Varian Instruments, Australia). To form the P1DM state, samples in a 1-cm path length quartz fluorescence cuvette (Starna Cells, 21-Q-10) were illuminated with a 250 mW (~500 mW/cm2), 660 nm laser diode (Intellite # RS660-350). The samples were isolated from ambient light in an opaque container before and after exposure to prevent undesired photochemistry. Although the process requires many hours of illumination due to low quantum efficiency, the MDM state can be thermally trapped at 210 K by illuminating the resting state with 500 nm radiation.
Raman Spectroscopy
Samples of 13-dm-BR were prepared in either H2O or D2O, to a final optical density of about 3 OD at λmax. Samples prepared in D2O were centrifuged and washed with 1 mL portions of D2O three times (Eppendorf 5415C set to 14,000 rpm for 30 minutes) before finally being resuspended in 150 μL D2O. FT-Raman spectra of the samples (in 150 μL Quartz micro cuvettes Starna Cells #26.100-Q-10) were collected at room temperature (22 ±1 °C) with a HoloSpec VPT system (Kaiser Optical Systems, Ann Arbor, MI) configured for 785 nm Raman excitation (Kaiser Invictus-785 diode laser, Kaiser #2004371-510, HPGH 785.0 nm notch filter, DU401-BR-DD CCD camera, HoloSpec 5000 sample chamber). A 20 cm−1 shift in the absorbance of the C15=N stretching mode of the protonated Schiff base confirmed that most of the sample was deuterated. Smoothing and baseline correction algorithms were applied to all spectra using Grams 32 AI software (v. 6.00 Galactic Industries Corp.).
FTIR Difference Spectroscopy
A gentle stream of nitrogen gas was used to dry about 100 μg of protein into a thin film on a cool BaF2 window. A total suspension volume of 100 μL was dried in layers, 10 μL at a time. A second BaF2 window covered the film. The protein was held in a custom sample holder, connected to a water bath (Neslab ULT-80) set to about 18 °C. A total of 512 spectral scans were taken and averaged at 2 cm−1 resolution (Nicolet Magna-IR 750 bench, series II). To produce the P1DM state, a 150 W quartz halogen lamp, with a 650 nm band pass filter, irradiated the sample for about 24 hours before its spectrum was taken. The sample’s spectrum, prior to illumination, was subtracted from that of the P1DM state. Software developed in-house was used to normalize the spectra.
Time-resolved absorption spectroscopy
Time-resolved kinetic experiments were carried out on 13-dm purple membrane water suspensions in a 1 cm path length quartz fluorescence cuvette (0.6 OD at 560 nm, pH 7, 0.05 M phosphate buffer). Mineral oil covered the solution’s surface and parafilm covered the cuvette to prevent evaporation. Room temperature samples were exposed to 590 nm, 3.3 ns pulse-width emission from an optical parametric oscillator (OPO) pumped by the third harmonic of a Neodymium: YAG laser system (Coherent Infinity-XPO). A calibrated energy meter (Ophir PE50-BB interfaced with an Ophir Laserstar acquisition unit) measured the energy of each pulse (the mean energy density was 40 mJ/cm2). A rapid scanning monochrometer (RSM) system (OLIS Instruments, Inc. RSM-1000 stopped flow) collected spectra (360 to 590 nm) of these samples orthogonal to the incident beam. The RSM system monitored the difference spectrum, with 1000 scans averaged per second. A red light laser diode system (Intelite RS660-350, λ ≥ 650 nm) continuously illuminated the sample to create a photostationary state.
Low Temperature UV-vis Spectroscopy
A 13-dm-BR sample, suspended in 67% glycerol, 0.4 OD at 560 nm, was placed in an APD Cryogenics, Inc. helium-refrigerated cryostat connected to a Varian Cary 50 UV-vis spectrophotometer. The protein equilibrated at 60 ±5 K for one hour before being illuminated with filtered light from a 150 W quartz halogen lamp, until no spectral changes were observed. Band pass filters centered at 500 and 650 nm (Radzow Optical Instruments, Inc.) were used to generate the M- and P-like states, respectively. Software developed in-house was used to normalize the spectra.
Theoretical Studies
The BR crystal structure, 1C3W,43 was used as the template for all simulations. Hydrogen atoms were added using the Quantum CAChe program and the protonation states for specific residues were modified according to literature values.44 Neutralizing the following residues was assumed to have no significant effect on the calculated energies and generated a computational model with no overall charge: Asp-96, Asp-115, Glu-194, Lys-172, Arg-225, and Arg-227.45–47 Because pairing Glu-204(−) with Glu-194 was calculated to be lower in energy than pairing Glu-204 with Glu-194(−), Glu-204 was chosen to carry the negative charge.5 All other ionic residues were kept charged. The MM3 method was chosen to optimize hydrogen atom geometries about fixed heavy atoms. In MOZYME, a version of MOPAC that handles entire proteins, 5,48,49 the chromophore geometry was optimized by using a PM3 Hamiltonian. For 13-dm-BR computational models, the 13-methyl group of retinal was simply replaced with hydrogen. Configurations for the P1 states of 13-dm-BR and native BR were made by rotating around the C9–C10 bond in 5° increments with a fixed dihedral angle around that double bond; likewise, torsion around the C13–C14 bond was fixed for the K state model. At each step, the chromophore geometry was optimized using an MM2 force field, except around the locked dihedral angle. Once the model reached the 9-cis configuration, the angle was unlocked and the final geometry was optimized with MM2 and PM3 semi-empirical methods (MOZYME), separately. Additional details regarding our methods and procedures of carrying out MOZYME calculations on BR can be found in Ref. 5.
Continuous wave, thermal, and photokinetic studies
A schematic of the apparatus used in this study is shown in Figure 3. Fiber optics were used to combine the beams from an Argon Ion Laser (Coherent Innova 308C) and a 660 nm laser diode (Intellite #RS660-350). An Ophir 30(150)A-HE power meter, interfaced with an Ophir Laserstar acquisition unit, monitored the beam intensity, which averaged 200 mW/cm2 after fiber loss. An electronic shutter, controlled by a pulse generator, opened to illuminate the sample at 660 nm as data acquisition was initiated. The rapid-scanning monochrometer system (OLIS RSM-1000) measured the spectral changes between 360 and 590 nm at a rate of 1000 scans per second. A dichroic filter (CVI Laser, Inc. CP-SC-590-1.00) positioned in front of the RSM photomultiplier attenuated stray 660 nm radiation emitted from the diode laser. For WT in 85% glycerol, 1000 scans were averaged per data point at a rate of 1 scan/s; 50 scans were averaged per data point at a rate of 20 scans/s for 13-dm-BR.
Figure 3.
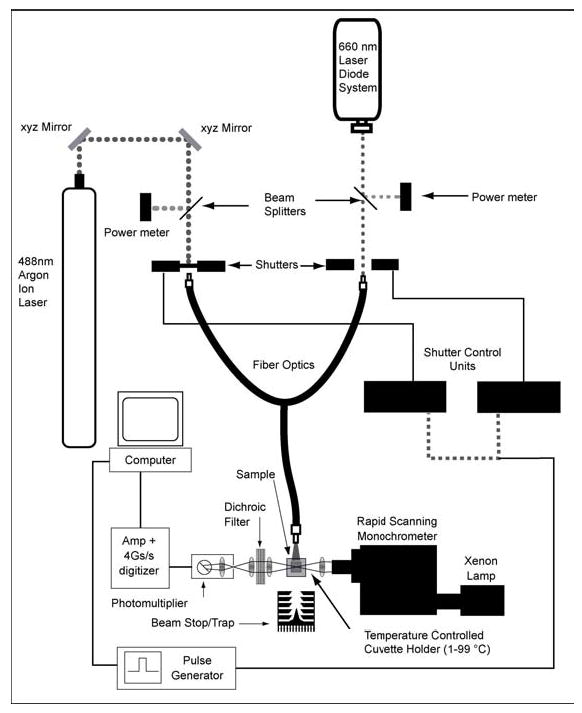
Schematic of the apparatus used to measure the rate of P state formation in the 25 to 40 °C temperature range. At each temperature, the P state was formed with the red laser diode at 660 nm (~200 mW/cm2 after fiber optic loss) and the bR state was recovered with the Argon Ion laser tuned to 488 nm (~100 mW/cm2) for P1DM in 13-dm-BR, and 454 nm (~200 mW/cm2) for P and Q in WT BR/glycerol.
The temperature was raised in 2.5 °C increments (7 data points) from 25 to 40 °C for 13-dm- BR and from 30 to 40 °C for WT BR. At each temperature, the sample was returned to the resting state by exposing it to blue/green light, controlled via a second shutter. The argon ion laser was set to emit at 488 nm for 13-dm-BR and 454 nm for WT BR. Beams from both lasers were split off separately with a piece of BK7 glass. Laser beam intensity did not vary by more than 3% during each trial.
3. Results and Discussion
3.1. Characteristics and Chromophore Structure of the P1DM State
UV-visible spectroscopy and photochemistry
Illumination of 13-dm-BR for 5 minutes with 660 nm light (~500 mW/cm2) produces a hypsochromic shift of ~30 nm (560 to 530 nm) in the λmax of the chromophore absorption band (Figure 4). Spectrum 2 in Figure 4 resulted after illuminating the sample for less than 1 minute; no change could be observed in the sample after three days in the dark (within experimental error, data not shown). Singular value deconvolution (SVD) analysis indicated that the 13-dm-BR blue shifted state absorbs maximally at 525 nm – the same λmax found for the P1 state of WT BR.34 Accordingly, it is referred to as the 13-dm-BR P1DM state. The P1DM state does not blue shift to form anything resembling the P2 or Q states found in WT BR, a result that supports the steric strain/hydrolysis hypothesis proposed in previous studies.14,50,51
Figure 4.
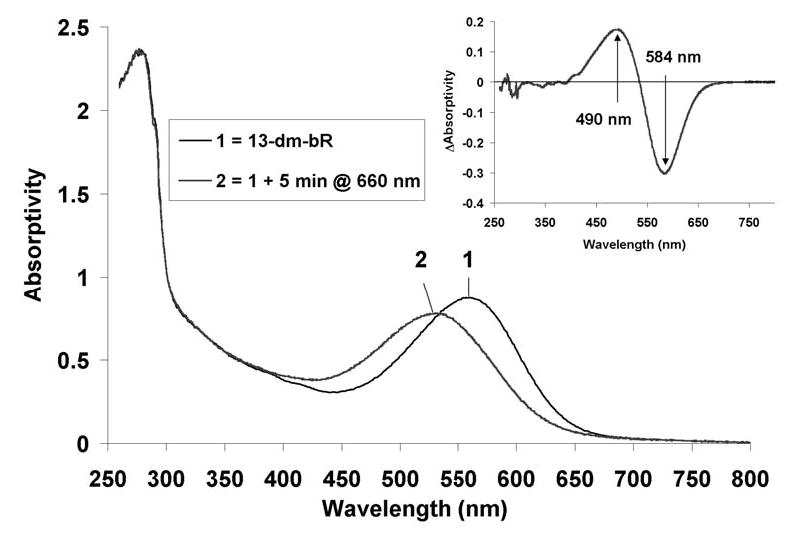
Absorption spectra of 13-dm-BR and its P1 state at room temperature. A sample of 13-dm-BR suspended in TAPS buffer at pH 8.7 (1) was illuminated for 5 min at a wavelength of 660 nm and an actinic density of 500 mW/cm2 (2) to form a thermally stable, photochemically reversible product (fully reversible with 488 nm light). SVD analysis revealed this product to absorb at the same maximum wavelength as the P1 state in WT BR (525 nm). The difference spectrum (2-1) is shown in the upper right inset.
Retinal Extraction and Analysis
The chromophore compositions of samples containing the P1DM and MDM states are shown in Table 1. Analogous to WT BR, the retinal is 13-cis in the MDM state and 9-cis in the P1DM state. Based on the absorption change at 570 nm, it was found that MDM accounts for ~75% of the sample at photostationary equilibrium with DDM and bRDM. No evidence was found of any M-like state formed from the DDM state.
TABLE 1.
Retinal extraction results of bRDADM, MDM, and P1DM. Some resting state remained in samples of the MDM and P1DM states.
| % Isomer
|
|||
|---|---|---|---|
| 13-dm-BR state | all-trans | 13-cis | 9-cis |
| bRDADM | 10 | 90 | 0 |
| MDM | < 3 | > 97 | 0 |
| P1DM | < 2 | 8 | 90 |
FT-Raman and FTIR Difference Spectroscopy
The vibrational spectra of the 13-dm-BR resting state and the P1DM state are shown in Figure 5. The peaks agree, within experimental error, with the reference values described herein. The strong peak at ~1144 cm−1 (Figure 5E) has been used previously as a marker for the 9-cis configuration of the retinal chromophore.52 In BR and its photointermediates, the NH in-plane rocking mode at 1345 cm−1 and the C14-C15 stretching mode at ~1170 cm−1 are used as fingerprinting bands for assigning the C15=N configuration as either syn or anti. If the frequency of the C14–C15 stretching mode shifts more than 30 cm−1 upon Schiff base deuteration, then the C15=N configuration is syn; if this frequency shift is less than 10 cm−1, then the C15=N configuration is anti.53,54 Both the N-H in-plane rock and the C14-C15 stretching modes disappear when the bRDM protonated Schiff base is deuterated, which indicates the chromophore is 13-cis, 15-syn. Deuterating the protonated Schiff base in the P1DM state results in only a small shift in the C14-C15 stretch mode, and suggests the retinylidene chromophore is in the 9-cis, 15-anti configuration. Because no other study on the C15=N conformation in 9-cis retinal-containing products exists, this assignment remains to be confirmed.
Figure 5.
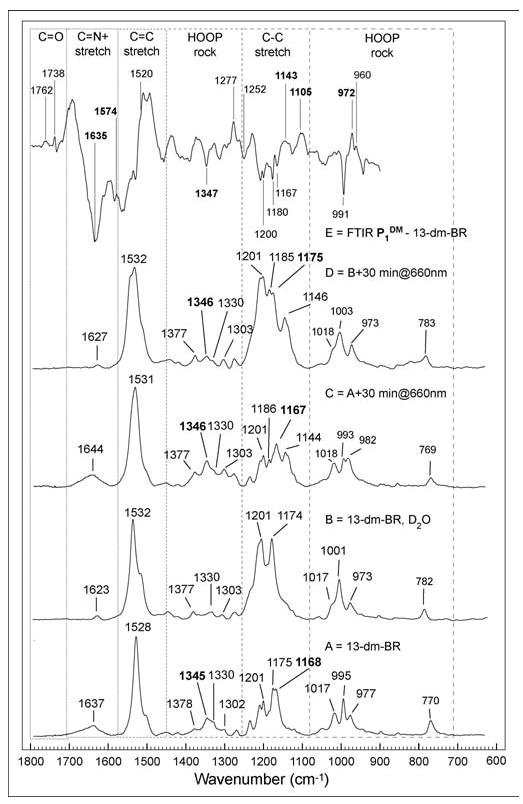
Raman and FTIR studies of 13-dm-BR and P1DM. The Raman spectra were taken with an excitation wavelength of 785 nm (~250 mW) at 22 ±1 °C. From bottom to top: A. Raman of 13-dm-BR resting state with H2O solution; B. 13-dm-BR resting state with D2O solution; C. 13-dm-BR P1DM state with H2O solution; D.13-dm-BR P1DM state with D2O solution; E. FTIR difference spectrum of 13-dm-BR. P1DM minus 13-dm-BR spectra measured in 1000-1800 cm–1 region at 18 °C.
3.2. The P1DM state in the photocycle of 13-dm-BR
Time-resolved absorption spectroscopy
Time resolved absorption difference spectra of 13-dm- BR in TAPS buffer (pH 8.5) were collected at different time intervals between zero and one second after the sample was irradiated at 590 nm (Figure 6). The time-resolved absorption changes of the sample (photokinetic traces), shown in Figure 7a–7d, are based on the difference spectra shown in Figure 6. Specific wavelengths were selected to monitor the P1DM (490 nm), MDM (420 nm), LDDM (610 nm), and ODM (670 nm) intermediates, respectively. To determine the approximate kinetic rise and decay, each curve was fitted to a single (a, b, and d) or double (c) exponential.
Figure 6.

Time-resolved difference spectra and absorption changes of 13-dm-BR at room temperature after an initial laser pulse (3.3 ns) at 590 nm.
Figure 7.
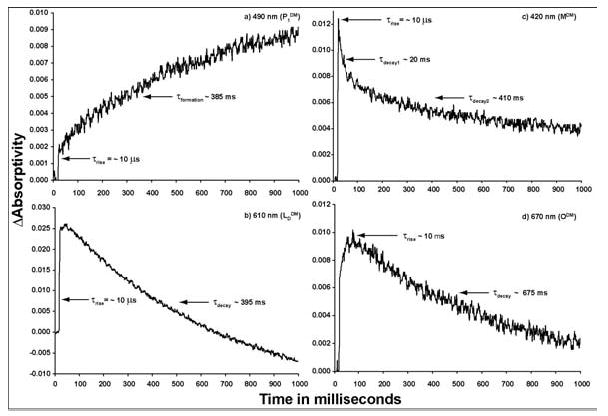
The time-resolved absorption changes of 13-dm-BR at a wavelength near peak spectral contrast for each of the following photocycle intermediates as they have been assigned here: (a) P1DM, 490 nm; (b) LDDM, 610 nm; (c) MDM, 410 nm; (d) ODM, 670 nm.
The photokinetic trace at 490 nm (Figure 7a) was assigned to the P1DM state, and shows both a fast (~10 μs) and a slow (~385 ms, exponential) rise with no decay. The P1DM state has previously never been isolated, presumably because the actinic wavelength used to create the state must be near the red (λ > 590 nm). Other studies14,33,55 have shown that only wavelengths of light greater than 590 nm produce a significant amount of P-like products in WT BR, due to both the spectral overlap of the P1 state with bR and the high P1 → bR photochemical yield.
The fast initial rise (~10 μs) and first decay (~20 ms) at 420 nm is consistent with the MDM state (Figure 7c) observed by previous groups. Previous studies have explained the baseline shift (i.e., the trace does not decay back to zero) at this wavelength as resulting from a second, slow (τ ~ minutes) M state;10–13 however, we believe the decay curve does not return to zero because the P1DM state spectrally overlaps with the MDM state at 420 nm. Most likely, the long decay in absorptivity at 420 nm results from a probe beam sufficiently intense to return the P1DM state to the resting state on the same time scale others have proposed for long-lived M-like photoproducts.10–13 About 20 minutes were needed for a low intensity (~5 μW/cm2) probe beam from the RSM system to return P1DM to the resting state, resulting in an exponential decay curve at 490 nm. After three days in the dark, thermal conversion to the resting state still had not occurred (data not shown).
The second decay constant in the double exponential fit of the 420 nm curve is too short (~410 ms) to be correlated with the photochemical regeneration of bRDM from the P1DM state. Because the chromophore extraction results indicate that any M-like state of 13-dm-BR contains only the 13-cis chromophore, we suggest this second component results from an additional thermal path from the MDM to the bRDM resting state. A photochemical path from the M state back to bR has been shown to exist in the native protein.7 If the energy barrier were significantly lower for this path in 13-dm-BR, then there could also be a thermal path. Further work is required to confirm this hypothesis.
The trace at 610 nm corresponds to a mixture of two states. The fast rise time (~10 μs) is characteristic of two spectrally unresolved states, KDDM and LDDM. A decay time of ~395 ms, at 610 nm, is similar to the decay time of ~675 ms at 670 nm, which is characteristic of the O state in native BR. From these results and those from the time resolved difference spectra, we conclude the 610 nm absorption change results from the KDDM and LDDM intermediates, with some ODM overlap. Furthermore, because the onset curve of the 670 nm trace is the near inverse of the decay curve of the 420 nm trace (figures 7d and 7c, respectively), the ODM state is thought to evolve from the MDM state, rather than the KDDM or LDDM states; this result is supported in the literature.11–13,37
Low Temperature UV-vis Spectroscopy
Low temperature spectroscopy was used to study the nature of, and possible relationships between, the kinetic species of 13-dm-BR. Previous studies on native BR show the maximum concentration of K to be 56%, achieved by low temperature illumination (4 to 110 K) at 500 to 510 nm.56 In this temperature range, illuminating K with 660 nm light transforms it back to bR.56
The difference spectra of 13-dm-BR at 500 to 510 nm illumination, is shown in Figure 8. When the sample is illuminated at 55 K, the MDM state forms almost simultaneously with the KDDM and LDDM states. All three states accumulate with continuous illumination. Small shifts in the isosbestic points at 457 nm and 567 nm probably result from residual light/dark adaptation (DDM ↔ bRDM) at this temperature.
Figure 8.
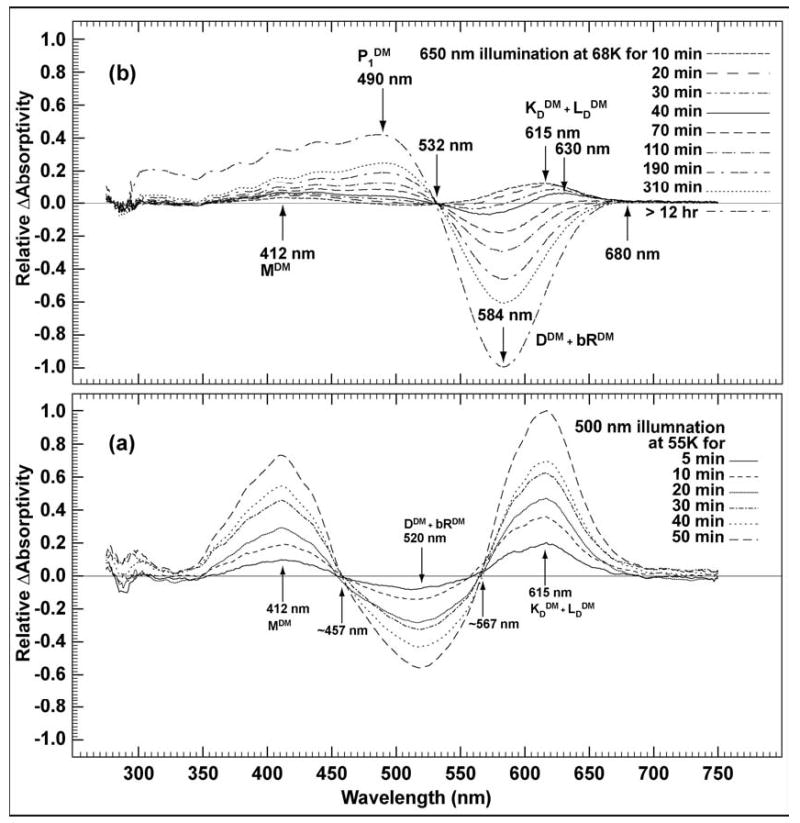
Low temperature study of 13-dm-BR. (a) Difference spectra of illumination with a tungsten lamp and 500 nm band pass filter at 55 K showing MDM and KDDM /LDDM (assigned here as a mixture because they are indistinguishable spectrally) with no P1DM. (b) Difference spectra of a sample illuminated with red light (λ > 650 nm) at 68 K, showing P1DM formation along with KDDM/LDDM and MDM formation.
As shown in Figure 8b, continuous illumination of 13-dm-BR with red light leads to a photostationary state mostly populated by P1DM, with small amounts of MDM and KDDM/LDDM intermediates. Thus, the P1DM state may accumulate by either illuminating 13-dm-BR with red light at room temperature (295 K, Figure 4) or at temperatures low enough to trap the K state in WT BR.
A semi-low temperature (~210 to 252 K, Figure 9) experiment was preformed to study the MDM and ODM states. At 210 K the sample was illuminated with 500 nm actinic light and absorption changes were monitored over the next five hours. The LDDM state was the major species accumulated during the first hour of illumination, with small amounts of MDM present. The photostationary state was reached after five hours and consisted of 60% MDM, with LDDM and bRDM composing the remaining 40%. At this point, illumination was stopped, the sample was heated gradually, and a spectrum was taken at every five to six degree temperature increase. At 252 K, with most of the MDM state converted to the resting state, a new species was observed in the difference spectrum 10 to 15 nm red-shifted from the LDDM state. Because it was red-shifted and formed after the MDM state – similar to the O state in native BR57 – this species was assigned to the ODM intermediate. With further heating, the absorption maximum shifted back to 560 nm as the sample returned to the resting state.
Figure 9.
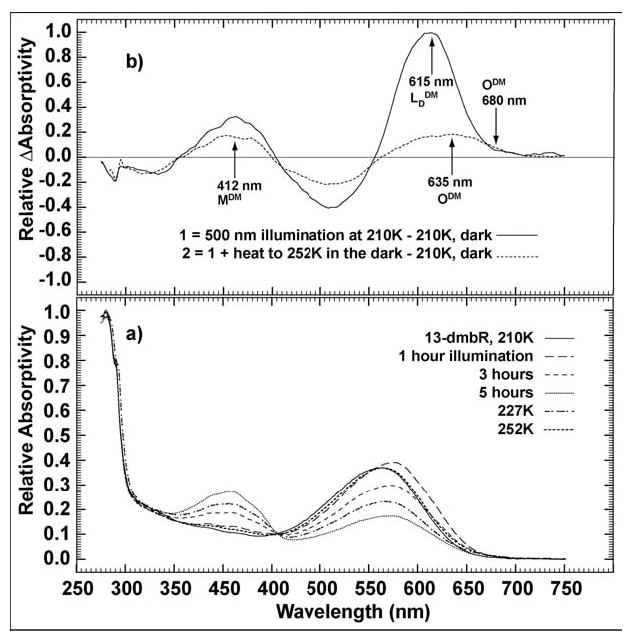
(a) Absolute spectra of accumulated MDM, LDDM, and ODM as the sample was illuminated at 210 K for 5 hours, and then slowly heated to 252 K in the dark. (b) Three selected difference spectra of (a) to show the relative absorption maxima of MDM (solid: 5 hr, 210 K), LDDM (dashed: illumination with λ = 500 nm, 1 hr, –210 K) and ODM (dot-dashed: [252 K postillumination] –[210 K pre-illumination]).
Two explanations for the preferential formation of the P1DM intermediate over the MDM intermediate seem likely, but remain to be proven. They are as follows:
In contrast to the analogous conditions in WT BR, the energy barrier to the formation of P1DM from bRDM is equal to, or lower than, that of the energy barrier to the formation of MDM.
P1DM can also form photochemically from the KDDM and LDDM intermediates.
That the ODM state does not form at temperatures below 210 K excludes it as a possible contributor to the formation of P1DM at these temperatures; however, because the ODM state is believed to contain the same anti configuration around the C15=N bond as P1DM, it must be considered as a thermal and/or photochemical precursor to the P1DM intermediate at temperatures above 210 K.
The proposed photocycle of 13-dm
Our proposed photocycle of 13-dm-BR is shown in Figure 10. Solid and wavy lines denote substantiated photochemical and thermal pathways, respectively. Dashed lines indicate photochemical and thermal routes for which evidence is tenuous. In contrast to other models proposed for 13-dm-BR,10–13 our proposed photocycle contains only one M-like state, the MDM state, with two potential reaction paths back to the bRDM state. Chromophore analysis, time resolved spectroscopy, and low temperature studies described herein validate this model.
Figure 10.

The proposed photocycle of 13-dm-BR. Wavy lines represent a thermal process whereas solid lines indicated a photochemical process. The dotted lines indicate potential photochemical or thermal paths for which the evidence is inconclusive.
Of particular interest, shown in Figure 10, is the thermal formation of the 9-cis retinal product, P1DM, from the LDDM photointermediate. The anti configuration around the C15=N bond, as established by FTIR and Raman studies and the minimal light/dark adaptation of 13-dm-BR, suggest that the thermal LDDM to P1DM reaction is probably a side reaction of an altered light adaptation process. Instead of producing only the bRDM state from LDDM, the P1DM state also forms, presumably because of a much lower energy barrier between the P1DM and bRDM states than those analogous states of WT BR.
3.3. Analysis of the all-trans → 9-cis isomerization energy barrier
Theoretical Studies
The photoisomerization of the bacteriorhodopsin retinal chromophore is one of the fastest photochemical reactions ever observed, producing a ground state photoproduct within 500 fs upon absorption of light.58 Because the isomerization happens so quickly, it is unlikely that the chromophore collides with surrounding residues. Indeed, no substantial movement of the residues has been observed in the crystal structure of the K state, which forms within picoseconds.59 The structural changes observed involve only the chromophore, all-trans to 13-cis, and the relocation of water-402.59 Accordingly, the coordinates for all protein residues were fixed in the simulation models. Furthermore, it was assumed that both the protein conformation and binding site structure were preserved during the following chromophore replacement procedure: BR→BR opsin→13-dm-BR.
Two assumptions were made in creating and optimizing the models studied. First, because residues 157 through 161 are far from both the binding site and the chromophore, it is thought these residues contribute little to the result and are not included in the starting structure. Second, the first two bound carbon atoms after the Schiff base on the lysine-216 residue were optimized with their hydrogen atoms connected as part of the chromophore.
Selected chromophore geometric parameters from our theoretical models, and those from crystal structures, 1C3W and 1M0K,43,59 are shown in Table 2. The calculated energy differences between the different simulation models from various computational methods are shown in Table 3.
TABLE 2.
Selected chromophore bond angles and dihedral angles of the crystal structure (1C3W and 1M0K) and the computational models. All angles in degree (°); Values for C13=C14, C14–C15, and C15=N+ are dihedral angles around these bonds.
| Bond Angle, Dihedral Angle
|
||||
|---|---|---|---|---|
| Model | C12-C13=C14 | C13=C14 | C14–C15 | C15=N+ |
| bR (1C3W) | 113° | −157° | 179° | −163° |
| bR (1M0K) | 112° | −154° | 177° | −172° |
| bR (this study) | 117° | −157° | 168° | −168° |
| K (1M0K) | 145 ± 12° | −2 ± 39° | 138 ± 35° | 101 ± 31° |
| K (this study) | 125° | −21° | 163° | 154° |
TABLE 3.
Relative energies of BR and 13-dm-BR geometrically optimized models computational models.
| ΔE (kcal/mol)(a) |
||
|---|---|---|
| Model Isomer/Protein | MM2 | PM3 |
| all-trans, 15-anti BR | 0 | 0 |
| 9-cis, 15-anti BR | 23 | 50 |
| 13-cis, 15-anti BR | 12 | 30 |
| 13-cis, 15-syn BR | 0.3 | 2 |
| all-trans,15-anti 13-dm-BR | 0 | 0 |
| 9-cis, 15-anti 13-dm-BR | 11 | 17 |
| 13-cis, 15-syn 13-dm-BR | −8 | −8 |
Relative energies calculated using Cache 4.9.2 and based on either molecular mechanics (MM2) or MOZYME molecular orbital (PM3) methods. Energies are reported relative to ΔHf of all-trans, 15-anti BR or all-trans,15-anti 13-dm-BR.
A MOZYME calculation using a PM3 Hamiltonian applied to the native BR structure indicates that the 13-cis, 15-syn configuration is slightly less favorable than the all-trans configuration by 2 kcal/mol. However, this same configuration in 13-dm-BR is more favored than the all-trans geometry by 8 kcal/mol. Because the light to dark adaptation process would be faster given a larger energy difference, this result explains why there is little light to dark adaptation in 13-dm-BR when compared with native BR. Furthermore, as shown by the chromophore extraction experiment, the dark thermodynamic equilibrium more greatly favors the DDM state (90%) in 13-dm-BR than the D state (47%) in WT BR.
Our modeling and experimental results indicate the 13-dm chromophore has more rotational freedom inside the binding site compared with that in WT, particularly around the C9=C10 bond. Furthermore, the energy difference between the 9-cis and all-trans configurations is 33 kcal/mol more stable in the 13-dm-BR model than in the all-trans model. Bulky residues in the binding site of WT bR hinder movement of the 13-methyl group, which prohibits rotation around the C9–C10 bond. Thermally-driven isomerization in the wild-type protein is strongly inhibited by barriers of 30 kcal/mol (all-trans to 13-cis) and 50 kcal/mol (all-trans to 9-cis); in addition, no direct formation of a 9-cis from a 13-cis chromophore is possible (photochemically or thermally)—such a transition must occur via a trans intermediate. These observations support the steric-strain hypothesis proposed for P state inhibition and Q state formation, for WT BR.14,50
That the O state of native BR – with appropriate chemical modification33,34,36 – will likely become P1 on absorbing a red photon is also supported by theoretical calculations. When forming the O state, protonated residues in the binding site rearrange causing hydrogen bonds to weaken, thereby reducing the barrier to rotation around the C9=C10 bond. The all-trans chromophore in the O state will have a significant probability of isomerizing to a 9-cis conformation when electronically excited if this energy barrier is below 44 kcal/mol, the energy of a 650 nm photon (within the O-state absorption band). This hypothesis could be verified with the future availability of a refined O state structure.
3.4. Continuous wave, thermal and photokinetic studies
Description of the kinetic model and data analysis
A sketch of the kinetic model is shown in Figure 11a. Under continuous illumination, wild-type bR will rapidly achieve equilibration, whereby the ground state photocycle intermediates will reach a steady state concentration based on their respective kinetic profiles. Because P1 and P2 interconvert quickly, this step is not considered rate determining in WT BR.34 At equilibrium, the rate determining step is P1 formation because previous studies have shown it to be temperature dependant.14,50 Under these conditions, the net rate of BR conversion should be linear and directly proportional to the linear rate of P1 formation.
Figure 11.
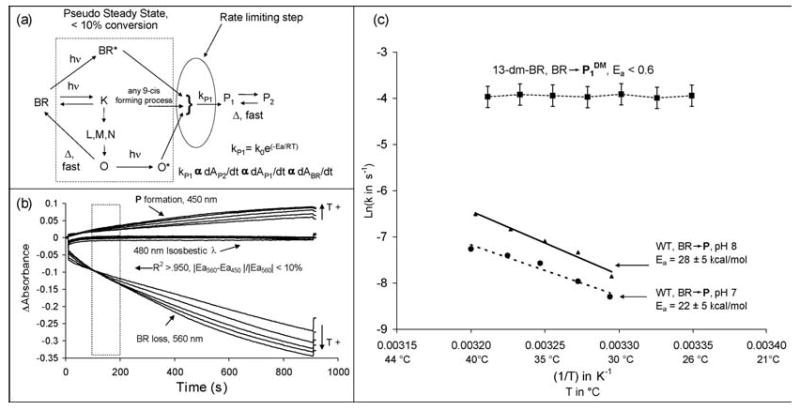
(a) A diagram to illustrate the “black box” kinetic model applied to the two BR variants studied to measure the relative height of the AT→9-cis retinal isomerization barrier. The variables indicated in the figure are as follows: A is absorbance; hν indicates a photochemical reaction; D, a thermal reaction; kP1 is the overall rate constant of P1 formation; R is the gas constant, k0 is the Arrhenius kinetic constant, and Ea is the Arrhenius activation energy. The scheme illustrated applies to WT BR in glycerol, in the case of 13-dm-BR, only the P1 state was assumed to form. (b) A sample set of photokinetic traces before being normalized to the initial loss of BR. The region analyzed (110-210 s) was chosen because it met the primary criteria of linearity and Ea value agreement. P1DM state formation was immediate in 13-dm-BR. “T+” indicates the direction of increasing temperature for each trace set. (c) Arrhenius plots of P formation in WT in 85%/15% by volume glycerol/buffer at pH 7 and pH 8, and an aqueous suspension of 13-dm-BR (pH 8.5). The data above are plotted for the absolute rate of the loss of absorbance of bR at 560 nm. The Ea values for the wavelengths corresponding to P state were within 10% of these values (the error values are for a 95% confidence interval in the linear regression).
An Arrhenius plot (Figure 11) was made to determine the activation energy for the bR →P process in both WT and 13-dm-BR. Rate and temperature data were accumulated for 13-desmethyl-BR from 25 to 40 °C and for WT in 85% glycerol at pH 7 and 8, from 30 to 40 °C. Two tests were used to validate the kinetic model. The first test is for linearity (R2 > 0.95) in the initial rate of P1 formation. The second test is for agreement between the activation energies (Ea) derived from absorbance loss of bR at 560 nm and absorbance increase from the P state at 450 nm (490 nm for 13-dm-BR). Sample traces for WT BR at pH 7 are shown in Figure 11b. As the traces show, the conditions of the kinetic model were met.
In order to produce the most accurate and linear Arrhenius plot at each temperature, the rates derived must have the same number of molecules be activated and the fast-forming species in the photocycle must be equilibrated. Previous studies have shown that the absorption maximum of bR blue shifts with increasing temperature, which leads to a reduction in absorbance at higher wavelengths.34,60,61 Accordingly, at 660 nm excitation the total population of absorbing molecules decreases with increasing temperature. Furthermore, because of shorter lifetimes at elevated temperatures, a smaller number of photoproducts exist in the photostationary state. Based on these observations, the rates derived for the Arrhenius plots are calculated assuming the system adheres to the conditions required by the kinetic model. The slope calculated from the linear regression of each kinetic trace is normalized to the magnitude of initial bR loss at the lowest temperature in each data set. Because no temperature dependence was observed in the formation of the P1DM state, no modifications were necessary. The highlighted areas in Figure 11b correspond to points in the photokinetic traces that are the most linear based on regression analysis, and give the best agreement in activation energies for the formation of P1.
Arrhenius activation energies
Although the lack of any temperature dependence for the formation of P1DM in 13-dm-BR supports the steric-strain theory, it also supports the premise that Ea values give useful information about the relative barrier height for all-trans →9-cis isomerization. If the 9-cis isomerization process can be assumed to have the most significant energy barrier in the overall reaction, as the results for 13-dm-BR indicate, then it must be the primary constituent of Ea. Thus, these results suggest Ea may be a useful quantity in comparing energy barriers to any retinal protein isomerization reaction that shows temperature dependence.
As shown in earlier work, the P and Q states do not form in WT BR suspensions unless there is considerable chemical modification.34 This observation is consistent with the theoretical energy barrier for 9-cis chromophore products of 50 kcal/mol greater than the all-trans chromophore, an energy barrier that is significantly greater than the available energy of incident photons at the wavelengths required to form them in appreciable quantities (~48 kcal/mol 590 nm, ~41 kcal/mol for 700 nm). The Ea for this transition in WT BR prepared in high proportions of glycerol, is at least 20 kcal/mol below this value and a good indicator that glycerol modifies the binding site structure enough to lower the barrier in the excited state to allow some all-trans →9-cis isomerization to occur. A large thermal dependence found in previous studies for P and Q formation in acrylamide gels of WT BR further supports this argument.34,36 Finally, the lack of any barrier in 13-dm-BR confirms the theoretical prediction that the 13-methyl group is the primary impediment to 9-cis isomerization.
4. Comments and Conclusions
The results of this work strongly support the steric-strain14,33,50,51 and the two-component models14,34 previously proposed for the formation of 9-cis retinal containing products of WT BR and blue membrane. This study also demonstrates the importance of the 13-methyl group and its interactions with nearby binding site residues in channeling the main photocycle of the native protein to be rigorously constrained to all-trans and 13-cis interconversions. A new photocycle model is also proposed here (Figure 10), which argues for one M state (MDM) and P1DM state, in contrast to models reported by others.10–13 The formation of the P1DM state is also indicated to occur thermally from the LDDM state, which is likely the result of an altered dark → light adaptation process. As the steric strain hypothesis predicted, the all-trans →9-cis chromophore isomerization energy barrier was greatly reduced in 13-dm-BR, and is confirmed here both theoretically and experimentally.
Because of their low spectral separation (~30 nm) and similar intensities, the 13-dm-BR resting and P1DM states may not be practical for holographic devices. The knowledge gleaned from their analysis, however, should prove useful in making BR devices based on 9-cis retinal-containing products. The ability to manipulate the bR → P energy barrier through modification of environment, chromophore, and BR sequence will allow for the generation of BR variants with a higher photochemical yield, and greater spectral separation if they form the P2 or Q states. By knowing that interactions between the C13 methyl group and nearby residues sterically prohibit 9-cis photochemistry, mutations can be explored which mediate and enhance the efficiency of the O → P1 photoreaction, while still enabling Q-state formation. In essence, it should be possible to adjust the activation energy of the O → P1 transition through genetic modification. Research along these lines is ongoing, with the hope of achieving improved BR-based holographic materials.
Acknowledgments
This work was supported in part by grants to RRB from the National Institutes of Health (GM-34548) and the National Science Foundation (EIA-0129731). Heather Daniel and Deborah Dews were supported in part by NSF REU grant CHE-0097525.
References
- 1.Béjà O, Spudich E, Spudich J, Leclerc M, DeLong E. Nature. 2001;411:786. doi: 10.1038/35081051. [DOI] [PubMed] [Google Scholar]
- 2.Stuart, J. A.; Birge, R. R. Characterization of the primary photochemical events in bacteriorhodopsin and rhodopsin. In Biomembranes; Lee, A. G., Ed.; JAI Press: London, 1996; Vol. 2A; pp 33.
- 3.Ebrey T, Koutalos Y. Progress in Retinal and Eye Research. 2001;20:49. doi: 10.1016/s1350-9462(00)00014-8. [DOI] [PubMed] [Google Scholar]
- 4.Lanyi JK. Annu. Rev. Physiol. 2004;66:665. doi: 10.1146/annurev.physiol.66.032102.150049. [DOI] [PubMed] [Google Scholar]
- 5.Ren L, Martin CH, Wise KJ, Gillespie NB, Luecke H, Lanyi JK, Spudich JL, Birge RR. Biochemistry. 2001;40:13906. doi: 10.1021/bi0116487. [DOI] [PubMed] [Google Scholar]
- 6.Kusnetzow AK, Dukkipati A, Babu KR, Ramos L, Knox BE, Birge RR. Proc Natl Acad Sci U S A. 2004;101:941. doi: 10.1073/pnas.0305206101. [DOI] [PMC free article] [PubMed] [Google Scholar]
- 7.Balashov SP. Isr. Jour. Chem. 1995;35:415. [Google Scholar]
- 8.Seltzer S. Journal of the American Chemical Society. 1994;116:9383. [Google Scholar]
- 9.Hiraki K, Hamanaka T, Zheng XG, Shinada T, Kim JM, Yoshihara K, Kito Y. Biophysical Journal. 2002;83:3460. doi: 10.1016/S0006-3495(02)75345-9. [DOI] [PMC free article] [PubMed] [Google Scholar]
- 10.Steinberg G, Sheves M, Bressler S, Ottolenghi M. Biochemistry. 1994;33:12439. doi: 10.1021/bi00207a010. [DOI] [PubMed] [Google Scholar]
- 11.Gärtner W, Towner P, Hopf H, Oesterhelt D. Biochemistry. 1983;22:2637. [Google Scholar]
- 12.Noguchi T, Kolaczkowski S, Gaertner W, Atkinson GH. J. Phys. Chem. 1990;94:4920. [Google Scholar]
- 13.Brack TL, Gaertner W, Atkinson GH. Chem. Phys. Lett. 1992;190:298. [Google Scholar]
- 14.Tallent JR, Stuart JA, Song QW, Schmidt EJ, Martin CH, Birge RR. Biophys. J. 1998;75:1619. doi: 10.1016/S0006-3495(98)77605-2. [DOI] [PMC free article] [PubMed] [Google Scholar]
- 15.Tokunga F, Ebrey T. Biochem. 1978;17:1915. doi: 10.1021/bi00603a018. [DOI] [PubMed] [Google Scholar]
- 16.Ahl P, Stern L, Mogi T, Khorana H, Rothschild K. Biochem. 1989;28:10028. doi: 10.1021/bi00452a022. [DOI] [PubMed] [Google Scholar]
- 17.Balogh-Nair, V. Synthetic analogs to probe molecular events in visual transduction and proton pumping by bacteriorhodopsin. In Biophysical studies of retinal proteins; Ebrey, T. G., Frauenfelder, H., Honig, B., Nakanishi, K., Eds.; University of Illinois Press, 1987; pp 52.
- 18.Beischel CJ, Mani V, Govindjee R, Ebrey TG, Knapp DR, Crouch RK. Photochem. Photobiol. 1991;54:977. doi: 10.1111/j.1751-1097.1991.tb02119.x. [DOI] [PubMed] [Google Scholar]
- 19.Braiman MS, Klinger AL, Doebler R. Biophys. J. 1992;62:56. doi: 10.1016/S0006-3495(92)81777-0. [DOI] [PMC free article] [PubMed] [Google Scholar]
- 20.Crouch R, Scott R, Ghent S, Govindjee R, Chang C, Ebrey T. Photochemistry and Photobiology. 1986;43:297. doi: 10.1111/j.1751-1097.1986.tb05608.x. [DOI] [PubMed] [Google Scholar]
- 21.Downie JD, Smithey DT. Optics Letters. 1996;21:680. doi: 10.1364/ol.21.000680. [DOI] [PubMed] [Google Scholar]
- 22.Duñach M, Marti T, Khorana H, Rothschild K. Proc. Natl. Acad. Sci USA. 1990;87:9873. doi: 10.1073/pnas.87.24.9873. [DOI] [PMC free article] [PubMed] [Google Scholar]
- 23.Drachev L, Kaulen A, Khorana H, Mogi T, Postanogova N, Skulachev V, Stern L. Biokhimiya. 1992;57:749. [Google Scholar]
- 24.He Y, Krebs MP, Fischer WB, Khorana HG, Rothschild KJ. Biochemistry. 1993;32:2282. doi: 10.1021/bi00060a021. [DOI] [PubMed] [Google Scholar]
- 25.Heyne K, Herbst J, Domingez-Herradon B, Alexiev U, Diller R. J. Phys. Chem B. 2000;10:6053. [Google Scholar]
- 26.Toth-Boconadi R, Keszthelyi L, Stoeckenius W. Biophysical Journal. 2003;84:3848. doi: 10.1016/S0006-3495(03)75112-1. [DOI] [PMC free article] [PubMed] [Google Scholar]
- 27.Rouhani S, Cartailler J, Facciotti M, Walian P, Needleman R, Lanyi J, Glaeser R, Luecke H. J. Mol. Biol. 2001;313:615. doi: 10.1006/jmbi.2001.5066. [DOI] [PubMed] [Google Scholar]
- 28.Weidlich O, Friedman N, Sheves M, Siebert F. Biochemistry. 1995;34:13502. doi: 10.1021/bi00041a030. [DOI] [PubMed] [Google Scholar]
- 29.Weidlich O, Schalt B, Friedman N, Sheves M, Lanyi JK, Brown LS, Siebert F. Biochem. 1996;35:10807. doi: 10.1021/bi960780h. [DOI] [PubMed] [Google Scholar]
- 30.Weidlich O, Ujj L, Jager F, Atkinson GH. Biophys. J. 1997;72:2329. doi: 10.1016/S0006-3495(97)78877-5. [DOI] [PMC free article] [PubMed] [Google Scholar]
- 31.Harbison GS, Smith SO, Pardoen JA, Winkel J, Lugtenburg J, Herzfeld J, Mathies RA, Griffin RG. Proc. Natl. Acad. Sci USA. 1984;81:1706. doi: 10.1073/pnas.81.6.1706. [DOI] [PMC free article] [PubMed] [Google Scholar]
- 32.Scherrer, P.; Mathew, M. K.; Sperling, W.; Stoeckenius, W. Isomer ratio in dark-adapted bacteriorhodopsin. In Biophysical studies of retinal proteins; Ebrey, T. G., Frauenfelder, H., Honig, B., Nakanishi, K., Eds.; University of Illinois Press, 1987; pp 206.
- 33.Popp A, Wolperdinger M, Hampp N, Bräuchle C, Oesterhelt D. Biophys. J. 1993;65:1449. doi: 10.1016/S0006-3495(93)81214-1. [DOI] [PMC free article] [PubMed] [Google Scholar]
- 34.Gillespie NB, Wise KJ, Ren L, Stuart JA, Marcy DL, Hillebrecht J, Li Q, Ramos L, Jordan K, Fyvie S, Birge RR. Journal of Physical Chemistry B. 2002;106:13352. [Google Scholar]
- 35.Birge RR, Gillespie NB, Izaguirre EW, Kusnetzow A, Lawrence AF, Singh D, Song QW, Schmidt E, Stuart JA, Seetharaman S, Wise KJ. J. Phys. Chem. B. 1999;103:10746. [Google Scholar]
- 36.Dancshazy Z, Tokaji Z, Der A. FEBS Lett. 1999;450:154. doi: 10.1016/s0014-5793(99)00487-1. [DOI] [PubMed] [Google Scholar]
- 37.Gärtner W, Oesterhelt D, Vogel J, Maurer R, Schneider S. Biochemistry. 1988;27:3497. [Google Scholar]
- 38.Zinth, W. D., J.; Franz, M. A.; Kaiser, W. The primary steps of photosynthesis in Bacteriorhodopsin. In In "Spectroscopy of Biological Molecules-New Advances" Schmid, E.D., Schneider, F.W., Siebert, F., Eds.; Wiley: New York,, 1988; pp 269.
- 39.Scherrer P, Mathew MK, Sperling W, Stoeckenius W. Biochemistry. 1989;28:829. doi: 10.1021/bi00428a063. [DOI] [PubMed] [Google Scholar]
- 40.van den Tempel PJ, Huisman HO. Tetrahedron. 1966;22:293. doi: 10.1016/0040-4020(66)80130-8. [DOI] [PubMed] [Google Scholar]
- 41.Becher BM, Cassim JY. Prep. Biochem. 1975;5:161. doi: 10.1080/00327487508061568. [DOI] [PubMed] [Google Scholar]
- 42.Oesterhelt D, Stoeckenius W. Methods Enzymol. 1974;31:667. doi: 10.1016/0076-6879(74)31072-5. [DOI] [PubMed] [Google Scholar]
- 43.Luecke H, Schobert B, Richter HT, Cartailler JP, Lanyi JK. J. Mol. Biol. 1999;291:899. doi: 10.1006/jmbi.1999.3027. [DOI] [PubMed] [Google Scholar]
- 44.Group, C. CAChe(r); Version 5.0 ed.; Fujitsu: Beaverton, Oregon, USA, 2001.
- 45.Sasaki J, Lanyi J, Needleman R, Yoshizawa T, Maeda A. Biochemistry. 1994;33:3178. doi: 10.1021/bi00177a006. [DOI] [PubMed] [Google Scholar]
- 46.Brown LS, Varo G, Hatanaka M, Sasaki J, Kandori H, Maeda A, Friedman N, Sheves M, Needleman R, Lanyi JK. Biochemistry. 1995;34:12903. doi: 10.1021/bi00039a053. [DOI] [PubMed] [Google Scholar]
- 47.Brown LS, Sasaki J, Kandori H, Maeda A, Needleman R, Lanyi JK. J. Biol. Chem. 1995;270:27122. doi: 10.1074/jbc.270.45.27122. [DOI] [PubMed] [Google Scholar]
- 48.Stewart JJP. J. Mol. Struc (Theochem) 1997;1997:195. [Google Scholar]
- 49.Stewart JJP. Int. J. Quant. Chem. 1996;58:133. [Google Scholar]
- 50.Birge, R. R.; Parsons, B.; Song, Q. W.; Tallent, J. R. Protein-based three-dimensional memories and associative processors. In Molecular Electronics; Ratner, M. A., Jortner, J., Eds.; Blackweel Science Ltd.: Oxford, 1997; pp 439.
- 51.Birge RR, Govender DSK, Gross RB, Lawrence AF, Stuart JA, Tallent JR, Tan E, Vought BW. IEEE IEDM Technical Digest. 1994;94:3. [Google Scholar]
- 52.Rüdiger M, Tittor J, Gerwert K, Oesterhelt D. Biochemistry. 1997;36:4867. doi: 10.1021/bi962426p. [DOI] [PubMed] [Google Scholar]
- 53.Smith SO, Braiman MS, Myers AB, Pardoen JA, Courtin JML, et al. J. Am. Chem. Soc. 1987;109:3108. [Google Scholar]
- 54.Smith SO, Pardoen JA, Lugtenburg J, Mathies RA. J. Phys. Chem. 1987;91:804. [Google Scholar]
- 55.Dancshazy Z, Tokaji Z. FEBS Lett. 2000;476:171. doi: 10.1016/s0014-5793(00)01714-2. [DOI] [PubMed] [Google Scholar]
- 56.Balashov SP, Ebrey TG. Photochemistry and Photobiology. 2001;73:453. doi: 10.1562/0031-8655(2001)073<0453:tasiot>2.0.co;2. [DOI] [PubMed] [Google Scholar]
- 57.Lanyi J, Luecke H. Current Opinion in Structural Biology. 2001;11:415. doi: 10.1016/s0959-440x(00)00226-8. [DOI] [PubMed] [Google Scholar]
- 58.Yoshizawa, T. K., O. In CRC Handbook of Organic Photochemistry and Photobiology;, 1995; Vol. In Horspool, W. M., Song, P.-S., Eds. CRC press:1995; pp 1493.
- 59.Lanyi JK, Schobert B. J. Mol. Biol. 2002;321:727. doi: 10.1016/s0022-2836(02)00682-4. [DOI] [PubMed] [Google Scholar]
- 60.Kresheck GC, Lin CT, Williamson LN, Mason WR, Jang DJ, El-Sayed MA. J. Photochem. Photobiol, B. 1990;7:289. [Google Scholar]
- 61.Muller J, Munster C, Salditt T. Biophys J. 2000;78:3208. doi: 10.1016/S0006-3495(00)76857-3. [DOI] [PMC free article] [PubMed] [Google Scholar]