

Abstract
We describe here diffusion and imaging properties of three new lipophilic tracers, NeuroVue ™ Maroon (near infrared), NeuroVue ™ Red and NeuroVue ™ Green. Using pair wise comparisons between the new dyes and existing dyes (DiI, DiA, DiD, DiO, PKH2, PKH26) applied to the left and the right side of fixed spinal cord preparations, we show that NeuroVue Maroon (excitation max 647 nm) surpasses all other dyes in this study in signal to noise ratio. We also present data showing the utility of these new dyes for both double labeling and triple labeling in combination with each other or existing lipophilic tracers. Using mice bearing the PLP-eGFP transgene, we demonstrate that either NeuroVue Maroon or NeuroVue Red can readily be combined with eGFP labeling. Double labeling experiments using NeuroVue Red and eGFP allowed us to demonstrate that every fiber in the neonatal ear is surrounded by developing Schwann cells.
Keywords: lipophilic tracers, diffusion rates, imaging, confocal microscopy
1. Introduction
The lipophilic indocarbocyanine dye DiI has revolutionized single color fiber tracing in fixed nervous system since its introduction in 1987 [16,18] resulting in over 1500 citations in the last 17 years. Several blue-excited lipophilic dyes exist (DiA, DiO; [12,13,27]; www.probes.com) that allow double labeling, albeit with variable degrees of difficulty and/or success. Some researchers reported that these dyes allowed them to image partial segregation of two labeled neuronal profiles [18], while others reported several problems that were incompletely resolved or not resolvable using DiI in combination with DiA or DiO. Some of the problems arise from the inability to segregate DiA completely from DiI in conventional epifluorescence microscopy: DiA’s substantial Stokes shift causes significant overlap of its emission with that of DiI (see Table I). For reasons that remain poorly defined, DiO diffuses very slowly in fixed tissue, making it impractical for use as a long range tracer. DiA, although somewhat better than DiO, has limited usefulness as a long range tracer. Complete filling of profiles more than 5 mm away is achieved only after excessively long diffusion times and the use of elevated temperatures (>36° C.) increases diffusion speed but can result in other problems such as transcellular diffusion [3,6]. In addition, two color studies with DiA and DiI are complicated by the fact that different diffusion times are required to label neuronal profiles completely [22,23]. As a consequence, detailed knowledge of diffusion distances per 24 hours in embryos of varying size/maturation stage is required for successful two color studies using the DiA/DiI dye combination.
Table I.
Spectral Properties of Lipophilic Tracer Dyes
| Dye | Excitation maximum in nm | Emission maximum in nm | Best matched confocal laser line(s) in nm |
|---|---|---|---|
| DiA | 456 | 590 | 488 |
| DiO | 484 | 501 | 488 |
| PKH2 | 490 | 504 | 488 |
| NeuroVue Green | 490 | 504 | 488 |
| DiI | 549 | 565 | 568 |
| PKH 26 | 551 | 567 | 568 |
| NeuroVue Red | 565 | 586 | 568 |
| DiD | 644 | 665 | 637/647 |
| NeuroVue Maroon | 647 | 667 | 637/647 |
Previous studies suggested that some of these problems could be overcome by using PKH2 (Zynaxis/Phanos) instead of DiA or DiO when using conventional epifluorescence microscopy [1,28,29]. However, this dye is not commercially available in crystalline form and its use still does not overcome the basic problem common to all green emitting dyes that autofluorescence of neuronal tissue is particularly strong in the 450–490 nm excitation wavelength band. A better solution is provided by the recent availability of single photon confocal microscopy, which allows use of near infrared excitation using either the 648 nm band of the Krypton/Argon laser or the 637 nm band of the Red diode laser. Use of dyes that excite in this region results in a better signal to noise ratio than is possible with dyes that excite in the 450–500 nm range, since tissue autofluorescence is much lower in the near infrared region of the spectrum. Indeed, previous work has identified a near infrared dye (DiD) with diffusion and imaging properties comparable to those of DiI [1]. In this study, Agmon et al [1] successfully traced cortical fibers to their origin in nearby thalamic nuclei. Somewhat surprisingly, DiD has been relatively little used for double labeling (only 32 citations in the 9 years since Agmon’s publication). In part this may be related to the poor visibility of this dye to the naked eye, and the consequent requirement for either single photon lasers or infrared sensitive cameras to detect its fluorescence.
While single photon confocal microscopy expands the range of usable wavelength into the near infrared spectrum, it also limits the available excitation bands to the emission bands of the strongest, most commonly used laser, the 488, 568 and 647 nm emission bands of the Kr/Ar laser as well as the recently available infrared (637 nm) and blue (405 nm) diode. Indeed, the Alexa probes (conjugated to antibodies or to dextrans; Molecular Probes) have been tailored to fit those available emission bands with their excitation maxima. Conjugated with 3,000 or 10,000 MW dextrans, these dyes allow for two or three color labeling of neuronal profiles in live neurons [6,8,14,25]. The dextrans are also excellent for tracing of normal or of regenerating adult neuronal connections [7] as well as very small developing non-mammalian embryos [9,11,15,26]. However, the otherwise excellent capacity for neuronal tracing [26] is somewhat compromised by the limited viability of embryos outside the womb and the need for a diffusion time of at least 1 or more hours [9]. The time required to genotype some mutants also imposes some limitations on the use of dextrans for studies of neuronal connections in the many knock-out, knock-in and transgenic mouse mutants generated by the developmental biology revolution of the 1990’s.
These new models have the potential to unsurpassed insights into how the developing mammalian brain is assembled. Moreover, with the completion of the mouse genome project, chances for transferability of mouse data to humans offers a unique, indirect insight into human neuronal development. In the present study we provide details for the use of three new carbocyanine dyes that resolve some of the above problems. Their excitation maxima closely match the wavelengths available on the most commonly used confocal microscopes systems (Kr/Ar laser, infrared diode lasers), enabling efficient excitation with standard laser lines. We describe the use of these dyes in a format that allows simple and completely segregated double and, under certain circumstances, triple labeling using near-simultaneous applications in embryos and juveniles. We also demonstrate their usefulness to resolve connectional problems in developmental neurobiology that are difficult to address by other techniques.
2. Materials and Methods
2.1. Dyes used for this study
DiI C18, DiA C18, DiO C18, DiD C18 and (Ph)2-DiI were purchased from Molecular Probes (Eugene, OR). Crystalline NeuroVue Maroon, NeuroVue Red and NeuroVue Green as well as filters coated with NeuroVue Red were provided by PTI Research (Exton, PA). Crystalline PKH26 and PKH2 were the kind gift of Phanos Technologies (Los Angeles, CA).
These dyes can be grouped into 488 nm excitable dyes (DiA, DiO, NeuroVue Green, PKH2), 568 nm excitable dyes (DiI, PKH26, NeuroVue Red) and 637/647 nm excitable dyes (DiD, NeuroVue Maroon). Excitation and emission maxima for the lipophilic tracers used in these studies are summarized in Table 1. The closer the excitation maximum of a given dye is to an available laser line, the more efficiently it will be excited and, assuming all other factors equal, the greater signal will be obtained at a given distance from the site of application. Note that DiA poses two problems for sensitive detection in a multicolor system: 1) its excitation is less well matched than those of the other green dyes to the 488 nm Kr/Ar line and 2) its large Stokes shift creates difficulties for segregated imaging when used with 568 nm excited dyes. Similar issues must also be taken into consideration when filter cubes are designed for the use with these dyes in conjunction with conventional light microscopy.
2.2 Preparation of dye-filled capillaries and dye-coated nylon filters
To allow determination of detection sensitivity and comparison of dye brightness in our confocal system, independent of tissue and diffusion factors, 1 mM stock solutions of each of the dyes were prepared in DMF from solid dye. The stock solutions were further diluted with DMF to provide solutions at concentrations of 100, 10, 1, 0.1, 0.01 and 0.001 uM. For each concentration of dye, three capillary tubes (one end closed) were filled with dye solution and the open end was then heat sealed. The dye-filled capillaries were imaged under conditions identical to those used for tissue imaging (see below). Direct comparisons of capillaries containing different dyes at equimolar concentrations showed that the apparent fluorescent intensity varied particularly between DiI, (Ph)2-DiI and NeuroVue Red at the excitation of 568 nm (Fig. 1).
Fig. 1. Confocal images of capillaries filled with equimolar concentrations of the NeuroVue dyes and other lipophilic tracers.
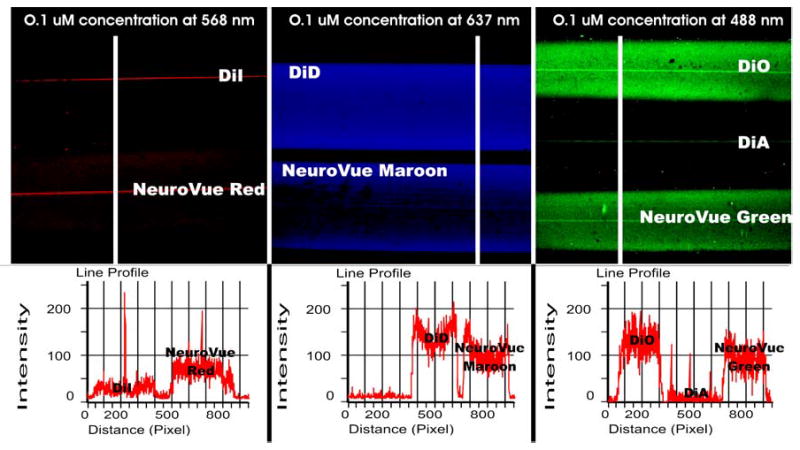
Center line in each capillary is the reflection of the curved capillary. Line profiles shown below each image represent cross sectional intensity measure at the location shown by the white line as a region of interest positioned at equivalent positions for each capillary combination. Left panel: Using 568 nm excitation, DiI fluorescence is 4 times less intense than that of NeuroVue Red (100% and 400%, respectively). Center panel: Using 637 nm excitation, DiD and NeuroVue Maroon fluoresce nearly comparable (100% and 98%, respectively). Right panel: Using 488 nm excitation, DiA provides over 10 times less signal than either DiO or NeuroVue Green (100%, 5% and 98%, respectively).
For neuronal tract tracing, dyes were applied using the coated filter method previously described [10]. Initial studies (Figs. 2–4) used coated nylon filters (Schleicher & Schuell, 8 μm pore size) prepared at Creighton University. The filters were sectioned into thin strips, soaked in saturated xylene solutions of dye, air-dried to remove solvent and cut into small triangles with microscissors. For the studies depicted in Fig. 5, Whatman 0.8μm, 47mm diameter nylon filters (VWR cat # 7408-004) were used since Schleicher & Schuell had discontinued the filter type used in earlier studies. Dye coated filters were prepared at PTI Research by dissolving NeuroVue Red in N,N-dimethylformamide to a final concentration of 100 mM, soaking the entire filter in dye solution for 1 min. on each side. After coating, the filters were air dried in a fume hood for 48 hours and, as before, cut into small triangles with micro scissors.
Fig. 2. Simultaneous pair wise application of four different dyes to the spinal nerve roots.
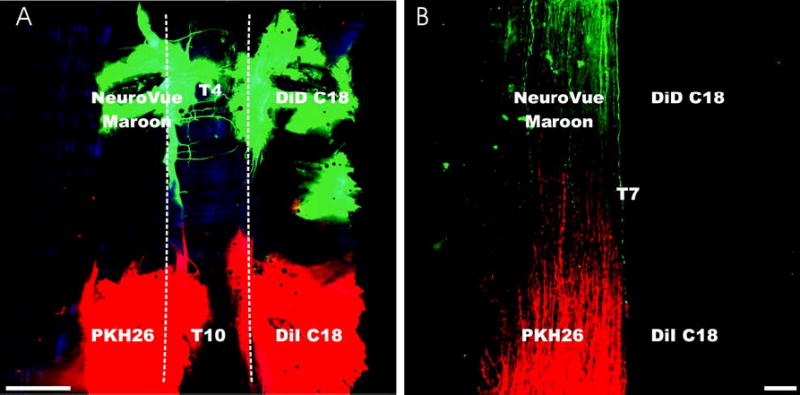
Near infrared or red emitting dyes were coated on nylon filters as described in Methods, applied pair wise as shown to the left and right intercostal spaces adjacent to the T4 or T10 dorsal root ganglia and allowed to diffuse for 24 hours at 36°C. The spinal column and spinal cord were then dissected and mounted whole in glycerol for confocal imaging. Images were taken ventrally at low magnification to allow visualization of the entire diffusion distance (Panel A). Dotted line indicates the vertebral column in A. The spinal cord was then dissected and viewed dorsally at higher magnification to allow visualization of single fibers as they run in the dorsal funiculus (Panel B), enabling simultaneous comparisons among 2 different red-emitting dyes (red pseudocolor) and 2 different infrared emitting dyes (green pseudocolor). In this system, NeuroVue Maroon was consistently visualized at greater distances than DiD; PKH26 was consistently visualized at greater distances than DiI. Similar results were obtained when NeuroVue Red was compared to DiI (not shown). Bar indicates 1mm (A) and 100 μm (B).
Fig. 4.

Single optical section using the confocal microscope through the vestibular ganglion. Three dyes were simultaneously applied to three different end organs: PKH2 was applied to the saccule (A), DiI was applied to the utricle (B), NeuroVue Maroon was applied to the posterior crista (C). Note that each dye allows a complete and spectrally segregated labeling of the vestibular sensory neurons projecting to three endorgans. Electronically combined to a single image (D) such an approach allows clear identification of single (dotted circle), double (arrowhead) and possibly even triple labeled neurons. It also demonstrates the partially segregated and partially overlapping distribution of sensory neurons in the vestibular ganglion as previously described [21]. Bar in A indicates 100 μm.
Fig. 5. Two-color confocal images of developing Schwann cells in the neonatal ear of the PLP-eGFP P0 transgenic mouse.
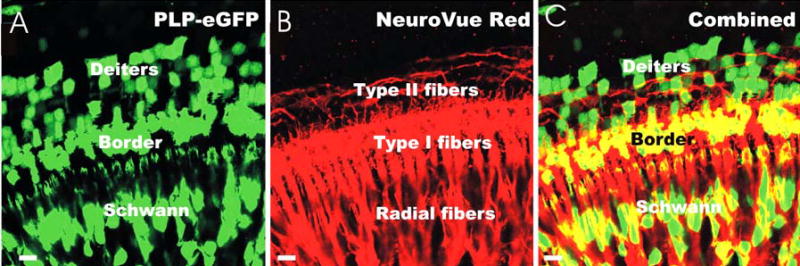
The combination of NeuroVue Red with direct fluorescence of enhanced green fluorescent protein (eGFP) is shown (C). Note that eGFP (A, 488 nm excitation) and NeuroVue Red (B, 568 nm excitation) channels are completely segregated with no overlap. Combining the channels electronically allows the imaging of nerve fiber interactions in this case with the PLP-eGFP labeled Schwann cells at cellular resolution (C). Similar results were obtained with NeuroVue Maroon (not shown), suggesting the feasibility of 3 color studies using direct imaging of eGFP in aldehyde fixed tissue combined with NeuroVue Maroon and NeuroVue Red lipophilic dye tracing for up to 3 days at 36° C in 4% paraformaldehyde without appreciable loss of eGFP signal. Bar indicates 10 μm.
2.3. Animals
Twenty four 14.5 day old embryos, 16 newborn mice and 6 mice of postnatal day 7 (P7) were used. All embryos were perfused with 4% paraformaldehyde in 0.1 M phosphate buffer and stored for at least one day in fixative before further processing. Neonates and 7 day old embryos were deeply anesthetized with Nembutal via intraperitoneal injection. Animals were only perfused after corneal reflexes and paw withdrawal reflexes had stopped. Animal procedures were approved by the Creighton University IACU approval (protocol # 0600; 0630). Animals were pinned on a Sylgard coated Petri dish, their chests were opened and perfusion was with a 28 gauge or smaller needle through the left ventricle. Care was taken to open the right atrium after start of fixation. After one minute the needle was relocated into the aortic arch and perfusion continued for another 2 minutes.
2.4. Tissue labeling with dye coated nylon filters
Labeling was initiated by insertion of dye coated filter triangles into selected tissue regions, with timing and location of insertion site(s) being varied as appropriate depending on the particular dye combinations used.
Two color tract tracing
Labeling sites included: auditory cortex and inferior colliculus; saccule and posterior crista; left and right ear; left and right inferior colliculus; cerebellum and brainstem.
Three color tract tracing
Labeling sites included: auditory, visual and somatosensory cortex; saccule, utricle and posterior crista; spinal cord, cerebellum and brainstem.
Additional studies
We also directly compared the diffusion of NeuroVue Maroon, PKH26 or NeuroVue Red, DiI and DiD in a single spinal cord tissue preparation. For this study we inserted DiI and either PKH26 or NeuroVue Red into the left and right thoracic dorsal root ganglia, respectively, at the thoracic vertebra 10 (T10). DiD and NeuroVue Maroon were inserted into the left and right dorsal root ganglia at thoracic level 4 (T4), respectively. In a second set of experiments, we compared NeuroVue Maroon directly to DiD, NeuroVue Red, DiI, PKH2, PKH26, DiA, DiO or NeuroVue Green in the same settings on the confocal system.
After insertion of the coated filters, dyes were allowed to diffuse for 24 – 96h at 37°C in an incubator oven. During diffusion, brains were continuously kept in 4% paraformaldehyde in 0.1 M phosphate buffer.
2.5. Dissection and sectioning
After appropriate diffusion times, established as detailed previously [23], spinal cords, ears, vestibular ganglia and brains were dissected. Spinal cords and vertebral columns with the injection sites were mounted flat on a slide in glycerol and coverslipped using pieces of a coverslip as spacers. Ears and vestibular ganglia were also dissected and mounted flat on a slide in glycerol. Brains were transferred to 30% sucrose in 4% paraformaldehyde in 0.1 M phosphate buffer for one hour. They were briefly washed in 0.1 M phosphate buffer and embedded in 10% gelatin in 0.1 M phosphate buffer in cryomolds (Tissue Tek). After the gelatin had set, the cryomolds with the gelatin and brain were transferred to 10% paraformaldehyde solution in 0.1 M phosphate buffer and kept at 4°C for at least four days.
Brains with the hardened gelatin surrounding them were cut out of the cryomolds, trimmed, mounted on a vibratome stage, and sectioned at 100 μm thickness. Serial sections were collected in microwells filled with chilled 0.1 M phosphate buffer. Sections were transferred with brushes to a slide and cover slipped in glycerol. Carbocyanine dyes are fairly fade resistant and we did not find much effect using antifading agents. For best results, we recommend viewing immediately after mounting. However, sections and whole mounted brains or ears can be stored in the cold for at least 24 hours prior to viewing without obvious loss in image quality.
2.6. Confocal imaging of dye filled capillaries, whole mounts and sections
All confocal imaging was done using a BioRad Radiance 2000 confocal system mounted on a Nikon Eclipse 800 upright microscope. For excitation we used the 488nm, 568nm, and 637nm bands In the Radiance 2000, the 647nm band of the Kr/Ar laser is suppressed and replaced by a 637nm infrared diode laser. We used the following settings on the Biorad Radiance 2000 filter system, which were found to give efficient excitation and good segregation of the tested dyes.
For DiA, DiO, PKH2 or NeuroVue Green: 488 nm excitation (5 mW, gain 90). PMT for 488 nm channel with dichroic mirror set at 500 nm and emission filter set at 515–540 nm.
For DiI, PKH26 or NeuroVue Red: 568nm excitation (5 mW, gain 90). PMT for 568 nm channel with dichroic mirror set at 580 nm and emission filter set at 600–640 nm.
For DiD or NeuroVue Maroon: 637 nm excitation (3 mW, gain 80). PMT for 637 nm channel with dichroic mirror directing all remaining energy to this PMT and emission filter set at 660 LP.
Images were imported into ImagePro for further analysis and converted to TIFF files. These converted files were imported into CorelDraw and assembled into plates without any further adjustment of intensity, brightness or contrast.
2.7. Conventional imaging of dyes using epifluorescence
We also viewed the preparations using epifluorescence microscopy using the following filter cubes and a Dage (MCI CCD 72; 640x480 pixels resolution) infrared sensitive black and white camera:
For DiA, DiO, PKH2 and NeuroVue Green we used a fluorescein filter set with 480/30 exciter, 505 dichroic and 535/40 emitter filters (Chroma #31001).
For DiI, PKH26 and NeuroVue Red we used a rhodamine filter set with 540/25 exciter, 565 dichroic and 605/55 emitter filters (Chroma #31002a)
For DiD and NeuroVue Maroon we used a Cy5 filter set with 640/20 exciter, 660 dichroic and 680/30 emitter filters (Chroma #31023)
As previously reported [29], only PKH2 could be fully segregated from DiI or PKH26 or NeuroVue Red using these filter sets, whereas DiA was visible as a fainter red image in the rhodamine filter set. Both DiD and NeuroVue Maroon were faintly visible as a darker Red in our rhodamine filter set, whereas none of the 488 or 568 nm excited dyes were visible in the Cy5 filter set. Due to the limited range of human spectral sensitivity in the near infrared, DiD and NeuroVue Maroon were only faintly visible to the naked eye in the Cy5 filter set. For this reason, use of an infrared sensitive CCD camera is recommended for the viewing of these dyes in a normal epifluorescent microscope.
2.8. Compatibility of lipophilic tracers with eGFP labeling
To determine the compatibility of the new lipophilic dyes with enhanced green fluorescent protein (eGFP) as a marker for specific gene expression, we used the recently available PLP-eGFP transgenic mouse [24]. In this mouse the expression of eGFP is controlled by the proteolipid protein (PLP) promoter, enabling direct visualization of promoter expression in myelinating cells such as Schwann cells. Briefly, mice bearing this transgene were fixed by 4% paraformaldehyde perfusion as outlined above. Lipophilic dyes (NeuroVue Maroon and/or NeuroVue Red) were inserted into the brainstem to label afferent and/or efferent fibers to the ear. After appropriate diffusion times, as monitored visually using epifluorescence, the fixed cochlea was dissected, mounted whole and viewed with a confocal microscope using 488 nm excitation for eGFP and 568 nm or 637 nm excitation for NeuroVue Red or NeuroVue Maroon, respectively.
3. Results
3.1. Comparison of 568 nm excitable dyes
DiI, PKH26 and NeuroVue Red are all readily visualized by epifluorescence microscopy and give relatively similar signal intensities using our rhodamine filter set (data not shown). However, when capillaries containing equimolar concentrations of DiI and NeuroVue Red were imaged by confocal microscopy under identical instrument conditions, NeuroVue Red was consistently brighter than DiI (Fig. 1). Using DiI as the reference dye, relative intensities for regions of interest positioned at equivalent locations within capillaries containing DiI and NeuroVue Red were 100% and 400%, respectively. This result is consistent with the fact that NeuroVue Red is more strongly excited by the 568 nm Kr/Ar line than DiI (Table I).
In direct comparisons in which either PKH26 or NeuroVue Red were applied simultaneously with DiI, both PKH26 (Fig. 2) and NeuroVue Red (data not shown) could be consistently imaged farther away from the injection site than DiI. To determine how large a role suboptimal excitation might play in this result, we did a small study comparing PKH26 with simultaneously applied Ph2-DiI. PKH26, like DiI, is suboptimally excited by the 568 nm Kr/Ar line, while Ph2-DiI, like NeuroVue Red, has an excitation maximum very close to 568nm. In these studies (data not shown), PKH26 was again able to be imaged farther away from the injection site than Ph2-DiI, despite its less than optimal excitation. Thus, under the experimental conditions used here, NeuroVue Red and PKH26 appear to be somewhat superior to DiI with respect to visibility over longer diffusion distances after identical diffusion times in the same tissue sample. Overall, the dyes diffuse at a speed between 1.5 – 2.2 mm per 24 hours of diffusion, slowing down considerably with increased distances. Diffusion was slower in tissue fixed for a longer time (6 months or more). All lipophilic dyes have a tendency to diffuse into myelin [30] which limits their usefulness in adult tissue. We show retrograde (Fig. 3) and anterograde (Fig. 5) and transganglionic (Figs. 2–4) diffusion of these dyes with no indication of preferences of directions toward or away from a neuron.
Fig. 3. Double labeling of fibers crossing in a embryonic mouse hindbrain.

Using a combination of the red-emitting PKH26 (red pseudocolor) and the near infrared emitting NeuroVue Maroon (green pseudocolor) allows discrete imaging even to the single fiber level and completely segregates labeling of two channels with minimal bleed-through of NeuroVue Maroon into the 568 nm channel except at extremely high concentrations of NeuroVue Maroon (e.g. near the site of dye insertion). Only PKH26 labeled facial branchial motoneurons (FBM) and inner ear efferents (IEE) as the cross the floor plate (FP) are visible after this injection into the ear and facial nerve. Only NeuroVue Maroon labeled facial branchial motoneurons (FBM) and facial visceral motoneurons of the superior salivatory nucleus (SS) are visible after injection only in the facial nerve. Higher magnifications show the fibers of inner ear efferents (IEE) and facial branchial motoneurons (green) running for variable distances along the midline of the floor plate (C–E). Note that single fibers can be resolved in either channel alone (D,E) or combined (C). Bar indicates 100 μm.
3.2. Comparison of 637/647 nm excited dyes
The excitation maxima of DiD and NeuroVue Maroon are quite similar (Table I), both being well matched to the 647nm Kr/Ar line and also within 10 nm of the 637nm Red diode line available on many confocal systems. Both dyes can therefore be excited close to their excitation maxima, providing the potential for a bright signal and substantially improved signal to noise ratio compared with dyes excited at lower wavelengths where tissue autofluorescence is higher.
When capillaries containing equimolar concentrations of NeuroVue Maroon and DiD were imaged by confocal microscopy under identical instrument conditions, NeuroVue Maroon was as bright as DiD (Fig. 1). Using DiD as the reference dye, relative intensities for regions of interest positioned at equivalent locations within capillaries containing DiD and NeuroVue Maroon were 100% and 98 %, respectively, well within the margin of error of the dilutions used. As noted in Methods, both DiD and NeuroVue Maroon are poorly visible to the naked eye using epifluorescence microscopy. However, owing to the slightly shorter excitation maximum of NeuroVue Maroon, we found that this dye could be visualized somewhat more effectively than DiD with the Cy5 filter cube. This means that NeuroVue Maroon-labeled tissue samples can be easier monitored for appropriate diffusion distances using an infrared sensitive CCD camera.
In direct comparisons in which NeuroVue Maroon and DiD were simultaneously applied to the same spinal cord samples, NeuroVue Maroon was consistently able to be imaged farther away from the injection site than DiD (Fig. 2). Overall, results to date suggest that NeuroVue Maroon is at least as effective as DiD for neuronal tract tracing and, in our hands, superior with respect to visibility over longer diffusion distances for similar diffusion times.
3.3. Comparison of 488 nm excited dyes
As expected given the better match of their excitation maxima to the 488 nm laser line (Table 1), NeuroVue Green and DiO were much brighter than DiA when equimolar concentrations were imaged by confocal microscopy under identical instrument conditions (Fig. 1). Using DiO as the reference dye, relative intensities for regions of interest positioned at equivalent locations within capillaries containing DiO, DiA and NeuroVue Green were 100%, 5%, and 98%, respectively. Also as expected based on previous work [29], we could not obtain long range transport of DiO in our tissue preparations but did see slow diffusion of PKH2 (Fig. 4). DiA, PKH2 and NeuroVue Green all appeared to diffuse at about the same speed but DiA gave suboptimal results compared with PKH2 and NeuroVue Green in two regards. First, as noted above, it gave lower overall signal intensity due to suboptimal excitation. Second, its large Stokes shift caused some bleed through in the filter window used to detect the 568 nm excited dyes.
3.4. Choice of dyes for multicolor tracer studies
Two- and three-color studies with lipophilic tracers
Using the spinal cord system described in Fig. 2 and comparing the results obtained for the three different groups of dyes tested, we found that:
Within a given group (near infrared, red or green fluorescent), the new NeuroVue dyes were consistently detectable at longer distances, suggesting that they can be imaged at lower concentrations than existing dyes and/or they diffuse faster than existing dyes;
The red-emitting dyes (DiI, PKH26, NeuroVue Red) and near infrared-emitting dyes (DiD, NeuroVue Maroon) were consistently detectable at longer distances than the green-emitting dyes (DiO, DiA, PKH2, NeuroVue Green).
For all of the green fluorescent dyes (DiO, DiA, PKH2, NeuroVue Green), imaging was difficult in thick tissue or whole mounts of older embryos and neonates owing to the broad unspecific autofluorescence present when using 488 nm excitation.
Of all the dyes evaluated, we consistently found that NeuroVue Maroon could be detected the most clearly over the longest distance.
Based on the above results, we focused on the red (568 nm excited) and near infrared (637 nm excited) dyes for double labeling studies (Fig. 3). Overall, we found that excellent double labeling with complete color segregation could be achieved by combining DiI, PKH26 or NeuroVue Red with DiD or NeuroVue Maroon (Figs. 2 and 3). Despite their limitations, we also found that the green (488 nm excited) dyes could be successfully employed for triple labeling experiments (Fig. 4).
3.5. Multicolor studies with eGFP
Proteolipid protein (PLP)-eGFP is expressed in myelin forming cells such as Schwann cells that surround the developing nerve fibers [24]. A transgenic line that expressed eGFP under PLP promoter fragment control has been generated that allows identification of cells expressing this transgene. Either NeuroVue Red (Fig. 5) or NeuroVue Maroon (not shown) can be combined with the eGFP labeling. Combining a lipophilic marker with a transgenic marker clearly demonstrates that every fiber is surrounded by developing Schwann cells in the neonatal ear, and provides a useful approach to determination of when, during development, the eGFP-labeled Schwann cells establish their tight interaction with the growing nerve processes. Three color studies with eGFP, NeuroVue Red and NeuroVue Maroon are also clearly feasible given their good color segregation and the consistent ability of these new tracers to be visualized at longer distances than existing dyes.
4. Discussion
We provide here data on the systematic analysis of the detection properties of five widely used lipophilic dyes as well as three novel dyes, NeuroVue Maroon, NeuroVue Red and NeuroVue Green. Dyes were solubilized in organic solvents and coated onto nylon filter strips for matched, pair-wise application to the same fixed spinal cord preparation. Two of the new dyes, NeuroVue Maroon and NeuroVue Red, showed excellent diffusion and consistent ability to be visualized over longer distances than the other dyes, including the most widely used lipophilic dye for neuronal tract tracing in fixed tissue, DiI. NeuroVue Green, although consistently visualized over longer distances than the other green-emitting dyes tested (DiO, DiA), still shared with them the property of slower diffusion/shorter detection distances when compared with the red or near infrared tracers. All three of the new dyes have excitation maxima well matched to the Kr/Ar and red diode laser lines commonly found on confocal microscopes (Table 1) and are therefore efficiently excited in such systems (Fig. 1).
Our suggestions for the most useful two- and three-color dye combinations are based on comparison of maximum detection distances, which are affected not only by the amount of dye present at a given distance from the application site but also by the efficiency with which that amount of dye can be excited and detected. As previously noted [1], near infrared dyes provide a clearer image by reducing the signal to noise ratio. This is so because the autofluorescence of the tissue is negligible at these long wavelengths. This issue is particularly important in the analysis of postnatal and adult brains where increasing levels of myelin formation and associated autofluorescence can almost completely obscure the fluorescence signal from background for the 488 nm excited dyes and render them essentially useless in thick sections or whole mounts of neonates older than 7 days of age [23]. As with other lipophilic dyes, the new dyes may be useful for in vivo tracing studies [2] that may help overcome the limitations of diffusion into myelin as the transport is in part in small vesicles inside the neuronal cytoplasm.
Results to date suggest that for most laboratory applications a combination of NeuroVue Maroon (near infrared) with either NeuroVue Red, PKH26 or DiI (red) is an excellent choice for double label experiments (Figs. 2 and 3), and that either NeuroVue Red or NeuroVue Maroon is an excellent choice for two color studies in combination with eGFP (Fig. 5). The only disadvantage we found for NeuroVue Maroon (also true for DiD) is a tendency to absorb all fluorescence near the application site. Although this makes comparison of absolute diffusion distances somewhat more difficult, fortunately it is an issue of little concern in normal laboratory use where the goal is typically to maximize the diffusion distance from the application site at which labeled neurons can be imaged.
Despite the strong advantages of near infrared dyes, the green lipophilic dyes, including NeuroVue Green, can still be useful for two color studies, particularly if no confocal system is available. However, because all of the green dyes diffuse significantly more slowly than their red or infrared counterparts, separate preliminary studies are required to determine the appropriate head start needed by the green dyes to obtain similar diffusion distances [22].
We have previously shown that three color studies can be done using DiD, DiI and DiA, although this combination requires longer diffusion times and is subject to some bleed through of DiA fluorescence into the DiI channel [22]. However, based on experience with the new dyes tested here, we suggest that triple label experiments can be most easily performed using a combination of NeuroVue Maroon (near infrared), NeuroVue Red (or PKH26) and NeuroVue Green (or PKH2). Given that PKH2 and PKH26 are not commercially available in crystalline form, NeuroVue Green and NeuroVue Red appear at present to be the green and red dyes of choice for three color studies. We are therefore currently working toward a standard diffusion table for the NeuroVue dyes using filters coated with specified molar concentrations of each dye that we believe will further enhance their usefulness in triple label paradigms.
For these initial studies in which a large number of dyes were being compared, we used a model system in which multiple dyes could be compared simultaneously (Fig. 2) and made a simple qualitative assessment of which dyes were detectable at the greatest distance from the point of application after a 24-hour diffusion period. However, multiple variables influence the maximum detectable distance, including spectral properties that affect efficiency of excitation and detection, solubility and coating factors that affect concentration of dye at the site of application and details of dye structure that affect two dimensional diffusion rate within the membrane [5]. The spectral properties of NeuroVue Maroon, NeuroVue Red and NeuroVue Green appear to be well optimized for use in typical confocal systems (Fig. 1). However, since the filter preparation method used here (i.e. coating with saturated solutions of dye in xylene or DMF) may lead to some variability in molar amount of dye deposited, we cannot exclude that some of the differences seen were due to differences in dye concentration and further investigation of these effects is required. We are therefore currently developing a method for co-loading dye strips with two dyes at comparable concentrations to mimimize concentration-related differences when comparing dyes. Ongoing investigations are also exploring whether the effects of dye structure on diffusion rate follow the theoretical considerations described in the literature [5].
Auditory system studies using DiI and dextrans have changed past perspectives based on non-tract tracing analysis significantly and showed much earlier arrival of efferent fibers from the brainstem at the ear than previously anticipated [4,10]. Likewise, tract tracing with DiI made it possible for the first time to study the fiber growth in embryos from the cochlear nuclei to the inferior colliculus [20]. While useful, these studies have also highlighted the limits of the single color approach: contact formation with developing target neurons has to be painstakingly reconstructed in independent analyses, with the possibilities for topological errors. Clearly, the only way to overcome such difficulties requires double or triple color labeling to image simultaneously afferent fibers and innervated neurons. Studies that try to establish early onset of connections between nuclei that have none or have a limited boundary identification at embryonic stages are even more complex. Double labeling has recently been identified as one way out of this problem [17]. Triple labeling would be even more useful, allowing direct simultaneous labeling of different areas of the thalamic relay nuclei projecting to different cortical areas throughout different stages of thalamo-cortical connectional development.
Triple labeling has become the standard for most immunocytochemical analysis today [19], because this allows the comparison of a standard label (for example an already known developmental marker) with two experimental labels. Our data provided here (Fig. 2–5) shows that the new NeuroVue dyes enable clear double and triple labeling and thus allow for comparatively easy co-labeling of profiles that converge or diverge from a chosen source in either anterograde or retrograde direction. Because of the high reliability of these labels and their excellent resolution down to single fiber labeling (Fig. 3–5), these dyes represent an excellent expansion to the existing repertoire of dyes for neuronal tract tracing. In addition, they can be used in conjunction with other labels such as green fluorescent protein (eGFP) to show more specific interactions of fibers labeled from specific implantation sites with selected targets or cells (Fig. 5). As more and more eGFP expressing marker systems are generated, we expect that these lipophilic dyes will enable cellular interactions to be readily detailed at both the hodologically (connections between cells) and molecularly (eGFP as a molecular cell specific marker) defined levels by combining native eGFP imaging with lipophilic tracers, thus further enhancing our understanding of critical developmental events at the single cell level.
Acknowledgments
This work was supported by NIH grants R43 DC006512 and R44 EB00228 to PTI Research and DC005590 to Bernd Fritzsch. We gratefully acknowledge the provision of PLP-eGFP mouse embryos by Jackie Morrison and Wendy Macklin, and the gift of crystalline PKH2 and PKH26 from Phanos Technologies, Inc. This investigation was conducted in a facility constructed with support from Research Facilities Improvement Program Grant Number 1 C06 RR17417-01 from the National Center for Research Resources, National Institutes of Health. We acknowledge the use of the confocal microscope facility of the NCCB, supported by EPSCoR EPS-0346476 (CFD 47.076).
References
- 1.Agmon A, Yang LT, Jones EG, O’Dowd DK. Topological precision in the thalamic projection to neonatal mouse barrel cortex. J Neurosci. 1995;15:549–561. doi: 10.1523/JNEUROSCI.15-01-00549.1995. [DOI] [PMC free article] [PubMed] [Google Scholar]
- 2.Barbier M, Gray BD, Muirhead KA, Ronot X, Boutonnat J. A flow cytometric assay for simultaneous assessment of drug efflux, proliferation, and apoptosis. Cytometry B Clin Cytom. 2004;59:46–53. doi: 10.1002/cyto.b.20004. [DOI] [PubMed] [Google Scholar]
- 3.Bruce LL, Christensen MA, Fritzsch B. Electron microscopic differentiation of directly and transneuronally transported DiI and applications for studies of synaptogenesis. J Neurosci Methods. 1997;73:107–112. doi: 10.1016/s0165-0270(96)02218-2. [DOI] [PubMed] [Google Scholar]
- 4.Bruce LL, Kingsley J, Nichols DH, Fritzsch B. The development of vestibulocochlear efferents and cochlear afferents in mice. Int J Dev Neurosci. 1997;15:671–692. doi: 10.1016/s0736-5748(96)00120-7. [DOI] [PubMed] [Google Scholar]
- 5.Choquet D, Triller A. The role of receptor diffusion in the organization of the postsynaptic membrane. Nat Rev Neurosci. 2003;4:251–265. doi: 10.1038/nrn1077. [DOI] [PubMed] [Google Scholar]
- 6.Fritzsch B, Wilm C. Dextran amines in neuronal tracing. Trends Neurosci. 1990;13:14. doi: 10.1016/0166-2236(90)90056-g. [DOI] [PubMed] [Google Scholar]
- 7.Fritzsch B, Sonntag R. Sequential double labelling with different fluorescent dyes coupled to dextran amines as a tool to estimate the accuracy of tracer application and of regeneration. J Neurosci Methods. 1991;39:9–17. doi: 10.1016/0165-0270(91)90088-h. [DOI] [PubMed] [Google Scholar]
- 8.Fritzsch B. Fast axonal diffusion of 3000 molecular weight dextran amines. J Neurosci Methods. 1993;50:95–103. doi: 10.1016/0165-0270(93)90060-5. [DOI] [PubMed] [Google Scholar]
- 9.Fritzsch B, Christensen MA, Nichols DH. Fiber pathways and positional changes in efferent perikarya of 2.5- to 7-day chick embryos as revealed with DiI and dextran amines. J Neurobiol. 1993;24:1481–1499. doi: 10.1002/neu.480241104. [DOI] [PubMed] [Google Scholar]
- 10.Fritzsch B, Nichols DH. DiI reveals a prenatal arrival of efferents at the differentiating otocyst of mice. Hear Res. 1993;65:51–60. doi: 10.1016/0378-5955(93)90200-k. [DOI] [PubMed] [Google Scholar]
- 11.Fritzsch B, Northcutt RG. Origin and migration of trochlear, oculomotor and abducent motor neurons in Petromyzon marinus L. Brain Res Dev Brain Res. 1993;74:122–126. doi: 10.1016/0165-3806(93)90091-n. [DOI] [PubMed] [Google Scholar]
- 12.Garel S, Yun K, Grosschedl R, Rubenstein JLR. The early topography of thalamocortical projections is shifted in Ebf1 and Dlx1/2 mutant mice. Development. 2002;129:5621–5634. doi: 10.1242/dev.00166. [DOI] [PubMed] [Google Scholar]
- 13.Gilland E, Baker R. Conservation of neuroepithelial and mesodermal segments in the embryonic vertebrate head. Acta Anat (Basel) 1993;148:110–123. doi: 10.1159/000147530. [DOI] [PubMed] [Google Scholar]
- 14.Glover JC. Retrograde and anterograde axonal tracing with fluorescent dextran-amines in the embryonic nervous system. Neuroscience Protocols. 1995;30:1–13. [Google Scholar]
- 15.Glover JC. Development of specific connectivity between premotor neurons and motoneurons in the brain stem and spinal cord. Physiol Rev. 2000;80:615–647. doi: 10.1152/physrev.2000.80.2.615. [DOI] [PubMed] [Google Scholar]
- 16.Godement P, Vanselow J, Thanos S, Bonhoeffer F. A study in developing visual systems with a new method of staining neurones and their processes in fixed tissue. Development. 1987;101:697–713. doi: 10.1242/dev.101.4.697. [DOI] [PubMed] [Google Scholar]
- 17.Gurung B, Fritzsch B. Time course of embryonic midbrain and thalamic auditory connection development in mice as revealed by carbocyanine dye tracing. J Comp Neurol. 2004;479:309–327. doi: 10.1002/cne.20328. [DOI] [PMC free article] [PubMed] [Google Scholar]
- 18.Honig MG, Hume RI. Dil and diO: versatile fluorescent dyes for neuronal labelling and pathway tracing. Trends Neurosci. 1989;12:333–335. 340–331. [PubMed] [Google Scholar]
- 19.Inaki K, Nishimura S, Nakashiba T, Itohara S, Yoshihara Y. Laminar organization of the developing lateral olfactory tract revealed by differential expression of cell recognition molecules. J Comp Neurol. 2004;479:243–256. doi: 10.1002/cne.20270. [DOI] [PubMed] [Google Scholar]
- 20.Kandler K, Friauf E. Pre- and postnatal development of efferent connections of the cochlear nucleus in the rat. J Comp Neurol. 1993;328:161–184. doi: 10.1002/cne.903280202. [DOI] [PubMed] [Google Scholar]
- 21.Maklad A, Fritzsch B. Incomplete segregation of endorgan-specific vestibular ganglion cells in mice and rats. J Vestib Res. 1999;9:387–399. [PubMed] [Google Scholar]
- 22.Maklad A, Fritzsch B. The developmental segregation of posterior crista and saccular vestibular fibers in mice: A carbocyanine tracer study using confocal microscopy. Develop Brain Research. 2002;135 doi: 10.1016/s0165-3806(01)00327-3. [DOI] [PubMed] [Google Scholar]
- 23.Maklad A, Fritzsch B. Partial segregation of posterior crista and saccular fibers to the nodulus and uvula of the cerebellum in mice, and its development. Brain Res Dev Brain Res. 2003;140:223–236. doi: 10.1016/s0165-3806(02)00609-0. [DOI] [PubMed] [Google Scholar]
- 24.Mallon BS, Shick HE, Kidd GJ, Macklin WB. Proteolipid promoter activity distinguishes two populations of NG2-positive cells throughout neonatal cortical development. J Neurosci. 2002;22:876–885. doi: 10.1523/JNEUROSCI.22-03-00876.2002. [DOI] [PMC free article] [PubMed] [Google Scholar]
- 25.Manns M, Fritzsch B. The eye in the brain: retinoic acid effects morphogenesis of the eye and pathway selection of axons but not the differentiation of the retina in Xenopus laevis. Neurosci Lett. 1991;127:150–154. doi: 10.1016/0304-3940(91)90782-o. [DOI] [PubMed] [Google Scholar]
- 26.Nissen UV, Mochida H, Glover JC. Development of projection-specific interneurons and projection neurons in the embryonic mouse and rat spinal cord. J Comp Neurol. 2005;483:30–47. doi: 10.1002/cne.20435. [DOI] [PubMed] [Google Scholar]
- 27.Studer M, Lumsden A, Ariza-McNaughton L, Bradley A, Krumlauf R. AlteRed segmental identity and abnormal migration of motor neurons in mice lacking Hoxb-1. Nature. 1996;384:630–634. doi: 10.1038/384630a0. [DOI] [PubMed] [Google Scholar]
- 28.Wilm C, Fritzsch B. Evidence for a driving role of ingrowing axons for the shifting of older retinal terminals in the tectum of fish. J Neurobiol. 1992;23:149–162. doi: 10.1002/neu.480230206. [DOI] [PubMed] [Google Scholar]
- 29.Wilm C, Fritzsch B. Regenerating retinal fibers display error-free homing along undamaged normal fibers. J Neurobiol. 1993;24:898–902. doi: 10.1002/neu.480240703. [DOI] [PubMed] [Google Scholar]
- 30.Xiang M, Maklad A, Pirvola U, Fritzsch B. Brn3c null mutant mice show long-term, incomplete retention of some afferent inner ear innervation. BMC Neurosci. 2003;4:2. doi: 10.1186/1471-2202-4-2. [DOI] [PMC free article] [PubMed] [Google Scholar]