Abstract
A 3D reconstruction algorithm for electrical impedance tomography is presented for determining the distribution of electrical properties inside the body, given electrical measurements made on the surface. A linearized reconstruction algorithm using planar electrode arrays in a handheld probe geometry developed by Mueller et al (1999 IEEE Trans. Biomed. Eng. 46 1379–86) has been refined and extended in this paper. This algorithm is based on linearizing the conductivity about a constant value. We have extended the distance below the electrodes at which a target can be imaged by using a combination of two regularization schemes and a weighted mesh. An appropriate combination of Tikhonov and NOSER regularization produces satisfactory static images of a 2 cm cube placed 2 cm below the array, and difference images of a 1 cm cube 4 cm away from the array. The weighted mesh allows use of fixed regularization parameters for all depths of the target.
Keywords: linearization reconstruction algorithm, current pattern, combined regularization method, weighted mesh
1. Introduction
Electrical impedance tomography (EIT) is a medical imaging technique for determining the electrical conductivity and permittivity distribution in the interior of a body from measurements made on its surface. Typically, conducting electrodes are attached to the skin of the subject and small currents are applied to some or all of the electrodes. Simultaneously, the corresponding electrical potentials are measured. The process is repeated for many different configurations of the applied current. Proposed applications include monitoring of ventilation (Cheney et al 1999, Mueller et al 2001, Cherepenin et al 2002), detection of cancer in the skin (Aberg et al 2004), and in the breast (Cherepenin et al 2001 and Kerner et al 2002) and detection of stroke (Holder 1992, Tidswell et al 2001, Bagshaw et al 2003).
Among noninvasive imaging techniques, EIT is a technique offering low cost, but low resolution, images. Its main limitations are caused by inaccurate modeling of the regionally varying electrode–skin contact impedance, and poor signal-to-noise ratio. Kolehmainen et al (1997) and Blott et al (1998) pointed out that the sizes and locations of the electrodes and the boundary shape of the object provide the most difficulties for the reconstructed image. They suggested that the most feasible way to minimize these errors is to measure them and to use those data in the forward model. For breast cancer detection, the area of interest is a limited anatomical region with a limited depth. Hence, we propose to use a handheld probe, which has fixed size and electrode locations, to reduce those errors and to use a general boundary shape for mathematical modeling.
The handheld probe allows the operator flexibility to move the probe to the place to be examined. We have reported (Kao et al 2003) the results of distinguishability experiments conducted in water tanks with copper targets placed near planar electrode arrays attached to an inside wall of the tank. Having a distinguishability higher than a noise or error threshold is a necessary but not sufficient condition for making a useful image. In general, higher distinguishability implies a larger signal for a reconstruction algorithm to work with. A reconstruction algorithm for EIT using planar electrode arrays was originally developed by Mueller et al (1999). This algorithm is based on linearizing the conductivity about a constant value. The distance at which targets could be reconstructed with satisfactory images by this algorithm was less than 1 cm from the electrode array. In the present study, we reproduced and extended that work using a new test tank with a 5 × 5 electrode array. We have developed a novel means to obtain satisfactory images for targets at greater distances below the array by combining two classical regularization schemes in a single algorithm.
2. Methods
For breast cancer detection, the region of interest is a specific region with a limited depth from the skin. The adjoining chest is relatively large, so we assume that the space under the electrode array is a half-infinite space. Therefore, we simplified the geometry using an aquarium for the experiment and an infinite half-space for the mathematical model to develop our reconstruction algorithm.
2.1. Simplified geometry and the current pattern
We placed an array of 25 stainless steel electrodes at one end of an aquarium (25 cm × 30 cm × 32 cm). The overall array dimension was 8 × 8 cm; each electrode was 1.48 cm2 with 1.5 mm inter-electrode gaps. The aquarium was filled with saline having a conductivity of 300 mS m−1. A ground electrode was placed at the other end of tank, 32 cm away. A cubical copper target was suspended by a stereotaxic apparatus at different distances in front of the electrode array. We applied the optimal current patterns to this system as described by Isaacson (1986). The left-hand side of figure 1 illustrates the mathematical model used for developing the forward model and the reconstruction algorithm. The right-hand side shows the test tank with a suspended target.
Figure 1.
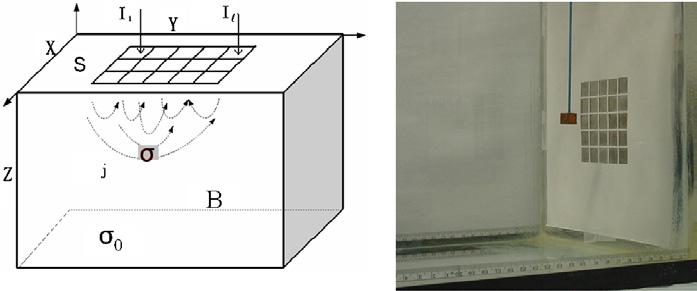
A sketch of a simplified geometry and a photograph of the test tank with a suspended conductive target.
2.2. Reconstruction algorithm and the voxel configuration
At low frequencies, current injected into the body induces an electromagnetic field. We can simplify the geometry of figure 1 as a half-space written as
| (1) |
Here σ denotes the homogeneous, isotropic conductivity and U the voltage inside the body B. The application of currents to the electrodes, at z = 0, induces a current density distribution j written as
| (2) |
The inverse problem is to determine the conductivity σ(x, y, z) from the measurements made on the surface S. Using the linearization method of Mueller et al (1999), we solve ∇·σ∇U = 0 with appropriate boundary conditions to obtain the voltage solution U:
| (3) |
The ‘ave-gap’ model (Cheng et al 1989) approximates current density j by
| (4) |
where Il is the current sent to the lth electrode el and Areal is the surface area of el.
The following steps were followed to reconstruct an approximation to the conductivity σ.
Introduce a guess for a best constant conductivity, σ0.
- Relate the potentials or fields on the surface S to the electrical tissue properties and field inside the body B by the identity
Here the subscript 0 denotes fields due to the conductivity σ0. The superscripts denote the fields that result from different current densities.(5) - Apply an electrode model relating currents and voltages on electrodes labeled with the subscript l = 1,…, L to (5). Use the notation δσ = σ − σ0 and the approximation to obtain the equations relating measured voltages to moments of the unknown conductivity:
(6) Measure and compute the components of the ‘data’ matrix D.
Choose a basis function as a mesh, for the approximation . Compute the coefficient matrix A, where .
Solve equation δσ = (ATA + εR)−1 × ATD and display σ = δσ + σ0 on the mesh. Here, R denotes the regularization method and ε denotes the regularization parameter.
The reconstruction was first done on the simple mesh shown in figure 2. The voxel configuration consists of six layers with 49 (7 × 7) voxels in each layer (left figure). In the region under the electrode array, six layers of 5 × 5 voxels are aligned under the electrodes (right figure). The width and length of the mesh voxels are set to equal those of the electrodes including the gaps between the electrodes. Each voxel layer was 1 cm thick. The voxel configuration must also model the unbounded domain to compensate for currents that might flow out and then back into the domain. This feature is modeled by a layer of voxels around the boundary of the array which is not displayed in reconstructed images.
Figure 2.
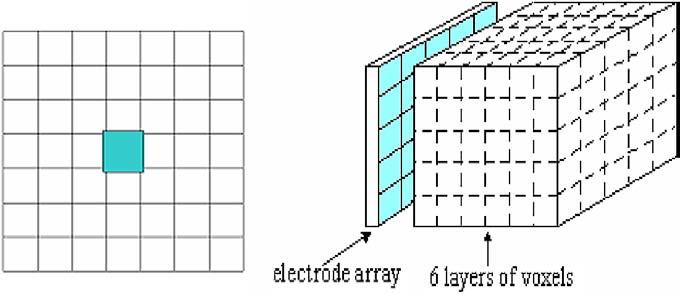
The 7 × 7 mesh used in the reconstructions. We display only the interior 5 × 5 voxels for each layer.
In later tests, we used a 1.1 cm copper cube as a conductive target together with a finer mesh (figure 3) for getting a better resolution of reconstructions. The total number of voxels with six layers is about 2000 which is close to the number of the independent measurements available with the 64-electrode system for which this algorithm is being developed. The width and height of each voxel is 5 mm and its thickness is 10 mm. We discard the outer voxels and display only the center 16 × 16 voxels for each layer. The size of the electrode array and the target are shown on the left of figure 3; the finer mesh is shown on the right. The dots from the center to the top right corner present the positions of the center of the target when the resolution in the X–Y plane was studied.
Figure 3.
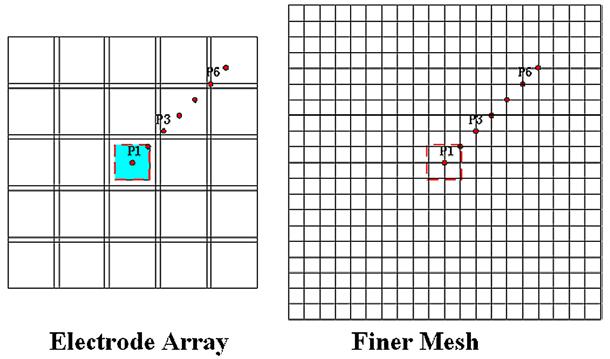
A finer mesh for the handheld probe geometry.
2.3. The combined regularization method
The most often used regularization matrices in EIT are the identity matrix and a diagonal matrix to compensate for the first and second difference operators, the former is called Tikhonov regularization; the latter is called NOSER-type regularization (Cheney et al 1990). Because the handheld probe geometry is severely ill-posed, the Tikhonov method can cut off the noise very well but it also creates pseudo images by adding the identity to the coefficient matrix. The NOSER-type regularization method can present the target at the correct position but reconstructions at large target distances are corrupted by noise. Combining NOSER-type regularization and Tikhonov regularization methods gives better reconstructed images than using either one alone. The regularization equation is expressed as
| (7) |
where εN denotes the regularization parameter of NOSER type and εT denotes the regularization parameter of Tikhonov type. ‘A’ denotes the coefficient matrix (Mueller et al 1999) and ‘I’ the identity matrix. A comparison of the two methods and the result of the combined scheme are shown below.
3. Reconstructions
3.1. Difference image
In order to study the mesh design and regularization methods, and to evaluate the performance of the algorithm, we reconstructed difference images, so as to reduce as much as possible the noise caused by the channel electronics and the individual electrode properties present in this test tank. Within each layer of a difference image, each square depicts the conductivity change from the background in the corresponding voxel.
3.1.1. Two combined classic regularization methods
The Tikhonov regularization method, with a regularization parameter of 0.5, was not able to represent the Z-axis location, i.e. distance from the electrode array, of the target (figure 4). The four rows of the figure show the conductivity change from the background as a centered target is placed at a distance away from the array from 1 cm (upper row) to 4 cm (bottom row), while the columns display the six layers of the mesh used for reconstruction (six columns, left to right). Different conductivity scales, in mS m−1, are used for each row, as shown below that row of images. A sketch illustrating the target positions is shown on the right of the picture. The conductive target was a 2 cm copper cube.
Figure 4.
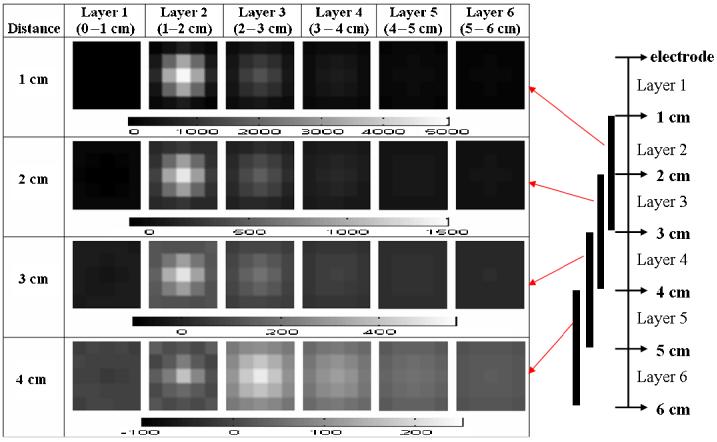
The reconstructed images using a 7 × 7 × 6 voxel mesh with Tikhonov regularization.
When the target was located 1 cm from the electrode, the reconstructions show the target in the correct position with high intensity in layer 2 and less in layer 3. As the target is moved further away, the image becomes fainter and less pronounced in the upper voxel layers but is visible, although only at low intensity, in the expected position. We conjecture that this phenomenon is due in part to the smoothing effect of the Tikhonov regularization in the Z direction.
With NOSER-type regularization (εN =0.5) noise corrupted the images badly if the target was not close to the electrodes (figure 5). We speculate that this is due to the ill-posedness of the handheld probe geometry, which increases significantly with increasing distance from the measuring electrodes.
Figure 5.
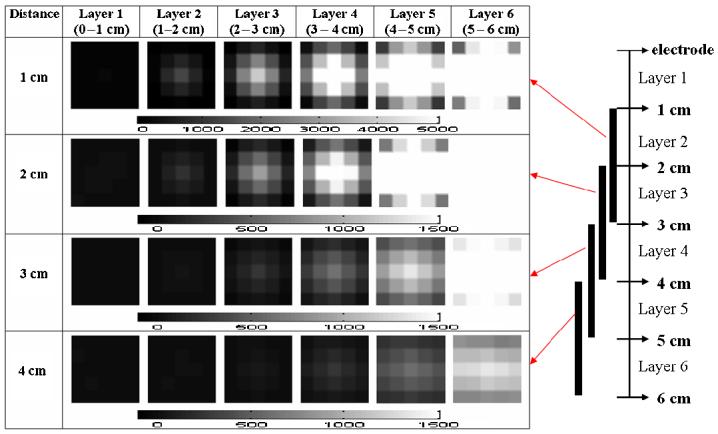
The reconstructed images using a 7 × 7 × 6 voxel mesh with NOSER-type regularization.
To improve upon the results obtained using these two regularization schemes individually (figures 4 and 5), we combined the two regularization methods as described by equation (7), using 0.5 for εT and εN (figure 6). The target was located more clearly and accurately using the combined regularization scheme.
Figure 6.
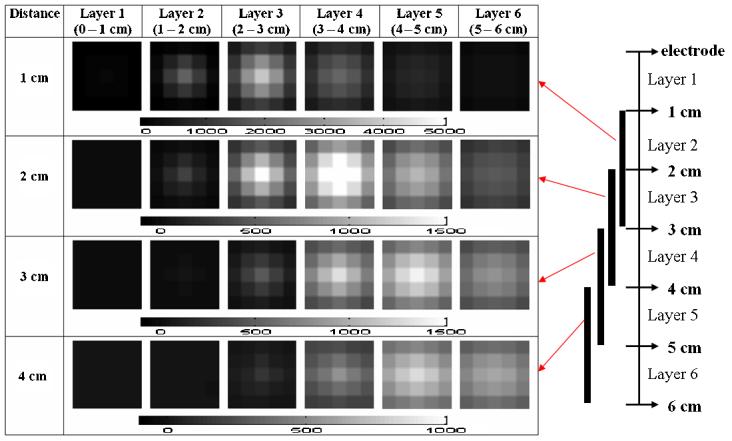
Reconstructions using a 7 × 7 × 6 voxel mesh with combined NOSER and Tikhonov regularization.
To evaluate the X–Y resolution of the reconstruction, we used a finer mesh (figure 3) and suspended a smaller 1 cm copper cube at different locations. Within each layer of the difference image shown in figure 7, each square depicts the conductivity change from background in the corresponding voxel. The top row in the figure displays the conductivity of the second layer of voxels as the target was moved from the center to the upper right corner of the array at a distance of 1 cm below the array. The diagram at the right top shows the target location in that plane, with P1 corresponding to the position for the left-most image and P7 for the right-most image. The bottom four rows show results for a centered target in the same format as figures 4-6. The regularization parameters εN for NOSER and εT for Tikhonov were adjusted to obtain the best image quality for the target at each depth. The target was located correctly in the X and Y directions when it moved in a plane from P1 to P7 (figure 7). The Z-axis resolution was decidedly less, but remained satisfactory as the target moved further away from the electrodes (figure 7).
Figure 7.
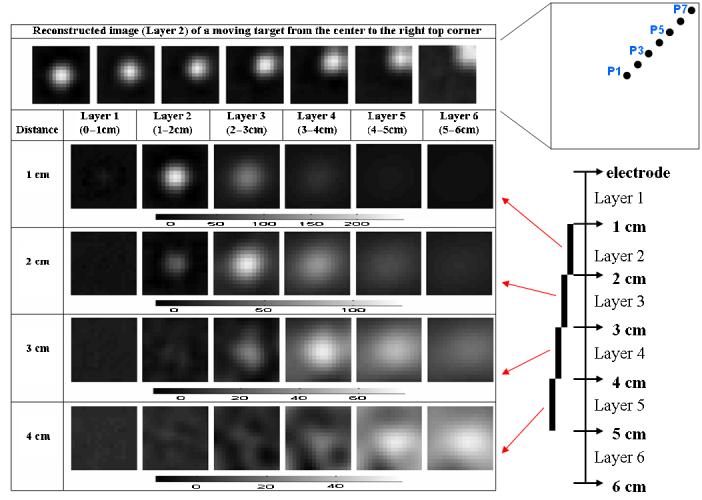
Image reconstructions as the target moved in the X–Y directions and Z direction with adjusted regularization parameters for better image quality.
3.1.2. Weighted mesh for fixing the regularization parameters
Adjusting the regularization parameters based on target location is obviously not feasible in practice when the target location is unknown; this is one type of inverse crime (Lionheart 2004). An algorithm with fixed regularization parameters is needed for practical use. The ill-posedness of this geometry is severe and not only differs from center to corner of a given layer, but also from layer to layer. Using fixed parameters did not give us satisfactory reconstructed images at different depths. Designing an optimal mesh based on the distinguishability variation with location is an approach to solve this problem. The result is a mesh in which the size of the voxels is different in each layer with larger voxels at a greater distance from the array. Mathematically, the mesh is weighted to adjust for the range of the diagonal values of the coefficient matrix A, i.e.,
| (8) |
Reconstructions with the same data set and same format as the previous figure are shown in figure 8. The regularization parameters εN for NOSER and εT for Tikhonov were set to 0.5. The intensity of the images is somewhat reduced and the clarity of the images is a little worse than the previous result when the regularization is optimized for each depth. However, we can determine the target position without varying regularization parameters for the different depths.
Figure 8.
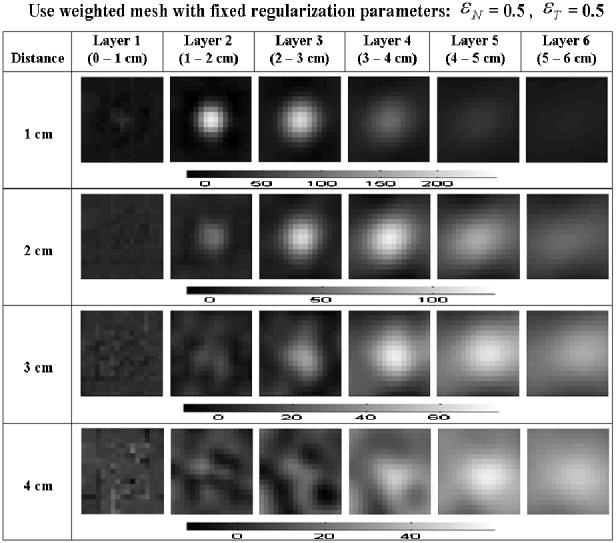
Reconstructions using a weighted mesh with uniform regularization parameters.
3.2. Static image
Difference imaging is often preferred to static imaging, because it is less sensitive to inaccuracies in the forward solution, some errors in the experimental setup or systematic errors in the data acquisition system. Difference images are thus useful for testing algorithms and regularization methods, but they are not suitable for many medical applications. Tumor detection or imaging hemorrhagic or ischemic stroke (McEwan et al 2005) requires static images.
We therefore also reconstructed static images. Because of the ill-posedness of the handheld probe geometry, we can only obtain satisfactory static images by using relatively large values of regularization parameters and relatively large voxels to better pose the problem. The 3D static images of a homogeneous tank and an inhomogeneous tank with a 2 cm cube copper target are shown in figure 9. The reconstructions were obtained using the algorithm of section 2.2 with the coarse six-layer voxel configuration of figure 2. The parameters for the combined regularization were 1.0 for NOSER regularization and 10 for Tikhonov. Different conductivity scales are used for each row, as shown below that row of images, in mS m−1
Figure 9.
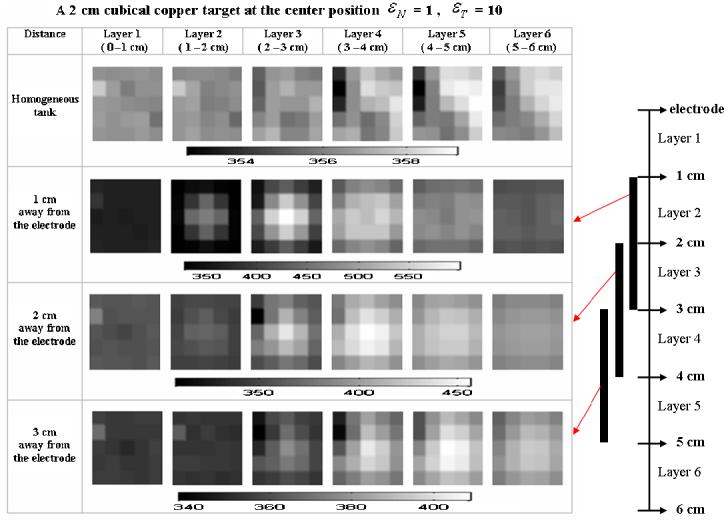
Reconstructed static images.
In the homogeneous case, we still can see the roughness of the reconstructed static image. This might be caused by the inaccurate forward model, variation among the electrodes and noise in the measurements. When a 2 cm cubic copper target is moved further than 2 cm away from the electrode, the signal will get close to the noise level and we will not be able to identify the target clearly. Detecting a 1 cm cubic copper target in the static image will be difficult if it is further than 1 cm away from the electrode array. Using the finer mesh also makes the problem more ill-posed and the static image will not be improved.
4. Discussion and conclusions
The advantage of the handheld probe geometry is the ability to move the probe where it is needed. There is also a theoretical advantage in the ability to increase the number of electrodes and knowing where each is positioned relative to the others. A disadvantage of this geometry is that measurements are made on only one side of the breast at a time. This geometry presents a more ill-posed problem compared to other 3D reconstructions which place electrodes around the boundary. Therefore, the choice of a suitable regularization method and values of the regularization parameters are more significant. In this study, we found the combination of two classic regularizations with a weighted mesh design which provides a satisfactory solution to these requirements.
We have shown that a handheld EIT probe is able to detect objects beneath the electrode array at substantial distances in reconstructed static and difference images using a linearized reconstruction algorithm. Despite the inaccuracies in the array and tank construction and the use of 25 electrodes with a simple electrode model used in this study, we obtained promising experimental results.
Although the detectable depth, the Z direction, is limited by the penetration of the currents, the reconstructed image located the target very well in the X and Y directions. To improve the resolution and quality of the reconstructed images, we plan to expand to 64 electrodes on the array, and improve the electronic signal-to-noise ratio in future work. It is expected that improving the probe construction and modifying the mathematical model to include more precise boundary conditions and incorporating the complete electrode model of Cheng et al (1989) will also improve the results.
One shortcoming of the present study is that it used targets of nearly infinite contrast. The actual results with targets of more realistic contrast ratios would have lower contrast in the reconstruction images, but the other comparisons made in this study would not be expected to change. We anticipate verifying this with agar targets using a 64-electrode handheld probe with our new EIT system ACT 4 (Liu et al 2005) in the near future.
Acknowledgments
This work is supported in part by CenSSIS, the Center for Subsurface Sensing and Imaging Systems, under the Engineering Research Centers Program of the National Science Foundation (award number EEC-9986821) and NIBIB, the National Institute of Biomedical Imaging and Bioengineering under (grant number R01-EB000456-01).
References
- Aberg P, Nicander I, Hansson J, Geladi P, Holmgren U, Ollmar S. Skin cancer identification using multifrequency electrical impedance—a potential screening tool. IEEE Trans. Biomed. Eng. 2004;51:2097–102. doi: 10.1109/TBME.2004.836523. [DOI] [PubMed] [Google Scholar]
- Bagshaw AP, Liston AD, Bayford RH, Tizzard A, Gibson AP, Tidswell AT, Sparkes MK, Dehghani H, Binnie CD, Holder DS. Electrical impedance tomography of human brain function using reconstruction algorithms based on the finite element method. Neuroimage. 2003;20:752–64. doi: 10.1016/S1053-8119(03)00301-X. [DOI] [PubMed] [Google Scholar]
- Blott BH, Daniell GJ, Meeson S. Electrical impedance tomography with compensation for electrode positioning variations. Phys. Med. Biol. 1998;43:1731–9. doi: 10.1088/0031-9155/43/6/025. [DOI] [PubMed] [Google Scholar]
- Cheney M, Isaacson D, Newell JC. Electrical impedance tomography. SIAM Rev. 1999;41:85–101. [Google Scholar]
- Cheney M, Isaacson D, Newell JC, Simske S, Goble J. NOSER: an algorithm for solving the inverse conductivity problem. Int. J. Imaging Syst. Technol. 1990;2:66–75. doi: 10.1002/ima.1850020203. [DOI] [PMC free article] [PubMed] [Google Scholar]
- Cheng K-S, Isaacson D, Newell JC, Gisser DG. Electrode models for electric current computed tomography. IEEE Trans. Biomed. Eng. 1989;36:918–24. doi: 10.1109/10.35300. [DOI] [PMC free article] [PubMed] [Google Scholar]
- Cherepenin V, Karpov A, Korjenevsky A, Kornienko V, Kultiasov Yu, Mazaletskaya A, Mazourov D, Meister D. Preliminary static EIT images of the thorax in health and disease. Physiol. Meas. 2002;23:33–41. doi: 10.1088/0967-3334/23/1/304. [DOI] [PubMed] [Google Scholar]
- Cherepenin V, Karpov A, Korjenevsky A, Kornienko V, Mazaletskaya A, Mazourov D, Meister D. A 3D electrical impedance tomography (EIT) system for breast cancer detection. Physiol. Meas. 2001;22:9–18. doi: 10.1088/0967-3334/22/1/302. [DOI] [PubMed] [Google Scholar]
- Cook RD, Saulnier GJ, Gisser DG, Goble JC, Newell JC, Isaacson D. ACT 3: a high speed high precision electrical impedance tomography. IEEE Trans. Biomed. Eng. 1994;41:713–22. doi: 10.1109/10.310086. [DOI] [PMC free article] [PubMed] [Google Scholar]
- Holder DS. Electrical impedance tomography (EIT) of brain function. Brain Topogr. 1992;5:87–93. doi: 10.1007/BF01129035. [DOI] [PubMed] [Google Scholar]
- Isaacson D. Distinguishability of conductivities by electric current computed tomography. IEEE Trans. Med. Imaging. 1986;5:92–5. doi: 10.1109/TMI.1986.4307752. [DOI] [PubMed] [Google Scholar]
- Kao T-J, Isaacson D, Newell JC, Saulnier GJ. Distinguishability of inhomogeneities using planar electrode arrays and different patterns of applied excitation. Physiol. Meas. 2003;24:403–12. doi: 10.1088/0967-3334/24/2/352. [DOI] [PubMed] [Google Scholar]
- Kerner TE, Paulsen KD, Hartov A, Soho SK, Poplack SP. Electrical impedance spectroscopy of the breast: clinical results in 26 subjects. IEEE Trans. Med. Imaging. 2002;21:638–45. doi: 10.1109/tmi.2002.800606. [DOI] [PubMed] [Google Scholar]
- Kolehmainen V, Vauhkonen M, Karjalainen PA, Kaipio JP. Assessment of errors in static electric impedance tomography with adjacent and trigonometric current patterns. Physiol. Meas. 1997;18:289–303. doi: 10.1088/0967-3334/18/4/003. [DOI] [PubMed] [Google Scholar]
- Lionheart WRB. EIT reconstruction algorithms: pitfalls, challenges and recent developments. Physiol. Meas. 2004;25:125–42. doi: 10.1088/0967-3334/25/1/021. [DOI] [PubMed] [Google Scholar]
- Liu N, Saulnier GJ, Newell JC, Isaacson D, Kao T-J. ACT 4: a high-precision, multi-frequency electrical impedance tomography. Conference on Biomedical Applications of Electrical Impedance Tomography; University College London. 22–24th June.2005. [Google Scholar]
- McEwan A, Yerworth R, Horesh L, Bayford R, Holder DS. Specification and calibration of a multifrequency MEIT system for stroke. Conference on Biomedical Applications of Electrical Impedance Tomography; University College London. 22–24th June.2005. [Google Scholar]
- Mueller JL, Isaacson D, Newell JC. A reconstruction algorithm for electrical impedance tomography data collected on rectangular electrode arrays. IEEE Trans. Biomed. Eng. 1999;46:1379–86. doi: 10.1109/10.797998. [DOI] [PubMed] [Google Scholar]
- Mueller JL, Isaacson D, Newell JC. Reconstruction of conductivity changes due to ventilation and perfusion from EIT data collected on a rectangular electrode array. Physiol. Meas. 2001;22:97–106. doi: 10.1088/0967-3334/22/1/313. [DOI] [PubMed] [Google Scholar]
- Tidswell AT, Gibson AP, Bayford RH, Holder DS. Electrical impedance tomography of human brain activity with a two-dimensional ring of scalp electrodes. Physiol. Meas. 2001;22:167–75. doi: 10.1088/0967-3334/22/1/320. [DOI] [PubMed] [Google Scholar]


