Abstract
Distribution and lateral organization of Kv1.3 potassium channels and CD3 molecules were studied by using electron microscopy, confocal laser scanning microscopy, and fluorescence resonance energy transfer. Immunogold labeling and electron microscopy showed that the distribution of FLAG epitope-tagged Kv1.3 channels (Kv1.3/FLAG) significantly differs from the stochastic Poisson distribution in the plasma membrane of human T lymphoma cells. Confocal laser scanning microscopy images showed that Kv1.3/FLAG channels and CD3 molecules accumulated in largely overlapping membrane areas. The numerical analysis of crosscorrelation of the spatial intensity distributions yielded a high correlation coefficient (C = 0.64). A different hierarchical level of molecular proximity between Kv1.3/FLAG and CD3 proteins was reported by a high fluorescence resonance energy transfer efficiency (E = 51%). These findings implicate that reciprocal regulation of ion-channel activity, membrane potential, and the function of receptor complexes may contribute to the proper functioning of the immunological synapse.
T lymphocytes play a central role in adaptive immunity. The antigen-specific multisubunit T cell antigen receptor (TCR) complex contains a set of noncovalently associated, invariant polypeptides, such as the CD3 complex and the TCRζ chains, which are involved in the transmission of antigenic signals. Efficiency of signal transduction and the outcome of the T cell response are modulated by contribution of coreceptors, adhesion molecules, costimulators, etc. (1).
It has recently been shown that TCR triggering is accompanied by reorganization of cell-surface molecules (TCR/CD3, CD28, CD2, LFA-1) into distinct, characteristic patterns, i.e., the immunological synapse (IS), at the antigen-presenting cell–T cell interface (2, 3). A critical role of the cholesterol- and sphingolipid-based membrane microdomains (lipid rafts) was also reported in the formation of the IS (4). Similarly, the cytokine receptor IL-2Rα that binds the T cell growth factor IL-2 colocalizes with MHC and CD48 molecules in the plasma membrane of T cells (5). Their association pattern depends on the integrity of lipid rafts (6).
Membrane potential and the activity of ion channels also contribute to the generation and propagation of the mitogenic signal in T lymphocytes (7). T lymphocytes express a unique voltage-gated ion channel encoded by the Kv1.3 gene (8). Kv1.3 channels, along with Ca2+-activated K+ channels, determine primarily the cation fluxes and, consequently, the membrane potential of these cells. Kv1.3 blockers depolarize T lymphocytes, thereby diminishing the driving force for the Ca2+ signaling required for T cell proliferation (9). Besides this indirect, permissive effect of membrane potential on Ca2+ signaling, activity of Kv1.3 channels and subsequent membrane potential changes may exert a direct effect on the conformation of membrane proteins (10, 11).
Nonuniform distribution of ligand- and voltage-gated ion channels is crucial for the physiological function of excitable tissues. Selective targeting to functionally different synapses was described for α-amino-3-hydroxy-5-methyl-4-isoxazolepropionic acid-type and N-methyl-d-aspartate-type glutamate receptor subunits within single cells (12, 13). The lateral distribution of fluorescently labeled voltage-gated NaV1.6 Na+ channels and voltage-gated Kv1.2 K+ channels in myelinated nerve fibers showed that NaV1.6 channels are concentrated in the node of Ranvier, whereas Kv1.2 and other Kv channels cluster in the juxtaparanodal region, still close to the node (14).
Interestingly, nonrandom distribution of ion channels and their colocalization with membrane proteins were also described in nonexcitable tissues. Voltage-gated K+ channels show differential targeting to membrane microdomains in mouse L cells. Kv2.1 and Kv1.5 are targeted to noncaveolar and caveolar lipid rafts, respectively, whereas Kv4.2 channels are excluded from the rafts (15, 16). Molecular proximity between Kv1.3 channels and β1-integrins was described in the plasma membrane of melanoma cells. The physical association of the molecules was adherence-related, and the regulation of integrin function by association with Kv1.3 channels was suggested (17).
Given this knowledge of the importance of molecular clustering of the receptors involved in T cell signaling, the critical role of Kv1.3 channels and membrane potential in lymphocyte activation, and the inhomogeneity in the localization of ion channels in the plasma membrane, the investigation of the topological and functional relationship between them is an interesting target. This article deals with the spatial distribution of potassium channels in the plasma membrane of Jurkat cells and their clustering with the TCR/CD3 complex at different distance resolutions provided by electron microscopy, confocal laser scanning microscopy (CLSM), and fluorescence resonance energy transfer (FRET). Our results quantitatively describe a nonrandom distribution of epitope-tagged/colloidal gold-labeled Kv1.3 channels in the plasma membrane of Jurkat cells and significant colocalization of Kv1.3 and CD3 in CLSM images. In addition to microscopic colocalization, FRET measurements indicate molecular proximity between fluorescently labeled Kv1.3 and CD3.
Materials and Methods
Molecular Biology.
The FLAG epitope (DYKDDDDK) was cloned into the pRc/CMV/Kv1.3 gene (gift from C. Deutsch, University of Pennsylvania, Philadelphia) by using the QuikChange PCR mutagenesis system (Stratagene). Twenty-one base pairs were inserted into the coding sequence of the extracellular loop connecting the S1 and S2 transmembrane segments at position 220. D220 of the original coding sequence was designed to be the first amino acid of the FLAG epitope. The insertion mutation was confirmed by restriction enzyme digestion (AatII) and DNA sequence analysis.
Transfection of Jurkat Cells.
Jurkat TagC15 cells were cultured in suspension in RPMI medium 1640 (GIBCO) supplemented with 10% (vol/vol) FCS/50 mg/liter gentamicin/2 mM l-glutamine. The cells were passaged every 2–3 days to maintain a cell concentration <1 × 10⁶ per ml. Twenty-four hours before transfection, cells were transferred to fresh media and collected in the logarithmic phase of growth. Cells were transfected by using Effectene reagent (Qiagen, Valencia, CA) at a ratio of 1 μg of DNA per 25 μl of reagent in 5.2 ml of reaction volume containing 4 × 10⁶ cells in 60-mm Petri dishes. Cells were cultured for 24 h before immunogold or fluorescence assays.
Transfection of Cytotoxic Murine T (CTLL-2) Cells.
CTLL-2 cells were transiently cotransfected with plasmids encoding the WT (Kv1.3/WT) or mutant (Kv1.3/FLAG) Kv1.3 channels, along with a Ccd4neo plasmid (5.0 kb; pUC-based plasmid with a cytomegalovirus promoter driving human membrane-surface CD4) at a 5:1 ratio using electroporation (18).
Cell Preparation for Electrophysiology.
CTLL-2 cells were collected from culture and incubated with monoclonal mouse anti-human CD4 antibody (AMAC, Westbrook, ME; 0.5 mg per 106 cells) and adhered to 35-mm Petri dishes coated with goat anti-mouse IgG (BioSource International, Camarillo, CA), as described (19). Dishes were washed gently five times with 1 ml of normal extracellular bath medium to remove nonadherent cells.
Current Recording.
Whole-cell measurements were carried out by using an Axopatch 200A amplifier connected to a personal computer using Digidata 1200 (Axon Instruments, Foster City, CA) data acquisition hardware (20, 21). For data acquisition and analysis, the PCLAMP8 software package (Axon Instruments) was used. Standard whole-cell patch-clamp techniques were used. Series resistance compensation up to 85% was used to minimize voltage errors and achieve good voltage-clamp conditions. Pipettes were pulled from GC 150 F-15 borosilicate glass capillaries in two stages and fire polished, resulting in electrodes having 2–3 MΩ resistance in the bath. The bath solution was 145 mM NaCl/5 mM KCl/1 mM MgCl2/2.5 mM CaCl2/5.5 mM glucose/10 mM Hepes, pH 7.35. The internal solution consisted of 140 mM KF/2 mM MgCl2/1 mM CaCl2/10 mM Hepes/11 mM EGTA.
Immunogold Labeling.
Transfected cells were washed twice with Hanks' solution and labeled with anti-FLAG M2 primary antibody (mouse anti-human, Sigma, Budapest) on ice for 40 min. The cell suspension was washed twice and labeled with polyclonal secondary antibodies conjugated to 10- or 30-nm gold beads (AuroProbe EM 10 nm and AuroProbe EM 30 nm, Amersham Pharmacia). Cells were fixed with 1% (wt/vol) paraformaldehyde (for 1 h) and 2% (vol/vol) glutaraldehyde in 0.1 M Sorensen's buffer at pH 7.2 (overnight) and prepared for transmission electron microscopy (TEM) as described (5, 22).
FRET Measurements and Data Analysis.
The molecular proximity (relative distances) of CD3 receptors and Kv1.3 ion channels was studied by FRET, as described (11, 23). Kv1.3 K+ channels were labeled at their FLAG epitopes with monoclonal anti-FLAG antibodies followed by staining with a mixture of 90–95% fluorescein-conjugated and 5–10% Cy5-conjugated polyclonal rabbit anti-mouse IgG (RAMIG, Sigma). Fluorescein was used as a FRET donor, and Cy5-RAMIG served as a marker of the transfected cells. Using Cy5, rather than fluorescein, for the selection of Kv1.3/FLAG+ cells was necessary because cellular autofluorescence was significantly lower in the detection region of the Cy5 dye (661 ± 8 nm) than in the fluorescein channel (530 ± 15 nm). CD3 receptors were labeled with monoclonal anti-CD3 antibody (MEM 57 monoclonal antibodies, a gift from V. Horejsi, Institute of Molecular Genetics, Prague) marked with Cy3, which served as FRET acceptor. The fluorescence intensities from fluorescein and Cy5 markers on the donor-only and donor–acceptor-labeled cells were measured in a Becton Dickinson FACSCalibur flow cytometer with excitation at 488 and 635 nm, respectively. Kv1.3/FLAG+ cells were selected by gating on the top 15% of cells according to the Cy5 intensity. The mean FRET efficiency in the Kv1.3/FLAG+ cell population was determined from the decrease of the fluorescence intensity of the donor according to:
 |
1 |
where FD and FDA are the background-corrected mean fluorescence intensities of the donor-only and donor–acceptor-labeled cells, respectively. The background intensity (B) was determined by using cells incubated with fluorescein-RAMIG and Cy5-RAMIG, but without adding primary anti-FLAG antibody. Flow cytometric data analysis was carried out by using custom-made software (ϕFLEX).
CLSM.
Spatial organization of CD3 and Kv1.3 ion channels in the plasma membrane of Jurkat cells was also studied by means of CLSM (Zeiss LSM 510). Cells labeled with Alexa Fluor 633-tagged anti-CD3 antibody (UCHT-1) and anti-FLAG followed by Alexa Fluor 546-tagged (Molecular Probes) RAMIG (Sigma) were allowed to adhere to polylysine-coated coverslips. Experiments also were performed with the antibody pair Cy3-anti-CD3 (MEM 57) and anti-FLAG followed by fluorescein-tagged RAMIG. Mowiol (Calbiochem) was added to the samples before mounting on slides to reduce photobleaching. For the excitation of fluorescein, the 488-nm line of an Ar ion laser was used; for Cy3 or Alexa Fluor 546, a 543-nm HeNe laser was used; and for Alexa Fluor 633, a 633-nm HeNe laser was used. Fluorescence was detected through 505- to 550-nm bandpass, 560- to 615-nm bandpass, and >650-nm long-pass filters, respectively. The “Multi Track” option of the microscope was used, scanning each laser line separately for the individual excitation of the dyes, to exclude crosstalk between detection channels. With a Plan-Apochromat ×63 oil immersion objective (numerical aperture 1.4, Zeiss), image stacks with 0.6-μm thick optical slices were collected. Any shift between the images recorded in the different detection channels was corrected by shifting the images by a few pixels to attain maximal overlap (5).
Correlation Analysis of Protein Colocalization.
Projection images were produced from two to three optical slices recorded from the top or bottom of double-labeled cells. The colocalization of CD3 and Kv1.3 molecules was evaluated by calculating the crosscorrelation between the pixel intensities of image pairs x and y recorded from the double-labeled cells according to
 |
2 |
where C is the correlation coefficient, xij and yij are the fluorescence signal levels at individual pixels in images x and y with pixel coordinates i and j, and 〈x〉 and 〈y〉 are mean pixel intensities in the respective images (5). In the summation, all pixels inside the investigated cells were included. Crosscorrelation of images was calculated by a program written by G. Vereb in LABVIEW (National Instruments, Austin, TX; ref. 5).
Results
Functional Expression of Kvl.3/FLAG Channels and the FLAG Epitope.
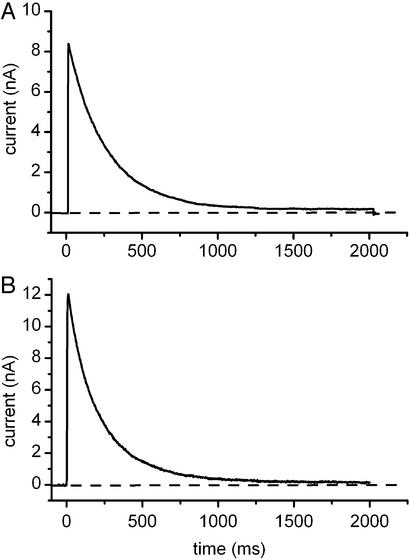
Fig. 1. shows representative current traces recorded in CTLL-2 cells, which lack endogenous voltage-gated ion channels transfected with either Kv1.3/WT or Kv1.3/FLAG channels. Currents were evoked by depolarization to +50 mV from a holding potential of −120 mV. The figure shows that time-dependent gating of Kv1.3/FLAG channels is very similar to that of the Kv1.3/WT: in both Fig. 1 A and B, the rising phase of current (activation) is very fast, followed by a relatively slow inactivation phase. Inactivation time constants were determined from fitting a single exponential function to the decaying part of the currents. There was no significant difference between the relaxation kinetics of the K+ currents of Kvl.3/FLAG and Kvl.3/WT channels (P = 0.05).
Figure 1.
Functional expression of Kv1.3/FLAG channels. CTLL-2 cells were transfected with either Kv1.3/WT (A) or Kv1.3/FLAG (B); channels and currents were recorded in the whole-cell configuration of the patch-clamp. Holding potential was −120 mV, and test potential was +50 mV. Inactivation time constants were determined from fitting a single exponential function to the decaying part of the currents. The resulting time constants were 234.6 and 214.6 ms for the Kv1.3 WT and Kv1.3/FLAG-transfected cells, respectively.
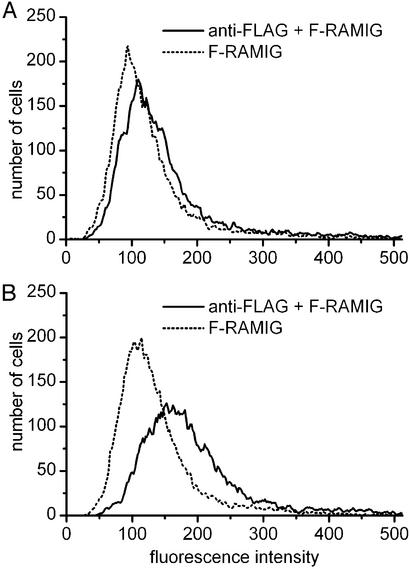
Fig. 2 shows that Jurkat cells transfected with Kv1.3/FLAG channels are labeled specifically with antibodies directed against the FLAG epitope. The overlapping fluorescence histograms in Fig. 2A indicate that no specific labeling is achieved in Jurkat cells transfected with Kv1.3/WT channels and labeled with anti-FLAG primary and fluorescein-conjugated secondary antibodies. Under identical conditions, Kv1.3/FLAG channels can be labeled specifically (Fig. 2B), as indicated by the right shift of the fluorescence histogram of the double-labeled sample, as compared with background (secondary antibody only).
Figure 2.
Specific labeling of the FLAG epitope. Jurkat cells were transfected with either Kv1.3/WT (A) or Kv1.3/FLAG (B) channels. Cells were labeled by anti-FLAG primary and fluorescein-conjugated RAMIG secondary antibodies. Flow cytometric histograms show specific labeling of the FLAG epitope.
Homoassociation of Kv1.3 Channels.
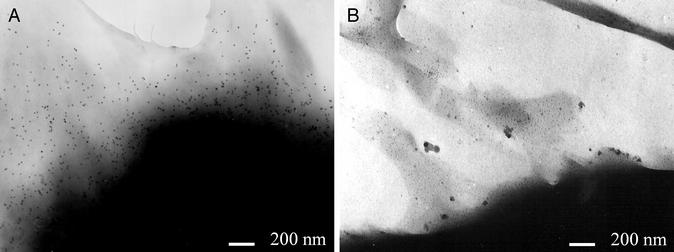
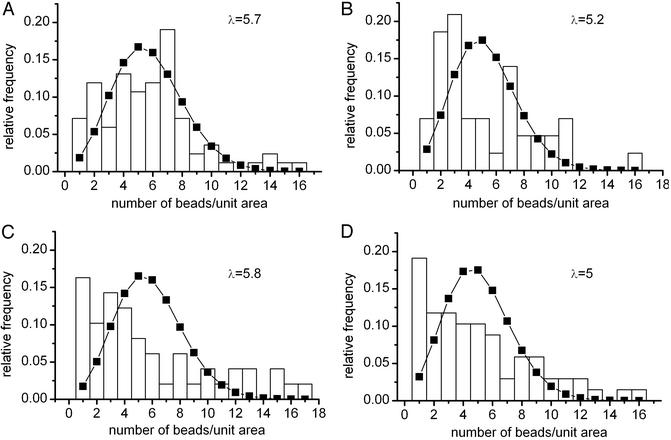
Comparison of Fig. 3 A and B shows that, similarly to fluorescence labeling, immunogold labeling of Kv1.3/FLAG channels at the FLAG epitope is also specific because TEM pictures do not show gold beads on the surface of Jurkat cells transfected with WT channels (Fig. 3B). Statistical analysis of the distribution of the Kvl.3/FLAG channels was based on the number of gold beads per unit area of the membrane. A suitable grid was superimposed on the digitized photographs, and frequency histograms were created based on the number of areas containing a given number of gold bead-labeled K+ channels (Fig. 4). The grid size was adjusted to result in an average density of approximately five beads per unit area. Assuming a random distribution of the labeled channels in the membrane, the frequency histograms shown in Fig. 4 should follow a Poisson distribution with parameter λ, the average number of beads per area. On the contrary, the panels show a significant deviation from the theoretical Poisson distributions. The statistical analysis of the bead distributions obtained at different grid sizes ranging from 30 × 30 pixels to 150 × 150 pixels gave similar results (data not shown).
Figure 3.
Labeling of the FLAG epitope using gold beads. Jurkat cells were transfected with either Kv1.3/FLAG (A) or Kv1.3/WT (B) channels. Cells were labeled by anti-FLAG primary and gold bead-conjugated (10 nm) goat anti-mouse IgG secondary antibodies. TEM pictures were taken as described in Materials and Methods. (Bars = 200 nm.)
Figure 4.
Statistical analysis of the distribution of the gold bead-labeled Kv1.3/FLAG channels. TEM pictures were digitized, and custom-made software was used to determine the pixel coordinates of the gold beads. Grids (120 × 120 pixels) were superimposed on the picture, and the number of beads per grid element was determined. Frequency histograms were generated (four cells are shown), and the corresponding Poisson distributions (squares) were superimposed on the histograms (λ, the average number of beads per unit area, is shown in each panel). χ2 tests indicate that the observed distributions are significantly different from the stochastic Poisson distributions (P < 0.05).
Colocalization of CD3 and Kv1.3/FLAG Potassium Channels.
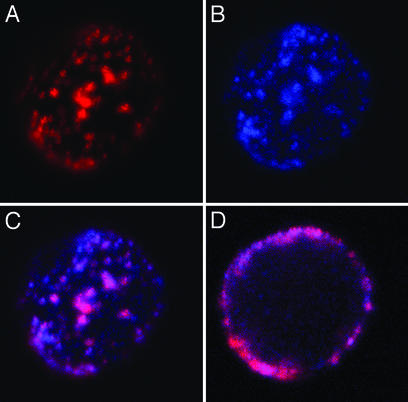
Fig. 5D shows a CLSM image of a Kvl.3/FLAG-transfected Jurkat cell in a cross section recorded in the middle of the cell. The channels were specifically labeled with anti-FLAG M2 primary and Alexa Fluor 546-tagged RAMIG secondary antibodies. These constructs are shown in red. The putative neighbors, the CD3 molecules, were labeled with anti-CD3 monoclonal antibodies that have been conjugated to Alexa Fluor 633 and are shown in blue. The magenta means colocalization of the Kv1.3 channels and the CD3 in the plasma membrane at the resolution power of the CLSM. The crosscorrelation coefficient, a quantitative measure of colocalization, was calculated from the images recorded from the individual dyes (for individual signals, see Fig. 5 A and B; for fusion image of the two signals, see Fig. 5C; for details, see Materials and Methods). The numerical analysis of crosscorrelation of the spatial intensity distributions yielded a fairly high correlation coefficient: C = 0.64 ± 0.10 (SD), n = 6. This high correlation coefficient is numerical evidence for the colocalization of the two proteins on a scale of a few hundred nanometers.
Figure 5.
Confocal images showing the colocalization of CD3 and Kv1.3/FLAG channels. Kv1.3/FLAG-transfected Jurkat cells were labeled with anti-FLAG M2 followed by Alexa Fluor 546-tagged RAMIG (red) and Alexa Fluor 633-tagged anti-CD3 (blue). The 543- and 633-nm lines of HeNe lasers were used for excitation. Fluorescence signals were detected through 560- to 615-nm bandpass and 650-nm long-pass filters, respectively. (A and B) The Kv1.3/FLAG (red) and CD3 (blue) signals of a cell in projection images created from three coverslip proximal optical slices. (C) The fusion image of the two signals after correction for pixel shift (see Materials and Methods). The lateral dimension of the image is 18.3 μm. The crosscorrelation coefficient calculated according to Eq. 2 is C = 0.745 for this cell. (D) Fluorescence signals detected from a cross section of the cell recorded around the equator. The z axis resolution of the image is 0.6 μm.
Molecular Proximity of CD3 Molecules and Kv1.3/FLAG Potassium Channels.
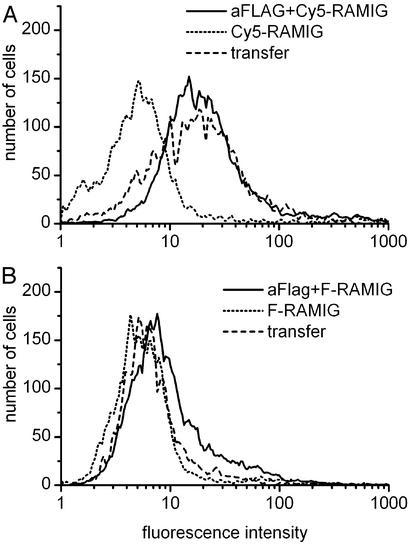
FRET efficiency between fluorescein-labeled Kv1.3 and Cy3-labeled CD3 was determined from the decrease of fluorescence intensity of the fluorescein donor. In Fig. 6B, the fluorescence-intensity histograms of the donor–acceptor-labeled (anti-FLAG + F-RAMIG + Cy3-anti-CD3), donor-only-labeled (anti-FLAG + F-RAMIG), and nonspecifically labeled (F-RAMIG) cells are shown. The histogram of the double-labeled sample is shifted to the left, compared with the donor-only sample. Because the efficiency of transfection was only ≈5–10%, it was necessary to select Kv1.3+ cells from the total population for the numerical FRET analysis. The top 15% of Cy5-RAMIG (FL-4) histograms were gated (Fig. 6A), and the donor fluorescence intensities (FL-1) were determined only for this subpopulation. The mean FRET efficiency determined according to Eq. 1 is E = 51 ± 29% (n = 3).
Figure 6.
Energy transfer between labeled CD3 and Kv1.3/FLAG channels. Kv1.3/FLAG-transfected Jurkat cells were labeled at their FLAG epitopes with monoclonal anti-FLAG antibodies followed by staining with a mixture of 90% fluorescein-conjugated and 10% Cy5-conjugated polyclonal RAMIG. For energy transfer measurements, the CD3 receptors were also labeled by using Cy3-tagged monoclonal anti-CD3, which served as FRET acceptor. For the calculation of FRET efficiency, see the main text. (A) Fluorescence signals detected in the Cy5 channel (FL-4) from cells labeled with Cy5-RAMIG/fluorescein-RAMIG (dotted line), anti-FLAG+Cy5-RAMIG/fluorescein-RAMIG (solid line), or anti-FLAG+Cy5-RAMIG/fluorescein-RAMIG+Cy3-anti-CD3 (dashed line, transfer). (B) Fluorescence signals detected in the fluorescein channel (FL-1) from cells labeled with Cy5-RAMIG/fluorescein-RAMIG (dotted line), anti-FLAG+Cy5-RAMIG/fluorescein-RAMIG (solid line), or anti-FLAG+Cy5-RAMIG/fluorescein-RAMIG+Cy3-anti-CD3 (dashed line, transfer). From the decrease of the donor fluorescence intensity in the donor–acceptor-labeled sample, a FRET efficiency of E = 51 ± 29% (SD) was calculated (n = 3).
Discussion
Based on the fluid-mosaic membrane model, integral membrane proteins freely diffuse in a liquid lipid bilayer and distribute randomly. On the contrary, nonrandom distribution of ion channels and other membrane proteins in the plasma membrane of different cells has been reported recently (5, 17, 24). In this article, we analyzed the distribution of colloidal gold-tagged Kv1.3/FLAG channels in the membrane of Jurkat cells and concluded that the observed distribution significantly deviates from the stochastic Poisson distribution.
At least two mechanisms should be considered to explain nonrandom distribution of membrane proteins, including ion channels. The first scenario is the association of ion channels to specialized microdomains in the plasma membrane commonly referred to as lipid rafts. Lipid rafts accommodate several receptor and protein kinase molecules required for T lymphocyte activation, including the TCR/CD3 complex, the Src-family tyrosine kinase LCK, CD28, and CD4 (reviewed in ref. 25). The IL-2 receptor, which provides a stimulatory signal for T cell proliferation, also localizes in lipid rafts (5, 6). Recent experiments showed that Kv1.5 and Kv2.1 voltage-gated potassium channels are targeted to lipid rafts as well. Moreover, the biophysical properties of both of these channels were sensitive to the integrity of the rafts (15, 16). The biophysical parameters of Kv1.3 gating were also modulated by modification of the cholesterol content of human peripheral blood lymphocytes by using cyclodextrin derivatives (26). These findings raise the possibility of raft association of these channels as well and might explain our experimental findings.
A second scenario for generation of nonrandom distribution of ion channels is governed by direct protein–protein interactions. Channels can be clustered by interacting with the extracellular matrix, as in case of voltage-gated Na+ channels (27), and/or by anchoring the channels to cytoskeletal elements. For example, multivalent PDZ domain-containing proteins cluster voltage-gated Kv1.4 channels in HEK cells (28). The C terminus of Kv1.3 channels contains the PDZ domain-binding consensus sequence, which interacts with PSD-95 in neuronal cells (29). Thus, cytoskeletal anchoring may also contribute to the nonrandom distribution of Kv1.3 channels observed in this study.
Nonrandom distribution of the TCR/CD3 complex, its targeting to lipid rafts, and dynamic rearrangement in the T cell membrane during the formation of the immunological synapse have already been described (25). Herewith, we present evidence proving molecular proximity between an integral component of the TCR complex, CD3, and Kv1.3 channels in Jurkat cells. Several methods with different resolution power are available to study the spatial distribution and molecular association of labeled molecules in the plasma membrane of cells. Transfection of Jurkat cells with epitope-tagged Kv1.3 increased the density of the channels in the membrane to a degree where specific labeling provided sufficient signal for FRET and CLSM measurements. Detailed characterization of the expression of transfected channels in Jurkat cells showed that endogenous Kv1.3 channels and transfected mutant ones use a common pathway for cell surface expression (21). The applied techniques report on the distribution of membrane proteins at two different hierarchical levels. CLSM resolves fluorescently labeled species on a scale from 0.2 to several micrometers (30) and allows us to detect codistribution of proteins within this distance range (5). On the other hand, the detection range of the FRET method is a donor–acceptor distance of 2–10 nm (23); therefore, FRET can report on close vicinity or molecular association of the labeled proteins. The colocalization of the Kvl.3 K+ channels with the CD3 complex was indicated by both methods. According to CLSM images, the two proteins are accumulated in largely overlapping membrane areas; the high correlation coefficient of the intensities shows nearly proportional local expression levels. The high FRET efficiency between Kv1.3/FLAG and CD3 is indisputable evidence for their molecular proximity. Because of the variability in the expression level of the transfected ion channel and the consequent uncertainty in the selection of the Kv1.3 positive subpopulation, the numerical value of E is a rough estimate only and cannot be converted to actual intermolecular distances.
The colocalization of the Kv1.3 and CD3 proteins observed at different hierarchical levels raises the possibility of a functional relationship between them. Engagement of the TCR by the MHC/peptide complex stimulates nonreceptor protein tyrosine kinases of the Src, Syk, and Tec families, which in turn activate/control the phosphatidyl inositol metabolism. The latter one plays an important role in the regulation of intracellular Ca2+ as well as the activity of different serine/threonine kinases, such as protein kinase C (PKC) isoenzymes (1). Several lines of evidence suggest protein kinase involvement in TCR/CD3 signaling; e.g., LCK and PKC regulate the biophysical properties and physiological functions of Kv1.3 channels (31, 32). It is intriguing to imagine that an activation process of the TCR/CD3 complex may induce a change in the activity of a nearby ion channel, or vice versa, a change in ion currents and membrane potential may influence the recognition processes and subsequent functions of the immunological synapse.
Acknowledgments
This work was supported by Egészségügyi Tudományos Tanács (Ministry of Public Health and Welfare) Grants T05/102/2000, T05/460/2000, 010/2001, 013/2001, and 117/2001; Országos Tudományos Kutatási Alapprogramok (Hungarian National Scientific Research Fund) Grants T029947, F035251, F034487, T030411, T42618, T043087, and T043509; Felsõoktatási Kutatási és Fejlesztési Pályázat (Higher Education Research Fund) Grants 327/2000 and 622/2002; and a Bolyai Fellowship (to G.V.).
Abbreviations
- TCR
T cell antigen receptor
- FRET
fluorescence resonance energy transfer
- CLSM
confocal laser scanning microscopy
- RAMIG
rabbit anti-mouse IgG
References
- 1.Acuto O, Cantrell D. Annu Rev Immunol. 2000;18:165–184. doi: 10.1146/annurev.immunol.18.1.165. [DOI] [PubMed] [Google Scholar]
- 2.Grakoui A, Bromley S K, Sumen C, Davis M M, Shaw A S, Allen P M, Dustin M L. Science. 1999;285:221–227. [PubMed] [Google Scholar]
- 3.van der Merwe P A. Curr Opin Immunol. 2002;14:293–298. doi: 10.1016/s0952-7915(02)00350-3. [DOI] [PubMed] [Google Scholar]
- 4.Bromley S K, Burack W R, Johnson K G, Somersalo K, Sims T N, Sumen C, Davis M M, Shaw A S, Allen P M, Dustin M L. Annu Rev Immunol. 2001;19:375–396. doi: 10.1146/annurev.immunol.19.1.375. [DOI] [PubMed] [Google Scholar]
- 5.Vereb G, Matkó J, Vámosi G, Ibrahim S M, Magyar E, Varga S, Szöllösi J, Jenei A, Gáspár R, Jr, Waldmann T A, Damjanovich S. Proc Natl Acad Sci USA. 2000;97:6013–6018. doi: 10.1073/pnas.97.11.6013. [DOI] [PMC free article] [PubMed] [Google Scholar]
- 6.Matko J, Bodnar A, Vereb G, Bene L, Vamosi G, Szentesi G, Szollosi J, Gaspar R, Horejsi V, Waldmann T A, Damjanovich S. Eur J Biochem. 2002;269:1199–1208. doi: 10.1046/j.0014-2956.2002.02759.x. [DOI] [PubMed] [Google Scholar]
- 7.Cahalan M D, Chandy K G. Curr Opin Biotechnol. 1997;8:749–756. doi: 10.1016/s0958-1669(97)80130-9. [DOI] [PubMed] [Google Scholar]
- 8.Douglass J, Osborne P B, Cai Y C, Wilkinson M, Christie M J, Adelman J P. J Immunol. 1990;144:4841–4850. [PubMed] [Google Scholar]
- 9.Lin C S, Boltz R C, Blake J T, Nguyen M, Talento A, Fischer P A, Springer M S, Sigal N H, Slaughter R S, Garcia M L, et al. J Exp Med. 1993;177:637–645. doi: 10.1084/jem.177.3.637. [DOI] [PMC free article] [PubMed] [Google Scholar]
- 10.Bene L, Szollosi J, Balazs M, Matyus L, Gaspar R, Ameloot M, Dale R E, Damjanovich S. Cytometry. 1997;27:353–357. [PubMed] [Google Scholar]
- 11.Damjanovich S, Gaspar R, Jr, Pieri C. Q Rev Biophys. 1997;30:67–106. doi: 10.1017/s0033583596003307. [DOI] [PubMed] [Google Scholar]
- 12.Nusser Z, Lujan R, Laube G, Roberts J D, Molnar E, Somogyi P. Neuron. 1998;21:545–559. doi: 10.1016/s0896-6273(00)80565-6. [DOI] [PubMed] [Google Scholar]
- 13.Fritschy J M, Weinmann O, Wenzel A, Benke D. J Comp Neurol. 1998;390:194–210. [PubMed] [Google Scholar]
- 14.Rasband M N, Shrager P. J Physiol (London) 2000;525:63–73. doi: 10.1111/j.1469-7793.2000.00063.x. [DOI] [PMC free article] [PubMed] [Google Scholar]
- 15.Martens J R, Navarro-Polanco R, Coppock E A, Nishiyama A, Parshley L, Grobaski T D, Tamkun M M. J Biol Chem. 2000;275:7443–7446. doi: 10.1074/jbc.275.11.7443. [DOI] [PubMed] [Google Scholar]
- 16.Martens J R, Sakamoto N, Sullivan S A, Grobaski T D, Tamkun M M. J Biol Chem. 2001;276:8409–8414. doi: 10.1074/jbc.M009948200. [DOI] [PubMed] [Google Scholar]
- 17.Artym V V, Petty H R. J Gen Physiol. 2002;120:29–38. doi: 10.1085/jgp.20028607. [DOI] [PMC free article] [PubMed] [Google Scholar]
- 18.Panyi G, Sheng Z-F, Tu L-W, Deutsch C. Biophys J. 1995;69:896–904. doi: 10.1016/S0006-3495(95)79963-5. [DOI] [PMC free article] [PubMed] [Google Scholar]
- 19.Deutsch C, Chen L-Q. Proc Natl Acad Sci USA. 1993;90:10036–10040. doi: 10.1073/pnas.90.21.10036. [DOI] [PMC free article] [PubMed] [Google Scholar]
- 20.Hamill O P, Marty A, Neher E, Sakmann B, Sigworth F J. Pflügers Arch. 1981;391:85–100. doi: 10.1007/BF00656997. [DOI] [PubMed] [Google Scholar]
- 21.Panyi G, Deutsch C. J Gen Physiol. 1996;107:409–420. doi: 10.1085/jgp.107.3.409. [DOI] [PMC free article] [PubMed] [Google Scholar]
- 22.Jenei A, Varga S, Bene L, Matyus L, Bodnar A, Bacso Z, Pieri C, Gaspar R J, Farkas T, Damjanovich S. Proc Natl Acad Sci USA. 1997;94:7269–7274. doi: 10.1073/pnas.94.14.7269. [DOI] [PMC free article] [PubMed] [Google Scholar]
- 23.Matkó J, Szöllösi J, Trón L, Damjanovich S. Q Rev Biophys. 1988;21:479–544. doi: 10.1017/s0033583500004637. [DOI] [PubMed] [Google Scholar]
- 24.Damjanovich S, Vereb G, Schaper A, Jenei A, Matko J, Starink J P, Fox G Q, Arndt-Jovin D J, Jovin T M. Proc Natl Acad Sci USA. 1995;92:1122–1126. doi: 10.1073/pnas.92.4.1122. [DOI] [PMC free article] [PubMed] [Google Scholar]
- 25.Janes P W, Ley S C, Magee A I, Kabouridis P S. Semin Immunol. 2000;12:23–34. doi: 10.1006/smim.2000.0204. [DOI] [PubMed] [Google Scholar]
- 26. Hajdú, P., Panyi, G., Varga, Z., Pieri, C. & Gaspar, R. J. (2002) Pflügers Arch., in press. [DOI] [PubMed]
- 27.Novakovic S D, Eglen R M, Hunter J C. Trends Neurosci. 2001;24:473–478. doi: 10.1016/s0166-2236(00)01884-1. [DOI] [PubMed] [Google Scholar]
- 28.Burke N A, Takimoto K, Li D, Han W, Watkins S C, Levitan E S. J Gen Physiol. 1999;113:71–80. doi: 10.1085/jgp.113.1.71. [DOI] [PMC free article] [PubMed] [Google Scholar]
- 29.Kim E, Niethammer M, Rothschild A, Jan Y N, Sheng M. Nature. 1995;378:85–88. doi: 10.1038/378085a0. [DOI] [PubMed] [Google Scholar]
- 30.Nagy P, Matyus L, Jenei A, Panyi G, Varga S, Matkó J, Szollosi J, Gaspar R, Jr, Jovin T M, Damjanovich S. J Cell Sci. 2001;114:4063–4071. doi: 10.1242/jcs.114.22.4063. [DOI] [PubMed] [Google Scholar]
- 31.Szabo I, Gulbins E, Apfel H, Zhang X, Barth P, Busch A E, Schlottmann K, Pongs O, Lang F. J Biol Chem. 1996;271:20465–20469. doi: 10.1074/jbc.271.34.20465. [DOI] [PubMed] [Google Scholar]
- 32.Chung I, Schlichter L C. J Membr Biol. 1997;156:73–85. doi: 10.1007/s002329900189. [DOI] [PubMed] [Google Scholar]


