Abstract
Systemic lupus erythematosus (SLE) is a complex, inflammatory autoimmune disease that affects multiple organ systems. We used global gene expression profiling of peripheral blood mononuclear cells to identify distinct patterns of gene expression that distinguish most SLE patients from healthy controls. Strikingly, about half of the patients studied showed dysregulated expression of genes in the IFN pathway. Furthermore, this IFN gene expression “signature” served as a marker for more severe disease involving the kidneys, hematopoetic cells, and/or the central nervous system. These results provide insights into the genetic pathways underlying SLE, and identify a subgroup of patients who may benefit from therapies targeting the IFN pathway.
Systemic lupus erythematosus (SLE) is a chronic, inflammatory autoimmune disease characterized by the production of antibodies with specificity for a wide range of self-antigens (1). SLE autoantibodies mediate organ damage by directly binding to host tissues and by forming immune complexes that deposit in vascular tissues and activate cells of the immune system. Organs commonly targeted in SLE include the skin, kidneys, joints, lungs, various blood elements, and the central nervous system (CNS). The severity of disease, the spectrum of clinical involvement, and the response to therapy vary widely between patients, and this leads to significant challenges in the diagnosis and management of lupus.
Genes implicated in human SLE include HLA Class II DRB and DQB alleles (e.g., DRB1*1501/DQB1*0602, and DRB1*0301/DQB1*0201) (2), and early components of the complement cascade (e.g., C1q, C4) (3). Gene mapping efforts in families enriched for SLE have identified several additional susceptibility loci (4, 5); however, the relevant genes are not yet isolated. Studies in lupus-prone mice have also identified a number of candidate loci, genes, and pathways that contribute to SLE-like autoimmunity (5, 6). Together, these studies suggest that SLE is a complex genetic disease with multiple genes influencing the clinical phenotype.
Genome-wide gene expression profiling using microarrays is a powerful emerging technology that allows the simultaneous measurement of thousands of mRNA transcripts in a biologic sample (7). This approach has been applied successfully to the classification and prediction of outcome of human malignancies (e.g., lymphoma, leukemia, melanoma, breast, colon, and prostate carcinoma), and to the identification of genes and pathways dysregulated in diseased human tissues (8, 9). In this study we explore the hypothesis that gene expression profiling of peripheral blood mononuclear cells (PBMCs), which are comprised of monocytes/macrophages, B and T lymphocytes, and natural killer cells, may provide new insights into the pathophysiology of SLE.
Materials and Methods
Study Participants.
After informed consent, patients provided a peripheral blood sample, and plasma and PBMCs were isolated from whole blood in CPT tubes (Becton–Dickinson). All SLE patients enrolled had physician-verified SLE, and the disease was relatively quiescent in most (e.g., no patients were hospitalized at the time of blood draw). The medication profiles were as follows: 25 of 48 taking Plaquenil, either 200 or 400 mg per day; 30 of 48 taking prednisone, average dose 7.5 mg per day; and 14 of 48 using another secondary agent [cyclophosphamide (n = 1), methotrexate (n = 5), azathioprine (n = 5), cyclosporine (n = 1), 6-mercaptopurine (n = 1), and mycophenolate mofetil (n = 1)]. For additional clinical information, see Table 1, which is published as supporting information on the PNAS web site, www.pnas.org.
Sample Processing and Chip Hybridization.
RNA was extracted by using a FastTrack kit (Invitrogen), or Trizol (GIBCO/BRL, Invitrogen, Carlsbad, CA) followed by RNeasy cleanup (Qiagen, Valencia, CA). Five to 10 μg of total RNA or 100–200 ng of poly(A) RNA was used to prepare biotinylated cRNA for hybridization using the standard Affymetrix protocol (Expression Analysis Technical Manual, Affymetrix). Fifteen micrograms of each labeled cRNA was used for hybridization.
Data Processing.
After scanning the array, Affymetrix Microarray Suite (MAS) 4.0 software was used to generate expression values (referred to as an “average difference,” or AD) for each gene. Each chip was scaled to an overall intensity of 1,500 to correct for minor differences in overall chip hybridization intensity, and to allow comparison between chips. A threshold of 20 AD units was assigned to any gene that was called “Absent” by MAS. Furthermore, any gene with an AD less than 20 was also assigned this threshold. Many genes in PBMCs were found to undergo significant stress responses during ex vivo handling of samples, i.e., from the time of blood draw through PBMC isolation (E.C.B. F.M.B., P.K.G., and T.W.B., unpublished data). We excluded from the current analysis 2,076 genes that were found to exhibit this high level variability. Of the 10,260 total genes represented on the chips, 3,618 were not expressed in PBMCs, leaving 4,566 genes for the current analysis. Please see Supporting Text, which is published as supporting information on the PNAS web site, for additional details concerning data processing.
Comparison Analyses and Hierarchical Clustering.
The individual gene expression levels of SLE patients and controls were compared by using an unpaired Student's t test. We selected for further analyses 161 genes that met the following criteria: (i) change in expression of at least 1.5-fold when comparing the means of the two groups; (ii) difference in expression of at least 100 AD units when comparing the means of the two groups; and (iii) P < 0.001 by unpaired t test.
The raw data for these 161 genes are provided in Table 2. Hierarchical clustering was performed by using cluster and visualized by using treeview (10). For the sample key of the clustering shown in Figs. 1 and 2, see Fig. 5, which is published as supporting information on the PNAS web site.
Figure 1.
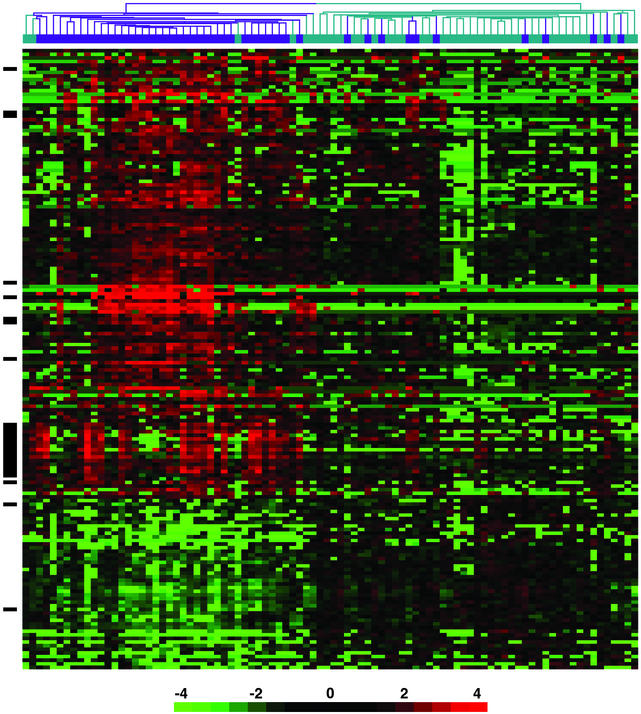
Gene expression profiles of PBMCs from 48 SLE patients and 42 healthy controls. Shown are hierarchical clustering results of microarray data for 161 genes that distinguish lupus patients (dark blue) from healthy controls (aqua). All genes met the following criteria: >1.5-fold difference in mean gene expression levels between patients and controls, difference in mean gene expression level >100 units, and P < 0.001. The individual data points are expressed as the ratio of the expression value to the mean of control expression values. The ratios are depicted according to the scale shown at the bottom, and range from 0.0625 to 16.0 (−4 to 4 on a log2 scale). Red indicates genes expressed at higher levels relative to the control mean, and green represents genes expressed at lower levels than control mean. Black bars on the left side of the figure indicate IFN-regulated genes. See supporting information for identification of individual samples on the clustering tree.
Figure 2.
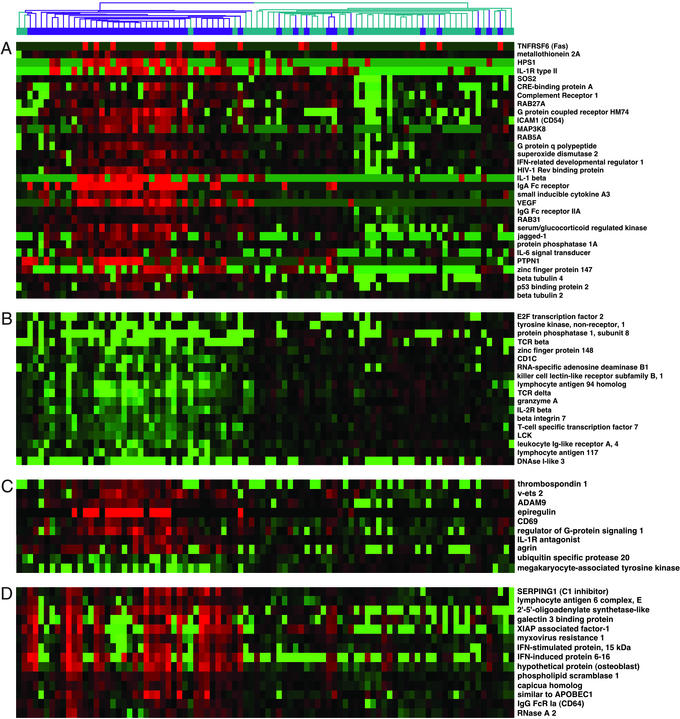
Genes differentially expressed between SLE and control PBMCs. Shown are representative genes from the data shown in Fig. 1. (A) Selected genes generally overexpressed in SLE compared with controls. (B) Selected genes generally underexpressed in SLE compared with controls. (C) IFN-regulated genes that did not show tight clustering in Fig. 1. (D) IFN-regulated genes that comprise the IFN signature shown in Fig. 1.
Flow Cytometry.
PBMC percentages were measured by flow cytometry of freshly stained cells using antibodies against CD3, CD20, CD56, and CD64 (BD PharMingen, San Diego). SLE (n = 18): 52% T cells, 5% B cells, 28% monocytes/macrophages, 15% natural killer cells. Controls (n = 28): 65% T cells, 6% B cells, 13% monocytes/macrophages, 16% natural killer cells. Percentages of T cells (P = 0.014) and monocytes (P = 0.00001) were significantly different between SLE and controls.
Identification of Genes Regulated by IFN.
Peripheral blood was drawn from each of four healthy control individuals into heparinized tubes. PBMCs were isolated over Lymphocyte Separation Medium (Mediatech Cellgro, Herndon, VA), according to the manufacturer's protocol. After the last wash, cells were resuspended in complete media (RPMI medium 1640/10% heat inactivated FBS/2 mM l-glutamine/50 units/ml penicillin/50 μg/ml streptomycin) at a final concentration of 2 × 10⁶ cells per ml. PBMCs were then cultured for 6 h at 37°C with one of the following additions: (i) PBS + 0.1% BSA control; (ii) IFN-α and IFN-β (R & D Systems), each at 1,000 units/ml in PBS + 0.1% BSA; or (iii) IFN-γ (R & D Systems), 1,000 units/ml in PBS + 0.1% BSA.
After the 6 h incubation, total RNA was isolated and prepared for hybridization to chips. Data were processed as described above. Genes that met both of the following criteria in all four experiments were identified as IFN-regulated: (i) change in expression of at least 2-fold when compared with untreated control; and (ii) difference in expression of at least 500 AD units when compared with untreated control.
The data for these 286 genes (represented by 304 Affymetrix probe sets) and additional analyses are provided in the supporting information.
ELISA.
Plasma/serum IFN-γ and IFN-α protein from 38 patients and 14 controls were measured by ELISA (Pierce). IFN-γ was undetectable in all samples (<25 pg/ml). IFN-α was detectable in only two patients (SLE 38 and SLE 8, 26 and 29 pg/ml, respectively) and one control subject (Ctrl 21, 56 pg/ml).
Calculation of IFN Scores.
Scores were calculated by first normalizing the expression values within each row of genes so that the maximum value in any row was 1.0. Then the columns (samples) were summed to obtain the score. The IFN score (mean ± SD) for patients was 3.7 ± 2.6, compared with controls 1.5 ± 0.5, P = 4.2 × 10⁻⁷. See supporting information for additional details concerning calculation of the scores and clinical correlations.
Results and Discussion
PBMC Gene Expression Profiles Distinguish SLE from Controls.
We collected PBMCs from 48 consecutively recruited SLE patients and 42 healthy controls. RNA was isolated, converted to double-stranded cDNA, and then transcribed in vitro into labeled cRNA for hybridization to Affymetrix U95A Human GeneChips. After chip hybridization and initial data analysis, the expression values for 4,566 genes represented on the chips were compared between SLE patients and controls by using a nonpaired Student's t test. This analysis identified 161 unique genes that were differentially expressed by using the following criteria: change in expression of at least 1.5-fold, difference in expression of at least 100 expression units when comparing the means of the two groups, and P < 0.001 by unpaired t test.
Expression values for each of the 161 genes were converted to “fold differences,” by dividing each value by the mean of the control expression values. Unsupervised hierarchical clustering was then applied to the data set. This analysis identified gene expression patterns that differentiated most SLE patients from healthy controls (Fig. 1).
Genes Up-Regulated in SLE PBMCs.
Thirty-seven of the 48 SLE patients clustered tightly together, whereas 11 of the patients coclustered with controls. Six of the 42 control subjects clustered together with the large group of patients (Fig. 1).
Most of the genes that best distinguished SLE from control PBMCs were expressed at higher levels in SLE (124 of 161, 77%) than in normal subjects. A number of these genes have known or suspected roles in the immune system. For example, many SLE patients were found to overexpress mRNA for the following cell surface markers: TNFR6 (Fas/CD95), a death receptor; intercellular adhesion molecule-1 (CD54), an adhesion molecule; CD69, a lymphocyte activation antigen; and complement receptor 1 (Fig. 2A). Three different Ig Fc receptors were expressed at elevated levels in SLE patients: the Fc receptor for IgA (FCAR, CD89), and the IgG receptors FcRγIIA (CD32) and FcRγI (CD64). Of interest, single nucleotide polymorphisms of FcγIIA and FcγIIIA show genetic association with SLE (4–6).
Transcripts for three molecules in the inflammatory IL-1 cytokine pathway [IL-1β, the IL-1 receptor II (IL-1RII), and the IL-1 receptor antagonist] were also present at elevated levels in many patients. Other notable overexpressed genes included the signaling molecules MAP3K-8, RAB27, and interleukin-6 signal transducer, and the transcription factors v-ets 2, MADS box transcription factor 2, the estrogen responsive zinc finger protein 147, and Jagged 1, a ligand for Notch 1. We conclude that many genes important for innate and acquired immunity have dysregulated expression patterns in SLE PBMCs. In general, these genes have not previously been implicated in SLE, and represent new potential targets to be explored in future work.
Genes Down-Regulated in SLE PBMCs.
Of the genes generally expressed at lower levels in patients than controls, several were T cell-specific (e.g., Lck, T cell receptor δ, T cell receptor β) (Fig. 2B). Flow cytometry of PBMCs in a subset of patients showed a modest T cell lymphopenia (≈20% average decrease in percentage of CD3+ T cells), which could not completely account for the decreased expression of some T cell genes. There was also a significant increase in the percentage of monocyte/macrophages in patients compared with controls. These differences in baseline cell populations clearly contribute to some of the differences in gene expression observed, and highlight the importance of documenting cell percentages in mixed cell populations.
Dysregulation of Genes in the IFN Pathway.
One of the most striking mRNA clusters contained several genes previously identified as being IFN-regulated (Fig. 1, solid black bar) (11). Interferons are highly potent cytokines that function to maintain viral immunity (IFN-α and IFN-β), and mediate TH1 immune responses (IFN-γ). Genes in this cluster were up-regulated in about half of the patients, and were expressed at low levels in most of the control subjects.
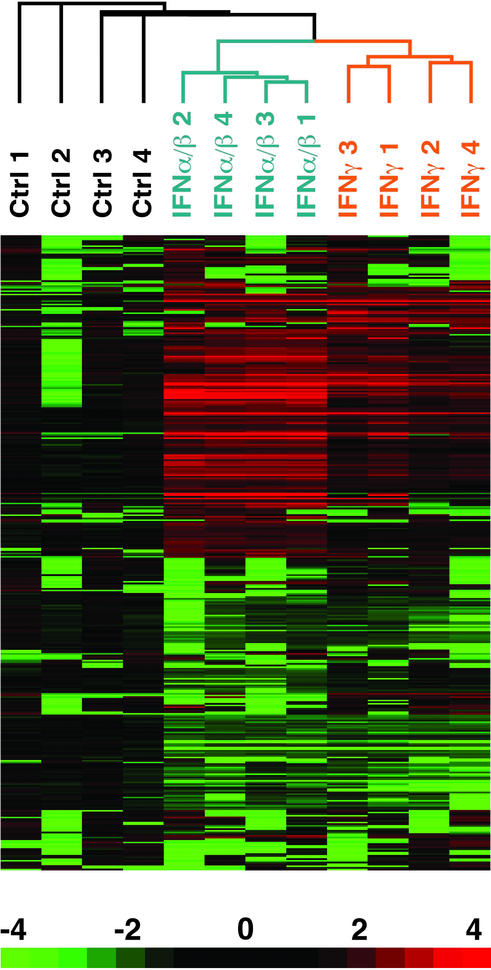
We determined the extent to which the genes in this cluster could be regulated in PBMCs by IFN treatment in vitro. PBMCs were isolated from four healthy donors, and cultured for 6 h in complete media alone or in the presence of IFN-α/β or IFN-γ at 1,000 units/ml. RNA was then isolated, and cRNA probes were prepared for chip hybridization. Changes in gene expression after IFN treatment were assessed relative to the 6-h control culture. This analysis identified 286 genes that demonstrated >2-fold change in expression from baseline, and an absolute mean difference in the level of expression >500 units (Fig. 3). The induction of many known IFN-regulated genes in this experiment, such as Stat1, myxovirus resistance 1 (Mx-1), and ISGF-3 (10), validated the approach. When we used this list of IFN-regulated genes, we found that 13 of 14 unique genes in the cluster were bona fide IFN-regulated transcripts (Fig. 2D). An additional 10 IFN-regulated genes that did not cluster together were also identified (Fig. 2C). Overall, 23 of the 161 genes (14.3%) were found to be IFN-regulated, compared with 7 genes (4.2%) that would have been expected by chance alone (P = 1.0 × 10⁻¹⁰).
Figure 3.
Identification of PBMC genes regulated by IFN. Depicted are 286 genes that showed a 2-fold or greater change in expression, and a difference of >500 expression units after treatment in vitro of normal control PBMCs with IFN-α/β or IFN-γ. For each sample, the expression value for each gene was divided by the average expression level of the 6-h untreated samples. This ratio was then visualized as in Fig. 1.
IFN Signature Is a Marker for Severe SLE.
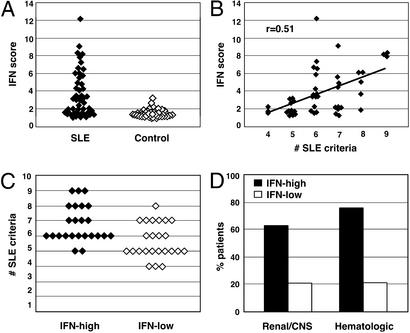
An IFN “score” was calculated for each patient and control, based on the expression levels of genes in the IFN cluster. Approximately half of the SLE patients exhibited an elevated IFN score, whereas the others had scores indistinguishable from controls (Fig. 4A). We next investigated whether the IFN gene expression signature correlated with clinical features of SLE. SLE is diagnosed by using 11 criteria developed by the American College of Rheumatology (ACR) (12). These criteria span the clinical spectrum of SLE and include skin criteria (malar rash, oral ulcers, photosensitivity, and discoid rash), systemic criteria (pleuritis or pericarditis, arthritis, renal disease, or CNS involvement), and laboratory criteria (cytopenias, anti-double-stranded DNA or anti-phospholipid Abs, and antinuclear antibodies). A patient must meet four of these criteria to be classified as having definite SLE.
Figure 4.
The IFN expression signature identifies a clinical subset of SLE patients with severe disease. (A) A numerical score was calculated by using the normalized expression levels of the 14 IFN-regulated genes that comprise the IFN signature. The differences between patients and controls were significant, P = 2.8 × 10⁻⁷. (B) Linear regression analysis demonstrates a significant correlation between IFN score and the number of SLE disease criteria (r = 0.51, P = 0.0002). (C) Patients were divided into two groups: IFN-high, the 24 patients with the highest IFN scores; and IFN-low, the 24 patients with the lowest scores. The data compare the two groups for number of ACR criteria for SLE (minimum of 4 to establish the disease, maximum of 11), P = 0.002. (D) The data compare the percent of patients in the IFN-high and IFN-low groups with ACR-defined criteria for renal and/or CNS disease (P = 7.7 × 10⁻⁶) or hematologic involvement (P = 6.1 × 10⁻⁹).
Linear regression analysis showed that the IFN score was significantly correlated with the number of SLE disease criteria (P < 0.0002) (Fig. 4B). We next divided the lupus patient population in half, and compared the historical clinical features of the 24 SLE patients with the highest IFN scores (IFN-high) to the 24 with the lowest scores (IFN-low). Patients in the IFN-high group had a significantly higher number of SLE criteria (6.8 ± 1.3) than those in the IFN-low group (5.7 ± 1.1) (P = 0.004) (Fig. 4C).
Importantly, 15 of 24 (62%) patients in the IFN-high group at some time in their disease course fulfilled ACR criteria for involvement of kidneys and/or the CNS, the most serious complications of lupus, compared with 5 of 24 (21%) of those in the IFN-low group (Fig. 4D). In addition, 18 of 24 (75%) of IFN-high patients had hematologic involvement in their disease (severe leukopenia, hemolytic anemia, or thrombocytopenia), compared with only 5 of 24 (21%) of the IFN-low patients (Fig. 4D). Similar results were obtained when comparing the entire group of patients with renal and/or CNS involvement (n = 20, IFN score 4.8 ± 2.5) to those without (n = 28, 2.9 ± 2.4, P = 0.01), the group with hematologic involvement (n = 23, IFN score 5.1 ± 2.8) to the group without (n = 25, 2.4 ± 1.5, P = 0.0003), or the group with one or more of the three organs involved (n = 28, IFN score 4.7 ± 2.7) to those without (n = 20, 2.4 ± 1.6, P = 0.0007). We conclude that an elevated IFN score is strongly associated with the most severe manifestations of SLE.
The hypothesis that IFNs might be important in the pathogenesis of lupus is supported by a number of observations. Mice transgenic for IFN-γ develop lupus-like autoimmunity (13), and lupus-prone NZB/NZW F1 mice treated with anti-IFN-γ Abs or bred onto the IFN-γ −/− background show amelioration of disease (14, 15). Kotzin and colleagues (16) recently identified the IFN-inducible gene IFI-202 as an SLE gene within the Nba2 SLE locus on mouse chromosome 1, and showed that NZB mice, the parental strain for this locus, show constitutively high expression of the IFI-202 transcription factor. In humans, elevated levels of IFN-α have been reported in the sera of some SLE patients (17), and a significant percentage of individuals treated with IFN-α for viral hepatitis develop lupus-related autoantibodies (17, 18). Finally, IFN-α in the sera of some pediatric SLE patients induces maturation of monocytes into highly active antigen-presenting dendritic cells (19).
We were unable to detect IFN-γ protein by ELISA in any patient or control serum sample, and IFN-α was detectable in only 2 of 38 patients and 1 of 14 controls. In addition, mRNA levels for the IFNs were not significantly different between patients and controls. Thus, the IFN gene expression signature that we have identified in blood cells of patients appears to be a more sensitive readout for activation of this pathway than cytokine levels in serum. Alternatively, IFNs in the sera of these patients may not be detectable by ELISA because of blocking Abs or other factors. It is also theoretically possible that these signatures reflect another cytokine or stimulus besides IFN that engages downstream IFN-signaling pathways.
Recently, novel therapies that block the activity of the proinflammatory cytokines TNF-α and IL-1β have been used successfully to treat autoimmune diseases such as rheumatoid arthritis and Crohn's disease (20, 21). The data presented here provide a strong rationale for the development of new therapies to block IFN pathways in human SLE, and the pattern of gene expression in blood cells may be useful in identifying those patients most likely to benefit from these therapies. Finally, these data suggest that gene expression profiling in peripheral blood cells may be useful for identifying relevant disease pathways in other autoimmune and inflammatory disorders.
Supplementary Material
Acknowledgments
We are grateful to all of the SLE patients for their participation. We thank L. Staudt for advice and encouragement. This work was supported by the National Institute of Arthritis and Musculoskeletal and Skin Diseases, the Minnesota Lupus Foundation, and the Alliance for Lupus Research.
Abbreviations
- SLE
systemic lupus erythematosus
- PBMC
peripheral blood mononuclear cell
- AD
average difference
- ACR
American College of Rheumatology
References
- 1.Wallace D J. Dubois' Lupus Erythematosus. Philadelphia: Williams & Wilkins; 2002. [Google Scholar]
- 2.Arnett F C, Reveille J D. Rheum Dis Clin North Am. 1992;18:865–892. [PubMed] [Google Scholar]
- 3.Schur P H. Lupus. 1995;4:425–437. doi: 10.1177/096120339500400603. [DOI] [PubMed] [Google Scholar]
- 4.Harley J B, Moser K L, Gaffney P M, Behrens T W. Curr Opin Immunol. 1998;10:690–696. doi: 10.1016/s0952-7915(98)80090-3. [DOI] [PubMed] [Google Scholar]
- 5.Wakeland E K, Liu K, Graham R R, Behrens T W. Immunity. 2001;15:397–408. doi: 10.1016/s1074-7613(01)00201-1. [DOI] [PubMed] [Google Scholar]
- 6.Vyse T J, Kotzin B L. Curr Opin Immunol. 1996;8:843–851. doi: 10.1016/s0952-7915(96)80014-8. [DOI] [PubMed] [Google Scholar]
- 7.Brown P O, Botstein D. Nat Genet. 1999;21:33–37. doi: 10.1038/4462. [DOI] [PubMed] [Google Scholar]
- 8.Staudt L M. Annu Rev Med. 2002;53:303–318. doi: 10.1146/annurev.med.53.082901.103941. [DOI] [PubMed] [Google Scholar]
- 9.Ramaswamy S, Golub T R. J Clin Oncol. 2002;20:1932–1941. doi: 10.1200/JCO.2002.20.7.1932. [DOI] [PubMed] [Google Scholar]
- 10.Eisen M B, Spellman P T, Brown P O, Botstein D. Proc Natl Acad Sci USA. 1998;95:14863–14868. doi: 10.1073/pnas.95.25.14863. [DOI] [PMC free article] [PubMed] [Google Scholar]
- 11.Der S D, Zhou A, Williams B, Silverman R H. Proc Natl Acad Sci USA. 1998;95:15623–15628. doi: 10.1073/pnas.95.26.15623. [DOI] [PMC free article] [PubMed] [Google Scholar]
- 12.Hochberg M C. Arthritis Rheum. 1997;40:1725. doi: 10.1002/art.1780400928. [DOI] [PubMed] [Google Scholar]
- 13.Seery J P, Carroll J M, Cattell V, Watt F M. J Exp Med. 1997;186:1451–1459. doi: 10.1084/jem.186.9.1451. [DOI] [PMC free article] [PubMed] [Google Scholar]
- 14.Balomenos D, Rumold R, Theofilopoulos A N. J Clin Invest. 1998;101:364–371. doi: 10.1172/JCI750. [DOI] [PMC free article] [PubMed] [Google Scholar]
- 15.Jacob C O, van der Meide P, McDevitt H O. J Exp Med. 1987;166:798–803. doi: 10.1084/jem.166.3.798. [DOI] [PMC free article] [PubMed] [Google Scholar]
- 16.Rozzo S J, Allard J D, Choubey D, Vyse T J, Izui S, Peltz G, Kotzin B L. Immunity. 2001;15:435–443. doi: 10.1016/s1074-7613(01)00196-0. [DOI] [PubMed] [Google Scholar]
- 17.Ronnblom G V, Alm J. J Exp Med. 2001;194:59–63. doi: 10.1084/jem.194.12.f59. [DOI] [PMC free article] [PubMed] [Google Scholar]
- 18.Fukuyama S, Kajiwara E, Suzuki N, Miyazaki N, Sadoshima S, Onoyama K. Am J Gastroenterol. 2000;95:310–312. doi: 10.1111/j.1572-0241.2000.01715.x. [DOI] [PubMed] [Google Scholar]
- 19.Blanco P, Palucka A K, Gill M, Pascual V, Banchereau J. Science. 2001;294:1540–1543. doi: 10.1126/science.1064890. [DOI] [PubMed] [Google Scholar]
- 20.Targan S R, Hanauer S B, van Deventer S J, Mayer L, Present D H, Braakman T, DeWoody K L, Schaible T F, Rutgeerts P J. N Engl J Med. 1997;337:1029–1035. doi: 10.1056/NEJM199710093371502. [DOI] [PubMed] [Google Scholar]
- 21.Moreland L W, Baumgartner S W, Schiff M H, Tindall E A, Fleischmann R M, Weaver A L, Ettlinger R E, Cohen S, Koopman W J, Mohler K, et al. N Engl J Med. 1997;337:141–147. doi: 10.1056/NEJM199707173370301. [DOI] [PubMed] [Google Scholar]
Associated Data
This section collects any data citations, data availability statements, or supplementary materials included in this article.


