Abstract
Unilateral stimulation of human peripheral nerves activates the primary somatosensory cortex (SI) contralaterally and the secondary somatosensory cortex (SII) bilaterally. We aimed at characterizing phase locking between SI and SII in response to electric stimuli applied once every 3 s to the right median nerve at the wrist; phase locking between brain regions has been proposed to either reflect joined processing or information exchange. Ongoing neuromagnetic activity of healthy volunteers was recorded with 204 planar gradiometers covering the whole scalp. After selecting a sensor maximally sensitive to activity in the left (contralateral) SI, phase locking between this sensor and the other 203 sensors was examined from single trial data. Statistically significant phase locking was found at ≈20 Hz, 80–90 ms after the stimuli between the left SI and the right SII in 9 of 10 subjects. Sensors with high phase-locking values over the left SI and right SII were separated by sensors with no phase-locked activity over the scalp midline, indicating that the phase locking was not caused by the sensors seeing activity from the same sources. The observed SI–SII phase locking would not be reflected in the evoked responses because a considerable part of it was not time-locked to the stimuli. Thus, our finding reveals a unique interaction in the sensorimotor system.
Keywords: magnetoencephalography|sensorimotor interaction|20 Hz
Tactile and electrical stimulation of the peripheral nerves activates the primary somatosensory cortex (SI) and the secondary somatosensory cortex (SII) with different temporal patterns. SI is located in the postcentral gyrus of the parietal lobe and comprises well-defined somatotopically ordered subareas that are activated in the hemisphere contralateral to the stimulation. The SII occupies a small area in the parietal operculum and contains bilateral representations of the body. Whereas SI is involved primarily in discriminative aspects of somatic sensations, SII is assumed to have a role in tactile memory (1, 2) and sensorimotor integration (3, 4). Both SI and SII receive thalamic projections, but they are also directly connected by corticocortical connections (5, 6); however, the precise connections largely vary according to the species under study, and in humans the interplay between SI and SII is still poorly understood.
Phase locking between neuronal networks has been proposed as a mechanism for integration and exchange of information (for a review, see ref. 7). Our aim was to study the interaction between SI and SII by measuring phase locking between magnetoencephalographic (MEG) signals elicited by electrical stimulation of the median nerve. The advantage of MEG over electroencephalography, which also has the millisecond-range temporal resolution necessary for studying signal phase locking, is the good spatial selectivity to source currents in the brain. Especially when the MEG signals are measured with planar gradiometers, as in the present study, the selectivity is good even at sensor level, without explicit source analysis.
Materials and Methods
Subjects, Stimuli, and Experimental Conditions.
This study received previous approval by the Ethical Committee of the Helsinki and Uusimaa Hospital District, and a written informed consent was obtained from all subjects before the experiments.
Continuous MEG signals were recorded from 10 subjects (ages 22–33, mean 27 years, five female and five male, two left-handed) during stimulation of the right median nerve at the wrist. The intensity (7–10 mA, mean 8 mA) of the 0.2-ms electric pulses, delivered once every 3 s, was adjusted individually to produce a visible twitch of the thumb without being painful. The subjects were asked to ignore the stimuli.
Recording.
Somatosensory evoked fields were recorded with a 306-channel helmet-shaped neuromagnetometer (Vectorview, Neuromag, Helsinki), which contained 102 identical triple sensors. Each sensor element comprises two orthogonal planar gradiometers and one magnetometer, thereby providing three independent measurements of the magnetic field at each sensor location; we analyzed only signals from the 204 planar gradiometers. During the recording, the subject was sitting comfortably in a magnetically shielded room with his/her head leaning against the magnetometer helmet.
The exact position of the head with respect to the sensors was found by measuring magnetic signals produced by currents fed into four indicator coils placed on the scalp. The locations of the coils with respect to landmarks on the head were determined with a 3D digitizer to allow alignment of the MEG and magnetic resonance (MR) image coordinate systems.
The signals were recorded with a passband of 0.03–200 Hz, digitized at 600 Hz, and stored on a disk for off-line analysis. The MR images of the subjects' brains were acquired with a 1.5-T Siemens Magnetom system.
Data Analysis.
The analysis period of 700 ms included a prestimulus baseline of 200 ms, and ≈120 epochs were averaged. Spherical volume conductor models used in the source analysis were found for all subjects on the basis of the individual MR images (available for 9 of 10 subjects).
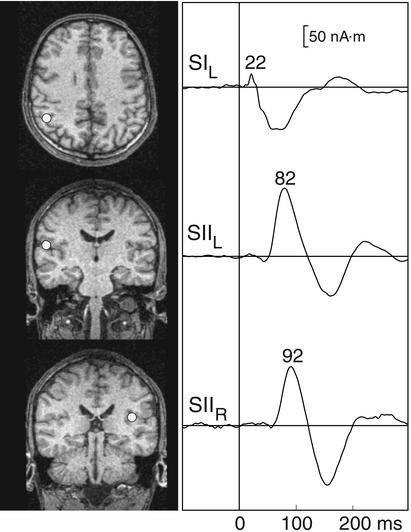
The sources of somatosensory evoked fields were first identified to serve as landmarks of the locations of the SI and SII. The somatosensory evoked fields were divided into several time periods during each of which one equivalent current dipole, best describing the dominant source, was found by a least-squares search based on a subset of channels in the area of the maximum response. These calculations resulted in the 3D location, orientation, and strength of the equivalent current dipole. The final source model consisted of three current dipoles: one in the left (contralateral) SI (SIL) and the other two in the left SII (SIIL) and right SII (SIIR).
Phase locking between two signals (s and s
and s ) was quantified, from the unaveraged signals, using wavelet analysis (8). A complex representation of the phase for trial i at time t and frequency f0 is given by the convolution of a Morlet wavelet, w(t, f0) = Aexp(−t2/2σ
 )exp(j2πf0t) and the signal s
 , normalized by the amplitude
 |
The width of the wavelet (m = f0/σf) was chosen to be 7; where σf = 1/2πσt. The phase-locking values (PLVs) over N trials between signals s and s
and s are defined as:
 |
PLV, ranging from 0 to 1, estimates the variability of phase differences between two signals across trials. Statistical significance of the PLVs was established by using a Rayleigh test (9). For 120 trials (n = 120), a PLV above 0.17 is statistically significant at P < 0.05.
Phase-locking statistics (PLS) were used to estimate whether the phase locking between two sensors would have resulted from common locking to the stimuli (8). Let us assume that sets of trials are recorded by sensors a and b in response to a stimulus. If the phase locking between the signals from these two sensors would result from common locking to the stimulus, then a signal from sensor a would not only be phase locked to sensor b within that trial, but to any other trials measured by sensor b. PLS is a statistical measure, which, by shuffling the trials, indicates the phase locking, which is not explained by phase locking to the stimuli.
For all phase-locking calculations, we first selected, in each individual, the sensor that showed the strongest 15- to 25-Hz oscillations 50–150 ms after stimulus in the time-frequency representations (10) of the channels over the SI. Phase locking of all channels was then estimated with respect to this selected reference channel, and the computations were made separately for each subject's data. Subsequently, the channel with the strongest evoked response in the SII region, and orthogonal to the reference channel (to minimize crosstalk), was selected to represent the SII area.
Instead of estimating the phase locking between individual sensors, the calculations could be performed on the source waveforms based on the equivalent current dipole models of the major evoked responses. In the ideal case, the multidipole model would pick up the activity in the SI and SII regions without any leakage between the source areas; however, in practice the slight nondipolarities of the true sources introduce crosstalk. In addition, the neural sources giving rise to phase locking do not need to match exactly the sources of the evoked responses. As cross- talk was indeed evident with the source-based approach, we decided to perform the analysis only at the level of the signals. For this particular application we did not expect the analysis in source space to bring additional information.
Results
Fig. 1 Left shows the three-dipole model for somatosensory evoked fields of subject S4, with the dipoles superimposed on the MR images of the subject. In agreement with previous studies, the source of the early activity is located in the contralateral SI, and the sources of the later signals in the upper banks of the Sylvian fissures bilaterally, in areas corresponding to the SII cortices (11). The right column in Fig. 1 shows the strengths of these sources as a function of time. The earliest activation peaks at 22 ms in the SI and is followed by later activation in the SIIL and SIIR peaking at 82 and 92 ms, respectively. As explained in Materials and Methods, the SI and SII source areas served as guidelines in selecting the most suitable channel locations for the phase-locking analysis.
Figure 1.
(Left) Locations of the three current dipoles in subject S4 superimposed on his MR images. (Right) Strengths of the sources as a function of time, derived from the three-dipole model.
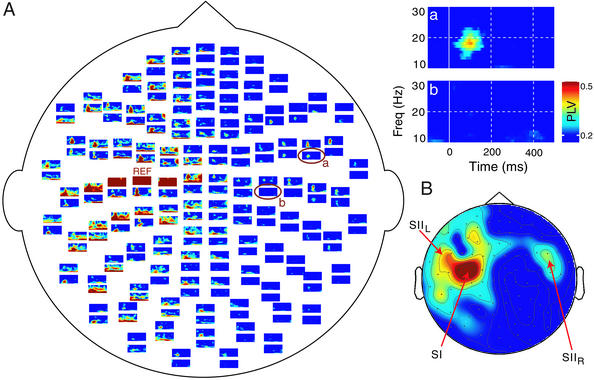
Fig. 2A shows the time-frequency representation of the PLVs for subject S4, computed from the 120 trials between the sensor with the strongest 20-Hz power response over the SIL region (reference channel, noted REF in the figure) and the remaining 203 sensors. The PLV plots are arranged topographically according to the position of the corresponding sensor on the helmet. Only statistically significant (P < 0.05) PLVs are shown and they are color-coded according to the significance level. Immediate neighbors of the REF sensor measure the same source activity, and thus their high PLVs have no physiological meaning. To exclude similar leakage, we focused on phase locking between the left SIL and the SIIR regions. To further reduce the possibility of erroneous interactions due to crosstalk, we selected a channel over SII with an orthogonal orientation to the REF channel.
Figure 2.
(A) Time-frequency representations of the PLVs for all planar gradiometers of subject S4. The reference channel (REF) is located over the SIL, and all PLVs were computed in relation to this channel. The enlargements on the right are from the encircled channels, located over the SIIR (a) and the midline (b). For all plotted values, PLV > 0.17, P < 0.05. (B) The topographic plot on the lower right corner shows the spatial distribution of the averaged PLVs across 50–150 ms for the 18- to 22-Hz band, plotted on the helmet. Notice the absence of phase locking over the scalp midline.
Fig. 2 Insets show enlargements of the PLV plots over the SIIR (a) and the scalp midline (b). The SIIL–SIIR phase locking occurs during the time interval of 80–110 ms at frequencies of 18–22 Hz.
Fig. 2B shows the spatial distribution of the PLVs computed during the 50- to 150-ms time interval for a frequency band of 18–22 Hz, substantiating that the PLVs between SIIL and SIIR are clearly separated by much smaller values over the midline and the right parietal regions.
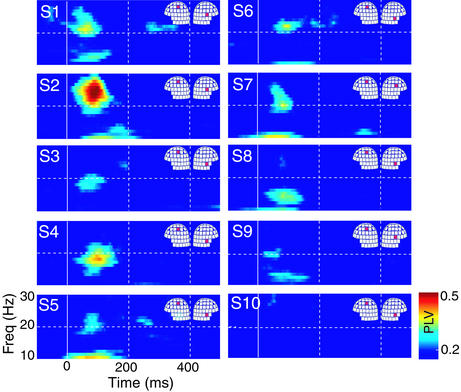
Fig. 3 shows the SIL–SIIR PLVs for all 10 subjects. The individual plots were calculated from the sensors marked on the helmets and, as in Fig. 2, only statistically significant (P < 0.05) values were shown. All subjects, except S10, display significant phase locking between 15 and 25 Hz, with the maximum PLVs ≈100 ms after the stimuli. Subjects S7, S8, and S10 had the smallest evoked responses in the SII areas of both hemispheres, which might explain why their PLV patterns differ so much from those of the others.
Figure 3.
PLVs for all subjects (S1–S10), between a channel over the SIL and another channel over the SIIR; the channels are indicated for each subject on the helmets. Only statistically significant PLVs (P < 0.05) are represented.
For a plausible physiological interpretation of the results, it is essential to know to which extent the observed phase-locked activity is locked to the stimuli. This question was addressed by calculating an estimate for such phase locking between two sensors that is not explained by common locking to the stimuli. In 7 of the 10 subjects, statistically significant (P < 0.05) PLS values were obtained at the frequencies of the maximum PLVs (between 15 and 25 Hz).
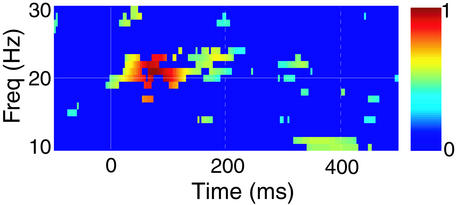
The time-frequency representation of Fig. 4 was computed as a combination of the grand average of the normalized PLVs across subjects and the corresponding PLS: We tested whether the relative increase in −log(PLS) with respect to a 100-ms prestimulus baseline would be statistically significantly >0 (P < 0.05, n = 10, t test). PLVs were then plotted only at those latencies and frequencies for which the PLS change was statistically significant; in other words, all colored pixels refer to activity that is not locked to the stimuli. Fig. 4 thus indicates that a substantial part of the SIL–SIIR phase locking cannot be explained by common phase locking to the stimuli.
Figure 4.
Combination of the grand average of normalized individual PLV plots and the PLS. Only those time-frequency PLV “pixels” that coincided with statistically significant PLS values in the grand-average are shown and color-coded for the normalized PLVs.
Discussion
We examined phase locking between the human SI and SII regions in response to stimulation of the right median nerve, to learn about the functional relationships between these areas. Statistically significant phase locking was observed at frequencies of ≈20 Hz, ≈80–90 ms after the stimuli, between sensors picking up signals from the contralateral SI and the SII region of the other hemisphere. Because the SI and SII sensors that displayed phase locking were far from each other and separated by an area of nonphase-locked signals over the scalp midline, it is highly unlikely that the phenomenon could be explained by crosstalk, i.e., that the two sets of sensors would measure activity from the same source(s); fortunately the planar gradiometers are near-sighted, being mainly sensitive to source currents just beneath the sensors.
The phase locking occurred in the present study at clearly lower frequencies than has been often reported in other brain systems (7). However, ≈20-Hz oscillations are characteristic for the sensorimotor cortex (12), and thus phase locking in those frequencies between the primary sensorimotor areas and the SII was not unexpected.
Further statistical analysis, by means of PLS, showed that a substantial part of the SIL–SIIR phase locking remained unexplained by common phase locking to the stimuli. The stronger phase locking of SI and SII responses to each other than to the stimuli implies intrinsic interaction within the somatosensory network. The effect, now observed in a single-trial analysis, would not be seen in the averaged evoked responses, which only reflect signals phase locked to the stimuli. Thus, our finding reveals a unique interaction between the human SI and SII regions.
Our present data cannot reveal the exact route, origin, or mechanism of the SI–SII interaction. The phase locking between the SI and the SII region of the other hemisphere could be either a consequence of direct communication between the two regions via callosal fibers (13, 14) or a result of simultaneous thalamic drive of both brain regions. These two hypotheses are not exclusive; instead, SI, SII, and thalamus all could be phase locked at some instances. These functional connections could be clarified either by direct thalamic and cortical recordings or by inferences based on lesion studies. For instance, observing phase locking between SI and the contralateral SII region in split-brain patients would support thalamus as the driving force for the phase locking. Future studies should also address the dependence of the phase locking on various tasks. Phase locking that really reflects integration of information between the SI and SII regions is expected to increase with increasing demands to tactile processing.
Acknowledgments
We thank Jan Kujala for help in data analysis. This work has been supported by the Academy of Finland, and by the Portuguese Foundation for Science and Technology PRAXIS XXI BD-19517/99.
Abbreviations
- SI
primary somatosensory cortex
- SII
secondary somatosensory cortex
- SIL
left SI
- SIIR
right SII
- PLS
phase-locking statistics
- PLV
phase-locking value
- MR
magnetic resonance
Footnotes
A preliminary report on this work was presented at the Eighth International Conference on Functional Mapping of the Human Brain, June 2–6, 2002, Sendai, Japan.
References
- 1.Robinson C, Burton H. J Comp Neurol. 1980;192:43–68. doi: 10.1002/cne.901920104. [DOI] [PubMed] [Google Scholar]
- 2.Whitsel B, Petrucelli L, Werner G. J Neurophysiol. 1969;32:170–183. doi: 10.1152/jn.1969.32.2.170. [DOI] [PubMed] [Google Scholar]
- 3.Forss N, Jousmäki V. Brain Res. 1998;781:259–267. doi: 10.1016/s0006-8993(97)01240-7. [DOI] [PubMed] [Google Scholar]
- 4.Huttunen J, Wikström H, Korvenoja A, Seppäläinen A, Aronen H, Ilmoniemi R. NeuroReport. 1996;7:1009–1012. doi: 10.1097/00001756-199604100-00011. [DOI] [PubMed] [Google Scholar]
- 5.Jones E, Powell T. Brain. 1969;92:477–502. doi: 10.1093/brain/92.3.477. [DOI] [PubMed] [Google Scholar]
- 6.Jones E, Powell T. Brain. 1969;92:717–730. doi: 10.1093/brain/92.4.717. [DOI] [PubMed] [Google Scholar]
- 7.Varela F, Lachaux J, Rodriguez E, Martinerie J. Nat Rev Neurosci. 2001;2:229–239. doi: 10.1038/35067550. [DOI] [PubMed] [Google Scholar]
- 8.Lachaux J, Rodriguez E, Martinerie J, Varela F. Hum Brain Mapp. 1999;8:194–208. doi: 10.1002/(SICI)1097-0193(1999)8:4<194::AID-HBM4>3.0.CO;2-C. [DOI] [PMC free article] [PubMed] [Google Scholar]
- 9.Fisher N. Statistical Analysis of Circular Data. Cambridge, U.K.: Cambridge Univ. Press; 1993. [Google Scholar]
- 10.Tallon-Baudry C, Bertrand O, Delpuech C, Pernier J. J Neurosci. 1996;16:4240–4249. doi: 10.1523/JNEUROSCI.16-13-04240.1996. [DOI] [PMC free article] [PubMed] [Google Scholar]
- 11.Hari R, Forss N. Philos Trans R Soc London B. 1999;354:1145–1154. doi: 10.1098/rstb.1999.0470. [DOI] [PMC free article] [PubMed] [Google Scholar]
- 12.Hari R, Salmelin R. Trends Neurosci. 1997;20:44–49. doi: 10.1016/S0166-2236(96)10065-5. [DOI] [PubMed] [Google Scholar]
- 13.Jones E, Powell T. Brain. 1970;93:793–820. doi: 10.1093/brain/93.4.793. [DOI] [PubMed] [Google Scholar]
- 14.Burton H, Robinson C J. Somatosens Res. 1987;4:215–236. doi: 10.3109/07367228709144608. [DOI] [PubMed] [Google Scholar]


