Abstract
In normoglycemic offspring of two type 2 diabetic parents, low insulin sensitivity (SI) and low insulin-independent glucose effectiveness (SG) predict the development of diabetes one to two decades later. To determine whether low SI, low SG, or low acute insulin response to glucose are predictive of diabetes in a population at low genetic risk for disease, 181 normoglycemic individuals with no family history of diabetes (FH−) and 150 normoglycemic offspring of two type 2 diabetic parents (FH+) underwent i.v. glucose tolerance testing (IVGTT) between the years 1964–82. During 25 ± 6 years follow-up, comprising 2,758 person years, the FH− cohort (54 ± 9 years) had an age-adjusted incidence rate of type 2 diabetes of 1.8 per 1,000 person years, similar to that in other population-based studies, but significantly lower than 16.7 for the FH+ cohort. Even when the two study populations were subdivided by initial values of SI and SG derived from IVGTT's performed at study entry, there was a 10- to 20-fold difference in age-adjusted incidence rates for diabetes in the FH− vs. FH+ individuals with low SI and low SG. The acute insulin response to glucose was not predictive of the development of diabetes when considered independently or when assessed as a function of SI, i.e., the glucose disposition index. These data demonstrate that low glucose disposal rates are robustly associated with the development of diabetes in the FH+ individuals, but insulin resistance per se is not sufficient for the development of diabetes in individuals without family history of disease and strongly suggest a familial factor, not detectable in our current measures of the dynamic responses of glucose or insulin to an IVGTT is an important risk factor for type 2 diabetes. Low SI and low SG , both measures of glucose disposal, interact with this putative familial factor to result in a high risk of type 2 diabetes in the FH+ individuals, but not in the FH− individuals.
Both insulin resistance and insulin deficiency are components of the pathogenesis of type 2 diabetes. However their temporal relationships in the disease process remains unclear (1). Hyperglycemia, per se, induces defects in both insulin secretion and in insulin action (2). Thus, it is not possible to distinguish the role of either in the development of diabetes in persons already affected with disease. To elucidate the predictive values of these parameters on the occurrence of type 2 diabetes, studies must be performed in normoglycemic individuals. However there are few prospective studies evaluating normoglycemic subjects to determine their contribution to the pathogenesis of type 2 diabetes. Individuals with a family history of type 2 diabetes are at greater risk of developing the disease than people who have no family history of disease. Insulin sensitivity (SI) and the acute insulin response to glucose (AIRg) exhibit familial clustering, suggesting these are inherited traits (3, 4).
Several studies have shown that insulin resistance (or hyperinsulinemia) predate glucose intolerance and type 2 diabetes in normoglycemic individuals at high risk of developing diabetes, including ethnic Mexican American (5, 6) and Pima Indian groups (7) and Caucasians (8). In a longitudinal study of nondiabetic Caucasian offspring of two type 2 diabetic parents, we found both low SI and low glucose effectiveness (SG), but not low first-phase insulin secretion, were associated with development of type 2 diabetes one to two decades later (9). Euglycemic insulin-clamp studies have also shown early defects in glucose metabolism with decreased total-body glucose metabolism and impaired nonoxidative glucose metabolism (primarily glycogen storage) in persons at risk for type 2 diabetes, including normoglycemic first-degree relatives of patients with type 2 diabetes (10).
Other studies have focused on the role of insulin secretion in the development of type 2 diabetes and demonstrated reduced β cell function. Although fasting insulin levels may appear normal or elevated in patients with type 2 diabetes (11), other studies have shown that islet function testing at matched glucose levels in patients with type 2 diabetes is impaired in both basal and stimulated states (12).
In this study we have evaluated whether low SI and low SG, fasting insulin, or the AIRg antedate the development of type 2 diabetes in normoglycemic individuals with no family history of diabetes, and compared this group to the high-risk normoglycemic offspring of two type 2 diabetic parents. Because many people develop diabetes even in the absence of a family history of disease, if these parameters were to predict the development of diabetes, it would provide a relatively simple screening test for early detection of this important disorder and allow targeting of therapies directed at disease prevention. If these parameters were not predict disease in this group, it would suggest that familial factor(s) other than those measured by these parameters are involved in the occurrence of disease.
Patients and Methods
Study Subjects.
Informed consent was obtained from all individuals before participation in the study. Between the years 1963 and 1983, two study cohorts were identified, including 181 individuals with no family (first or second degree relative) history of diabetes (FH−), and 155 offspring of two type 2 diabetic parents (FH+). The latter were recruited from 330 members of 86 families. A total of 180 were willing to participate; 25 had to be excluded because of abnormal glucose tolerance at study entry as described (8, 13). All study subjects participating in the longitudinal evaluations had 100-gram oral glucose tolerance tests performed at study entry and determined to be normal based on the National Diabetes Data Group criteria for a 75-g glucose load [blood glucose <5.56 mmol/liter (100 mg/dl) fasting, <6.67 mmol/liter (120 mg/dl) at 2 h after glucose, and <10.0 mmol/liter (180 mg/dl) at all intervening times] (14), and underwent an i.v. glucose tolerance test (IVGTT) within 1 year of the oral glucose tolerance test. Participants were instructed to consume a high-carbohydrate diet (250–300 g/day) for the 3 days before both oral and i.v. glucose tolerance tests. For the IVGTT, after fasting blood samples were obtained, glucose (0.5 gm/kg body weight in 15–20% solution) was administered intravenously, and blood was drawn at 1, 3, 5, 10, 15, 20, 30, 40, 50, 60, 90, 120, and 180 min. IVGTTs were performed at study entry with the response subsequently analyzed by using the Bergman's Minimal Model (15), a computer-based method (MINMOD) to assess plasma insulin and glucose dynamics during an IVGTT. The minimum model for glucose disposal and insulin dynamics yields assessments of insulin secretion and sensitivity: the AIRg expressed as the increment above fasting insulin over the first 10 min, the SI index; and the SG index (insulin-independent glucose clearance). High or low SI, SG, and AIRg were determined by median values in the FH+ group (9), and applied to both the FH− and FH+ cohort.
Subjects in the FH− cohort were surveyed to ascertain the diagnosis of diabetes at study exit between 1994 and 1999. Known cases of diabetes were verified by medical history, including documented hyperglycemia and/or supervised medical treatment for diabetes. In the absence of known diabetes, ascertainment of glucose tolerance was based on a 75-g oral glucose tolerance performed after a high-carbohydrate diet (250–300 g/day) for the 3 days preceding the test followed by an overnight fast, or fasting or random glucose. One hundred and nine (61%) subjects participated in follow-up evaluation. Six subjects (5.5%) had developed type 2 diabetes: two were confirmed by oral glucose tolerance tests, two by fasting glucose and two were on medical therapy. One hundred and three subjects (94%) remained without diabetes, confirmed by oral glucose tolerance in 73 (72%), fasting glucose in 18 (17%), postprandial glucose in 5 (6%), 7 (7%) deceased with medical record review. Fifteen subjects declined participation in the follow-up study but reported no known diabetes, and 57 subjects who were lost to subsequent evaluation were not included in analysis.
Follow-up evaluation of the offspring of two diabetic parents occurred between the years of 1985 and 1989 (8). Twenty-five individuals (16%) developed type 2 diabetes, confirmed by oral glucose tolerance in 48%, fasting glucose in 32% and postprandial glucose in 20%; and 125 offspring of two diabetic parents (84%) remained without diabetes, confirmed by oral glucose tolerance in 78%, fasting glucose in 18%, and postprandial glucose in 5%.
Statistical Analysis.
Group differences for quantitative variables were tested by Student's t test and for qualitative variables by χ2 analysis (SAS 6.12, SAS Institute, Cary, NC). Multiple logistic regressions within a GLM framework was used to test the independent contribution of each of the variables that seemed to be important risk factors in univariate analysis. The statistical significance attributed to each variable was based on the improvement of the fit of the multiple logistic model when that variable was added to a model that included all of the other variables under consideration. Four individuals from the FH− cohort were omitted from longitudinal analysis, as the IVGTT data could not be fit to the MINMOD model; however, none of these individuals developed diabetes. Life table analysis was limited to the ages of 30–70 years. Trend analysis was assessed in three ways. The Cochran–Armitage test was used to test for an increased risk in development of diabetes across the groups. Two different coding schemes were applied. First, to test for a linear trend in the rate of diabetes across SI and SG groups, standard coding (i.e., 1, 2, 3, and 4) was used, which would test for a rate four times higher in the highest risk group than the lowest risk group. Next, we coded the four risk groups of the FH− cohort to reflect the pattern of rate increase demonstrated by the FH+ group. Because the low rate of diabetes in the two lowest risk groups (i.e., above median SI and SG, and above median SI − below median SG) we treated these two groups as the same in this model. This would specifically test whether the pattern of rate change in the FH− and FH+ cohorts was similar and a significant result (P < 0.05) would suggest an increase in risk of diabetes with progressive insulin resistance. Finally, we estimated the probability of the results in the FH− group follow the same risk pattern as in the FH+ group. This model would presume that SI and SG were similarly predictive of risk of diabetes in both FH− and FH+ cohorts. To do this we used a beta distribution to randomly generate the distribution of diabetes in the FH− group over the four SI and SG combinations. Simulations were done one million times. Confidence intervals for the simulation results were calculated from a binomial distribution. This tests whether the pattern of risk in the FH− group is consistent with that in the FH+ group, with a significant result (P < 0.05), suggesting that the pattern is not the same in the FH− group.
Results
Baseline characteristics of the study subjects who completed longitudinal evaluation are presented in Table 1. As we previously reported (9) for the FH+ cohort, 25 individuals (16%) developed type 2 diabetes during the follow-up of 6–25 years (mean 13.7 ± 5.8 years), compromising 1,995 person years. Because a positive family history of diabetes, especially if inherited from both parents is a strong risk factor for development of type 2 diabetes, we decided to follow the FH− subjects even longer. One hundred and nine of the FH− subjects participated in follow-up evaluation of 25 ± 6 years, compromising 2,758 person years. The FH− group had an age-adjusted incidence rate of type 2 diabetes of 1.8 per 1,000 person years, similar to that in other population based studies (16, 17), but much lower than the rate of 16.7 per 1,000 person years in FH+ group (P = 0.0001).
Table 1.
Baseline characteristics of FH+ and FH− individuals
| FH+ | FH− | P value | FH− with longitudinal evaluation | |
|---|---|---|---|---|
| Number of subjects | 150 | 181 | 109 | |
| Age, y | 32.9 ± 9.5 | 28.4 ± 8.6 | 0.0001 | 29.1 ± 9.1 |
| Gender, % male | 45 | 58 | 0.03 | 62 |
| BMI, kg/m2 | 26.5 ± 5.6 | 23.1 ± 3.1 | 0.0001 | 23.4 ± 3.0 |
| Glucose, fasting mg/dl | 77.3 ± 7.7 | 73.8 ± 6.4 | 0.0001 | 74.0 ± 6.4 |
| Log fasting insulin, μU | 1.18 ± 0.30 | 1.08 ± 0.26 | 0.0004 | 1.11 ± 0.23 |
| Log SI, 10−4 min−1 per μU per ml | 0.51 ± 0.36 | 0.67 ± 0.31 | 0.0003 | 0.60 ± 0.30 |
| Log SG, 10−2 min−1 | 0.26 ± 0.31 | 0.29 ± 0.38 | 0.40 | 0.30 ± 0.29 |
| Log AIRg, pM min−1 | 1.66 ± 0.34 | 1.71 ± 0.27 | 0.03 | 1.74 ± 0.27 |
Baseline characteristics of the offspring of two parents with type 2 diabetes (FH+) and the individuals with no family history of diabetes (FH−) and are shown in the first two columns. Where appropriate, values are expressed as mean ± SD. P values shown are from a t test. The final column provides baseline characteristics of the FH− individuals on whom longitudinal data was complete.
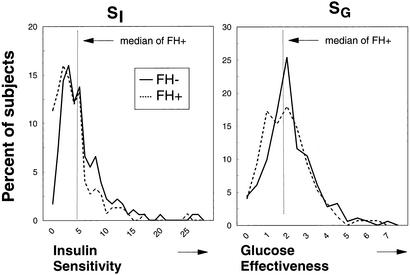
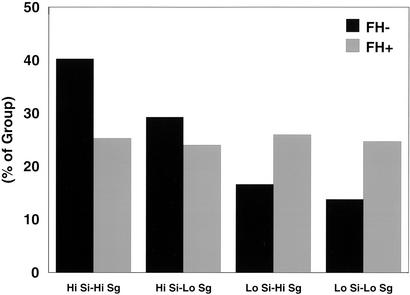
Distribution of the SI index and SG measured at study entry in individuals was similar between the two groups (Fig. 1), though there is a slight leftward shift of both curves in the FH+ group as compared with the FH− group, as calculated from the geometric mean of these values (Table 1). Slightly lower SI and SG are consistent with previous studies and indicate a tendency toward insulin resistance and lower SG in first-degree relatives of type 2 diabetic individuals. The median values for SI and SG in the FH+ group at study entry were 5.83 × 10⁻³ liter⋅min−1⋅pmol−1 insulin, and 2.09 × 10⁻⁴ min−1, respectively, and by definition, these divided the FH+ into four equal subgroups (low SI–low SG, low SI–high SG, high SI–low SG, high SI–high SG). When the same values of SI and SG were used in the FH− population, there was a higher percentage of FH− subjects (40.3%) with both high SI-high SG and a smaller percentage of individuals (13.8%) who would be defined as having both low SI and low SG, and thus perhaps at greater risk for the development of disease. However, all four subgroups were represented in the FH−cohort (Fig. 2).
Figure 1.
Distribution of the SI index (Left) and SG (Right) assessed by the Bergman Minimal Model and measured at study entry are presented in individuals with no family history of diabetes (FH−, solid line) and offspring of two diabetic parents (FH+, dashed line).
Figure 2.
Distribution of SI and SG by Bergman Minimal Model analysis measured at study entry in individuals with no family history of diabetes (FH−, black) or with family history of diabetes (FH+, gray). Low and high SI and SG were defined in both groups by the median SI and SG, respectively, in the offspring of two type 2 diabetic parents (FH+) cohort.
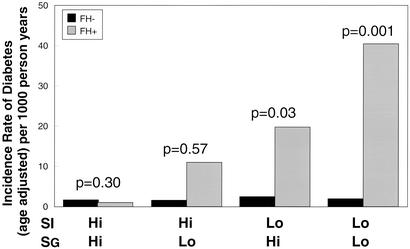
We have previously shown in the FH+ offspring cohort that low SI and low SG precede the development of diabetes (9). To determine whether this were also true for the FH− individuals, FH− subjects were divided into the same four subgroups and followed for an average of 25 years for development of diabetes. Life table analysis shows that the few cases of diabetes that did develop in the FH− were distributed almost equally across all four subgroups of SI and SG (Fig. 3). When the two groups with insulin resistance, i.e., low SI, in both populations were analyzed, there was a 10- to 20-fold greater age-adjusted incidence of diabetes in the offspring of two type 2 diabetic parents (FH+ group) than in the control (FH− group), even when matched for quartiles of glucose disposal. Division of the FH− group into quartiles based on median of the FH− group yields four equal sized groups, but does not alter the negative association of low SI and low SG with the subsequent development of diabetes, and multiple logistic regression analysis does not find SI and SG associated with development of diabetes within the FH− group (data not shown).
Figure 3.
Comparison of the cumulative risk of type 2 diabetes in individuals with no family history of diabetes (FH−, black) and offspring of two diabetic parents (FH+, gray) according to SI and SG at study entry with low and high SI and SG defined by median values in the offspring of two type 2 diabetic parents.
As fewer FH− individuals developed diabetes, several statistical methods were used to assess the presence or absence of a trend between low SI and low SG and development of diabetes. When the Cochran–Armitage test was used, there was a significant linear trend with SI and SG and risk of development of type 2 diabetes in the FH+ group (P < 10−7), but no evidence for a trend in the FH− group (P > 0.7). When the Cochran–Armitage test was reapplied by using coding categories to reflect the increased rate of development of disease as the risk category increases across insulin resistance in the FH+ group, the test for trend in the FH+ group remained highly significant (P < 10−7), but there was no evidence for a similar trend in the FH− group (P > 0.4). Furthermore, when we analyzed the results from our simulation reflecting the rates present in the FH+ group, which would assume risk of development of diabetes could be predicted by SI and SG quartile group classification in both cohorts equally, there was strong evidence that the trend in our data, if any, is significantly less than that in the FH+ group (P = 0.0322, with an approximate 99% confidence interval of 0.0317–0.0329). Thus, these categories of glucose disposal are poor predictors of development of diabetes in the FH− group.
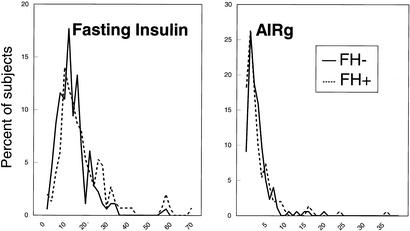
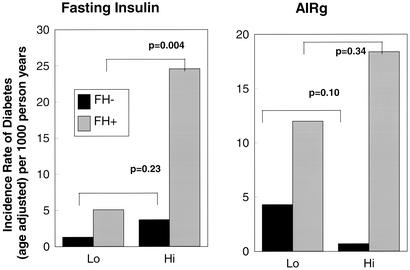
Both fasting insulin and the acute response of insulin to i.v. glucose measured at study entry were examined for their effects on the subsequent development of diabetes in the two cohorts. The distribution of values was shifted slightly leftward for fasting insulin and rightward for AIRg in the FH− group at study entry and when expressed on a logarithmic scale to account for distribution, FH− had significantly lower fasting insulin levels but higher dynamic response to glucose than the FH+ cohort (Fig. 4). The two cohorts were then divided into subgroups based on the median values for fasting insulin, and AIRg determined in the FH+ cohort. As previously noted (8), FH+ individuals who went on to develop diabetes tended to have elevated fasting insulin levels and high values of AIRg, consistent with their insulin resistant state. In contrast to the FH+ group where high fasting insulin was highly predictive of the development of diabetes, fasting insulin does not predict development of disease in FH− individuals. In the FH− cohort those who developed diabetes had statistically significant lower glucose stimulated insulin production than those who did not develop disease (log AIRg 1.49 ± 0.24 vs. 1.76 ± 0.27, P < 0.05). In contrast, in the FH+ cohort those who develop diabetes had a nonsignificantly higher acute insulin response than those who did not develop disease (log AIRg 1.74 ± 0.41 vs. 1.65 ± 0.32, P = 0.22) (Fig. 5). Thus, the excess diabetes in the offspring cannot be accounted for by decreased insulin secretion by these measurements. In addition, FH+ individuals were at greater risk of the development of diabetes regardless of their ability to secrete insulin.
Figure 4.
Distribution of fasting insulin (Left) and AIRg (Right) during an IVGTT performed at study entry, are demonstrated for the two populations FH+ and FH−.
Figure 5.
Incidence rates of type 2 diabetes in individuals with no family history of diabetes (FH−) and offspring of two diabetic parents (FH+) are shown according to fasting insulin (Left) and AIRg (Right) at study entry with low and high of each insulin parameter defined by median value of that parameter in the offspring of two type 2 diabetic parents at study entry.
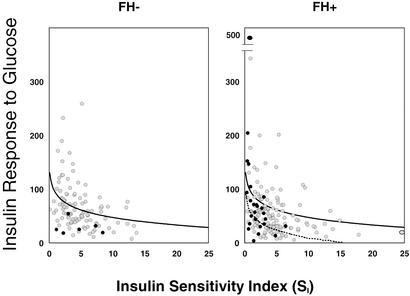
A more precise view of the relationship between insulin resistance and insulin secretion can be seen when these two variables are plotted one against the other to create a disposition index (18). As few FH− subjects subsequently went on to develop diabetes, a low disposition index was suggestive for diabetes but did not reach statistical significance (Fig. 6). Due to the small number of individuals who develop diabetes in the FH− cohort, we did not use multiple logistic regression techniques to assess multiple variables concurrently. Additionally, although the disposition index tended to be lower in the FH+ than in the FH− subjects, when considering the relationship within the FH+ group, a the low index seen in the prediabetic FH+ subjects was caused by the low SI.
Figure 6.
The logarithmic regression is shown between SI and the AIRg at study entry for individuals with no family history of diabetes (FH−) (Left) and for individuals with two parents with type 2 diabetes (FH+) (Right). Individuals who subsequently developed diabetes are shown by dark circles; individuals who did not develop disease during longitudinal evaluation are shown by light circles. In both panels, the solid line represents the regression relationship of the FH− cohort; in Right, the relationship of the FH+ cohort is shown by dotted line.
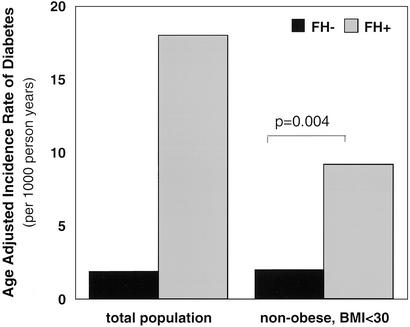
Obesity is a major predisposing factor to the development of diabetes and can affect both insulin secretion and insulin action (19–21). At the time of recruitment, the individuals who completed longitudinal evaluation in the FH− cohort were leaner than the FH+ cohort. Although it is not possible to completely exclude the impact of weight on the development of diabetes given the differences in baseline characteristics in the FH− and FH+ cohorts, to determine whether obesity was confounding the increased age-adjusted incidence rate of development of diabetes in the FH+ cohort, a subgroup analysis was performed focusing only on the nonobese FH− and FH+ individuals, i.e., individuals with a body mass index (BMI) <30. Obesity had little effect on the risk of development of diabetes in the FH− group. In the nonobese FH− group there was an age-adjusted incidence rate of type 2 diabetes of 1.6 per 1,000 person years, similar to that of the FH− group as a whole. In contrast, obesity had a large effect on the risk of development of diabetes in the FH+, which dropped from a rate of 16.7 to 8.8 per 1,000 person years in the nonobese FH+ group. However, even when focusing on the nonobese subgroups, the age-adjusted incidence of diabetes remained significantly lower in the FH− group than FH+ by a factor of four fold (Fig. 7), suggesting that the increased risk of diabetes could not be accounted for by differences in extreme weight between the two groups.
Figure 7.
The effect of obesity on the age-adjusted incidence rates for type 2 diabetes in FH− and FH+ groups are shown. On the left, the incidence rates are shown for all individuals in each cohort, and on the right, a subgroup analysis is shown for nonobese (BMI <30) FH− and FH+ subjects.
Discussion
Both insulin deficiency and insulin resistance are ultimately involved in the pathogenesis of type 2 diabetes. In an effort to define the earliest determinants of type 2 diabetes, we have performed long-term follow-up studies in normoglycemic, middle-aged adults who had no first-degree relatives with diabetes (FH−) as compared with offspring of two type 2 diabetic parents (FH+). Offspring of two type 2 diabetic parents have been shown to differ from control subjects by having lower glucose disposal rates and higher fasting and stimulated insulin levels in response to an i.v. glucose challenge (8). Furthermore, low SI and low SG were both found to precede the development of type 2 diabetes in the FH+ group, whereas first and second phase insulin secretion did not correlate with the development of the disease (9). These abnormalities in SI and SG were present in the population one to two decades before the diagnosis of type 2 diabetes. Thus, low SI and SG can predict risk of subsequent development of type 2 diabetes in the offspring of two type 2 diabetic parents, but their ability to predict disease in populations at lower genetic risk for diabetes was uncertain.
Insulin resistance has been demonstrated to be a familial trait, and SI and SG have been demonstrated to cluster in families in a manner consistent with polygenic determination (4, 22, 23). Although the original populations were selected to be similar in age and sex, the current study shows that fewer individuals with no family history of diabetes demonstrate a comparable severity of insulin resistance to the FH+ group. The current study also demonstrates that low SI and low SG do not precede the development of type 2 diabetes in subjects with no family history of diabetes nor account for the difference in incidence rate between offspring of two type 2 diabetic parents and controls. Although the number of cases of diabetes in the FH− cohort was low, the number of persons who developed diabetes are consistent with other epidemiology studies (16). If insulin resistance were sufficient to predict the development of diabetes, one would expect the cases of diabetes in the FH− cohort to come from the most resistant subgroup. Indeed, despite the longer period of follow-up in the FH− group, there was a 90–95% lower age-adjusted incidence of diabetes seen in the FH− individuals when compared with the offspring of two type 2 diabetic parents and matched for quartile of low SI. Waist-to-hip ratio, total body fat, and free fatty acids have been suggested to be good surrogate measurements for the development of type 2 diabetes but were not measured baseline. Although the two groups were not equal in BMI at the time of recruitment as seen in other studies (24) and could play a role in the development of disease (25), after multiple logistic regression analysis to adjust for differences in rates of obesity, insulin resistance remained a positive predictor for diabetes in the FH+ group only, with a persistent four-fold greater risk of disease in the lean insulin resistant offspring as compared with the FH− insulin resistant individuals. These findings provide compelling evidence that a factor, other than SI and SG, must be present in the FH+ group to account for their greater rate of diabetes. In the absence of this factor in the FH− control group, insulin resistance (as demonstrated by low SI and low SG) is not sufficient to cause diabetes. Thus, this familial factor somehow interacts in an epistatic manner with insulin resistance to allow development of type 2 diabetes.
Insulin secretion must be closely balanced to insulin resistance and previous studies have demonstrated that first and second phase plasma insulin and C-peptide response to a continuous infusion of i.v. glucose may be lower in glucose intolerant first degree relatives of patients with type 2 diabetes when compared with normoglycemic relatives or controls (26). In comparison of the FH+ and FH− populations at study entry, a time when both populations were normoglycemic, there was little or no detectable difference in insulin secretion as assessed by fasting insulin, area under the curve following i.v. glucose challenge, or first or second phase insulin. Thus, although deficient insulin secretion is an important feature of clinical diabetes, there was no evidence of impaired fasting insulin, or the insulin response to glucose predating diabetes in either cohort, and the increased incidence of type 2 diabetes in the FH+ group cannot be explained by differences in these early measurements of β cell function. It is possible that other measures of insulin secretion, such as pulsatile secretion, would be more predictive.
A hyperbolic relationship between insulin secretion and action has been described (18), referred to as the disposition index, suggesting that SI and insulin secretion are linked through a negative feedback loop. In this model, as an individual becomes more insulin resistant β cell function is enhanced (27). A lower disposition index has been demonstrated in several populations at increased risk for the development of type 2 diabetes, including women with polycystic ovarian syndrome (28) or previous history of gestational diabetes mellitus (18, 29). The AIRg normalized for insulin resistance has been shown to be a heritable trait in Caucasian type 2 diabetic kindreds (4, 30). None of the reported studies have followed the subjects with low disposition indices over time for the development of diabetes. The FH− prediabetic subjects tended to have a low disposition index, but due to the low rate of development of diabetes among the FH− subjects this finding was not statistically significant. The low disposition index prediction of the development of diabetes in the FH+ group was largely driven by SI.
The exact nature of the missing familial factor is unclear, but could involve proteins involved in insulin signal transduction downstream of the insulin receptor itself. In a polygenic mouse model of type 2 diabetes involving heterozygous deletion of the insulin receptor and insulin receptor substrate-1 (IRS-1), the development of diabetes is highly dependent on the genetic background of the mouse ranging from <5% to >80% in different strains (R. K. Kulkarni, K. Almind, R. L. Quinn, D. Eisenman, and C.R.K., unpublished data). An analogous situation may be true in humans. As the FH+ cohort was selected as offspring of two type 2 parents, as opposed to a single affected parent, it is possible that the familial factor imparting increased risk for the development of type 2 diabetes could be a recessive genetic trait. Although these studies do not exclude the possibility that dietary, exercise or other environmental factor(s) in the presence of insulin resistance account for the different rates of development of disease, this seems much less likely. Further studies are needed to identify this familial, likely genetic factor, which in the presence of insulin resistance leads to the development of type 2 diabetes as a potentially important target in prevention or treatment of this disease.
Acknowledgments
This work was supported in part by National Institutes of Health Grants K23-DK02795, RO1-DK33201, RO1-DK45935, P30 DK36836, and M01 RR01032.
Abbreviations
- FH+
family history of diabetes
- FH−
no family history of diabetes
- IVGTT
i.v. glucose tolerance test
- SI
insulin sensitivity
- SG
insulin-independent glucose effectiveness
- AIRg
acute insulin response to glucose
- BMI
body mass index
References
- 1.DeFronzo R A. Diabetes. 1988;37:667–687. doi: 10.2337/diab.37.6.667. [DOI] [PubMed] [Google Scholar]
- 2.Rossetti L, Giaccari A, DeFronzo R A. Diabetes Care. 1990;13:610–630. doi: 10.2337/diacare.13.6.610. [DOI] [PubMed] [Google Scholar]
- 3.Warram J H, Martin B C, Soeldner J S, Krolewski A S. Adv Exp Med Biol. 1988;246:175–179. doi: 10.1007/978-1-4684-5616-5_21. [DOI] [PubMed] [Google Scholar]
- 4.Watanabe R M, Valle T, Hauser E R, Ghosh S, Eriksson J, Kohtamaki K, Ehnholm C, Tuomilehto J, Collins F S, Bergman R N, et al. Hum Hered. 1999;49:159–168. doi: 10.1159/000022865. [DOI] [PubMed] [Google Scholar]
- 5.Haffner S M, Stern M P, Hazuda H P, Pugh J A, Patterson J K. N Engl J Med. 1986;315:220–224. doi: 10.1056/NEJM198607243150403. [DOI] [PubMed] [Google Scholar]
- 6.Haffner S M, Stern M P, Hazuda H P, Mitchell B D, Paterson J K. N Engl J Med. 1988;319:1297–1301. doi: 10.1056/NEJM198811173192001. [DOI] [PubMed] [Google Scholar]
- 7.Lillioja S, Mott D M, Howard B V, Bennett P H, Yki-Jariven H, Freymond B L, Nyomba F, Zurlo B, Swinburn B, Bogardus C. N Engl J Med. 1988;318:1217–1225. doi: 10.1056/NEJM198805123181901. [DOI] [PubMed] [Google Scholar]
- 8.Kahn C R, Hedo J, Kasuga M. In: Proceedings of the International Symposium on Hormone Receptors and Receptor Diseases, Kyoto, August 29–30, 1982. Imura H, Kuzuya H, editors. Amsterdam: Excerpta Medica; 1983. pp. 3–11. [Google Scholar]
- 9.Martin B C, Warram J, Krolewski A S, Bergman R N, Soeldner J S, Kahn C R. Lancet. 1992;340:925–929. doi: 10.1016/0140-6736(92)92814-v. [DOI] [PubMed] [Google Scholar]
- 10.Eriksson J, Franssila-Kallunki A, Ekstrand A, Saloranta C, Widen E, Schalin C, Groop L. N Engl J Med. 1989;321:337–343. doi: 10.1056/NEJM198908103210601. [DOI] [PubMed] [Google Scholar]
- 11.Ward W, Bearc J, Halter J, Pfeifer M, Porte D J. Diabetes Care. 1984;5:491–502. doi: 10.2337/diacare.7.5.491. [DOI] [PubMed] [Google Scholar]
- 12.Kahn S E, Porte D., Jr Am J Med. 1988;85,(Suppl. 5A):4–8. doi: 10.1016/0002-9343(88)90392-0. [DOI] [PubMed] [Google Scholar]
- 13.Koivisto V A, Soman V, Conrad P, Hendler R, Nadel E, Felig P. J Clin Invest. 1979;64:1011–1015. doi: 10.1172/JCI109537. [DOI] [PMC free article] [PubMed] [Google Scholar]
- 14.National Diabetes Data Group. Diabetes. 1979;28:1039–1057. doi: 10.2337/diab.28.12.1039. [DOI] [PubMed] [Google Scholar]
- 15.Bergman R N. Diabetes. 1989;38:1512–1527. doi: 10.2337/diab.38.12.1512. [DOI] [PubMed] [Google Scholar]
- 16.Butler W J, Ostrander L D, Carman W J, Lamphiear D E. Am J Epidemiol. 1982;116:971–980. doi: 10.1093/oxfordjournals.aje.a113499. [DOI] [PubMed] [Google Scholar]
- 17.Melton L J, Palumbo P J, Chu D P. Diabetes Care. 1983;6:75–86. doi: 10.2337/diacare.6.1.75. [DOI] [PubMed] [Google Scholar]
- 18.Kahn S E, Prigeon R L, McCulloch D K, Boyko E J, Bergman R N, Schwartz M W, Neifing J L, Ward W K, Beard J C, Palmer J P, et al. Diabetes. 1993;42:1663–1672. doi: 10.2337/diab.42.11.1663. [DOI] [PubMed] [Google Scholar]
- 19.Beard J, Ward W, Halter J, Wallum B, Porte D J. J Clin Endocrinol Metab. 1987;1:59–64. doi: 10.1210/jcem-65-1-59. [DOI] [PubMed] [Google Scholar]
- 20.Lillioja S, Bogardus C. Diabetes Metab Rev. 1988;5:517–540. doi: 10.1002/dmr.5610040508. [DOI] [PubMed] [Google Scholar]
- 21.Evans D, Murray R, Kissebah A. J Clin Invest. 1984;4:1515–1525. doi: 10.1172/JCI111565. [DOI] [PMC free article] [PubMed] [Google Scholar]
- 22.Lillioja S, Mott D M, Zawadzki J K, Young A A, Abbott W G, Knowler W C, Bennett P H, Moll P, Bogardus C. Diabetes. 1987;36:1329–1335. doi: 10.2337/diab.36.11.1329. [DOI] [PubMed] [Google Scholar]
- 23.Martin B C, Warram J H, Rosner B, Rich S S, Soeldner J S, Krolewski A S. Diabetes. 1992;41:850–854. doi: 10.2337/diab.41.7.850. [DOI] [PubMed] [Google Scholar]
- 24.Ramachandran A, Snehalatha C, Satyavani K, Sivasankari S, Vijay V. Diabetes Obes Metab. 2000;2:149–154. doi: 10.1046/j.1463-1326.2000.00067.x. [DOI] [PubMed] [Google Scholar]
- 25.Rodriguez-Moran M, Guerrero-Romero F. Arch Med Res. 2000;31:399–403. doi: 10.1016/s0188-4409(00)00089-8. [DOI] [PubMed] [Google Scholar]
- 26. O'Rahilly, S., Nugent, Z., Rudenski, A. S., Hosker, J. P., Burnett, M. A., Darling, P. & Turner, R. C. (1986) Lancet 360–363. [DOI] [PubMed]
- 27.Bergman R N, Phillips L S, Cobelli C. J Clin Invest. 1981;68:1465–1467. doi: 10.1172/JCI110398. [DOI] [PMC free article] [PubMed] [Google Scholar]
- 28.Dunaif A, Finegood D T. J Clin Endocrinol Metab. 1996;81:942–947. doi: 10.1210/jcem.81.3.8772555. [DOI] [PubMed] [Google Scholar]
- 29.Ward W K, Johnston S L W, Beard J C, Benedette T J, Halter J B, Porte D J. Diabetes. 1985;34:861–869. doi: 10.2337/diab.34.9.861. [DOI] [PubMed] [Google Scholar]
- 30.Elbein S, Hasstedt S, Wegner K, Kahn C R. J Clin Endocrinol Metab. 1999;4:1398–1403. doi: 10.1210/jcem.84.4.5604. [DOI] [PubMed] [Google Scholar]


