Abstract
Chondromodulin I (ChM-I) was supposed from its limited expression in cartilage and its functions in cultured chondrocytes as a major regulator in cartilage development. Here, we generated mice deficient in ChM-I by targeted disruption of the ChM-I gene. No overt abnormality was detected in endochondral bone formation during embryogenesis and cartilage development during growth stages of ChM-I−/− mice. However, a significant increase in bone mineral density with lowered bone resorption with respect to formation was unexpectedly found in adult ChM-I−/− mice. Thus, the present study established that ChM-I is a bone remodeling factor.
Endochondral bone development during embryogenesis and longitudinal bone growth in growing vertebrates require continuous cartilage growth (18). Proliferating chondrocytes originate from a region of resting chondrocytes, differentiate first into prehypertrophic chondrocytes and then into hypertrophic chondrocytes able to secrete the cartilage matrix. Through invasion by blood vessels, the calcified cartilage and vascular matrix are gradually replaced by bone matrix with the recruitment of osteoclasts and osteoblasts that mediate bone resorption and formation and eventual bone remodeling (1, 30). Thus, in bone growth, blood vessel invasion into cartilage is pivotal to the process of endochondral bone formation.
Distinct classes of factors are thought to play cognate roles in the spatiotemporal regulation of the complicated yet sequential processes of cartilage differentiation and bone formation, particularly in angiogenic events. Fibroblast growth factor-2 (5, 31), transforming growth factor β (3), and vascular endothelial growth factor (4) are expressed in cartilage and have been identified as strong angiogenic agents. However, these factors are also present in avascular cartilage and in surrounding vascular regions. These findings raise the possibility that the actions of angiogenic factors may be suppressed by the inhibitory action of a specific factor in avascular cartilage. While tissue inhibitors of matrix metalloproteinase 1 and 2 have been identified from cartilage as possible angiogenesis inhibitors, they are also expressed in other tissues (20). The search for a cartilage-specific inhibitor of angiogenesis led to the identification of chondromodulin I (ChM-I), initially isolated from bovine epiphyseal cartilage as a factor with growth-promoting activity on cultured chondrocytes (10). ChM-I was found to be a potent stimulator of proteoglycan synthesis in growth plate chondrocytes and of chondrocyte colony formation in agarose (12). However, ChM-I inhibited cultured vascular endothelial cell tube morphogenesis and growth (8, 9). Thus, the physiological significance of ChM-I during endochondral bone formation as a bifunctional factor of chondrocyte growth and angiogenesis inhibition was suggested from distinct lines of evidence in vitro (27). However, due to the lack of mice deficient in ChM-I, there has been no information regarding the physiological role of ChM-I.
In the present study, we disrupted the murine ChM-I gene by homologous recombination to generate ChM-I knockout (ChM-I−/−) mice. Homozygous ChM-I−/− mice were born without overt abnormalities and grew normally. Unexpectedly, ChM-I−/− mice exhibited no aberrations in endochondral bone formation during embryogenesis or in cartilage development during growth stages. However, a significant increase in bone mineral density was observed in 12-week-old ChM-I−/− mice. Analyses of bone formation and resorption indicators revealed that bone minerals accumulated in ChM-I−/− mice due to lowered bone resorption with respect to formation. Thus, our study revealed that the physiological role of ChM-I appears to be involved in the stimulation of bone remodeling through control of osteoclast and osteoblast functions rather than in cartilage development in intact animals.
MATERIALS AND METHODS
Gene targeting.
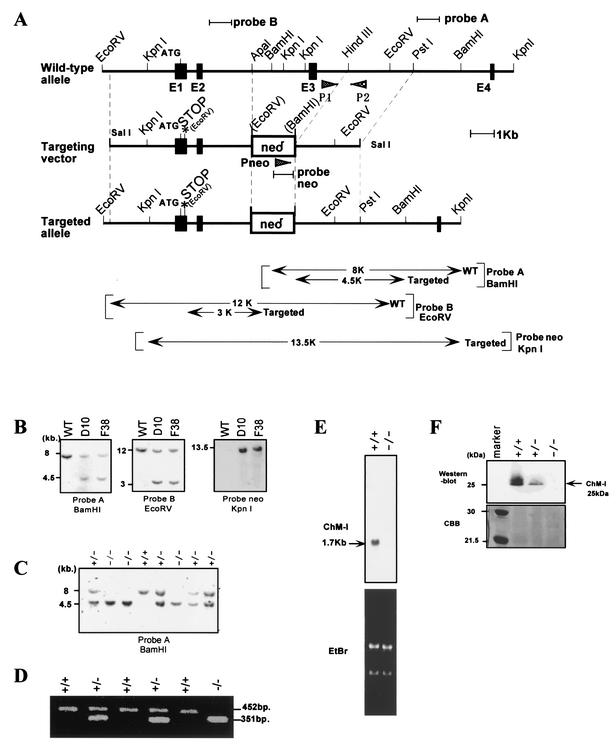
A TT2 embryonic stem (ES) cell (34) genomic library was screened with a mouse ChM-I cDNA probe (24). A 9-kb fragment of mouse ChM-I containing the coding exons 1 to 3 was used to construct a targeting vector. A stop mutation was introduced at the beginning of the ChM-I coding region, and 3.5-kb fragment containing exon 3 was replaced with a phosphoglycerate kinase-neomycin cassette. TT2 ES cells were transfected with a linearized targeting vector (25 μg per 1.0 × 10⁷ cells) by using a Bio-Rad Gene Pulser II at 250 V and 500 μF and grown under G418 selection as described previously (23, 36). Targeted ES cell clones were identified by Southern blot analysis with probe A and probe NEO (Fig. 1A) and were aggregated with CD-1 single 8-cell embryos to generate chimeras as described previously (23, 36). Chimeras were crossed with C57BL/6 female mice to produce germ line transmission of the targeted allele. Offspring were genotyped either by Southern blotting with probe A or by PCR with the three specific primers P1 (5′-TTGGTTGATGCTTCAGTGTG-3′), P2 (5′-CTTGTGCACAGACCAGAACAA-3′), and Pneo (5′-CCGCTTCCTCGTGCTTTACGG-3′). Temperature cycling conditions were as follows: denaturation at 95°C for 2 min followed by 35 cycles of 95°C for 1 min, 54°C for 1 min, and 72°C for 1.5 min.
FIG. 1.
Disruption of the mouse ChM-I gene. (A) Schematic representation of the ChM-I gene locus (top), gene targeting vector (middle), and the recombinated locus (bottom).The digested fragments detected by probe A, probe B, and probe NEO are indicated by bars. (B) Southern blot analysis of targeted ES clones. The targeting frequency was 0.3%. The presence of the 4.5-kb BamHI fragment indicates proper targeting of the ChM-I locus, and the 3-kb EcoRV fragment indicates the introduction of the stop mutation. (C) Southern blot analysis of tail DNA from the offspring of heterozygous mates with probe A as described for panel B. (D) PCR genotyping of embryos at e13.5 of heterozygous matings with three primers (P1, P2, Pneo) as indicated in panel A. Primer 1 and primer 2 were used to detect the wild-type (WT) allele (amplification of a 452-bp fragment). Primer 2 and primer NEO were used to detect the targeted allele (amplification of a 351-bp fragment). (E) Northern blot analysis of RNA from ChM-I+/+ and ChM-I−/− mice in the top panel. The bottom panel shows ethidium bromide (EtBr) staining of the RNA used. (F) Western blot analysis confirming the absence of ChM-I protein with an anti-rhChM-I polyclonal antibody. The top panel shows the immunoreactivity after hybridization with anti-ChM-I antibody. The bottom panel shows Coomassie brilliant blue staining of the SDS-polyacrylamide gel electrophoresis gel.
Northern blot analysis.
Total RNA was prepared from rib cartilage of 3- to 4-week-old ChM-I+/+ or ChM-I−/− mice by a single-step method (35). Total RNA (15 μg) was separated by electrophoresis on a 1% agarose formaldehyde gel and transferred onto a Nytran filter with Turboblotter (Schleicher and Schuell). The filter was then hybridized with a 32P-labeled probe that is an 822-bp EcoRI fragment from nucleotides 628 to 1449 of the ChM-I cDNA. After hybridization, the filter was washed at 55°C for 30 min in 1× SSPE (1× SSPE is 0.18 M NaCl, 10 mM NaH2PO4, and 1 mM EDTA [pH7.7])-0.1% sodium dodecyl sulfate (SDS) once, then washed at 55°C for 30 min in 0.1× SSPE-0.1% SDS twice. The filter was exposed to BIOMAX film (Eastman Kodak) at −80°C.
Western blot analysis.
Whole ribs from 3-week-old mice were homogenized in extraction buffer {20 mM MES [2-(N-morpholino)ethanesulfonic acid]-NaOH [pH 6.0], 0.1 M aminocaproate, 6 M guanidium chloride} at 4°C and centrifuged at 10,000 × g. The supernatant was diluted with 2 volumes of distilled water and applied to a butyl-toyopearl 650 affinity column OSOH. The column was washed three times with distilled water. Bound proteins were eluted by 70% ethanol and dried. The dried materials (8 μg) were dissolved in Laemmli buffer, electrophoresed by SDS-15% polyacrylamide gel electrophoresis, and blotted onto an Immobilon-P membrane (Millipore). Bands that were immunoreactive with an anti-ChM-I polyclonal antibody for the C-terminal peptides of the mature form of human ChM-I, corresponding to the Asp252 to Val334 residues, which is a highly conserved region among species (26), were stained by using enhanced chemiluminescence methods (Amersham Biosciences).
Morphology and histological analyses.
For cleared skeletal preparations (23), embryos from embryonic day 13.5 (e13.5) were fixed in 99.5% ethanol for 4 days and transferred to acetone. After 3 days, they were rinsed with water and stained for 10 days in a staining solution consisting of 1 volume of 0.1% Alizarin red S (Sigma) in 95% ethanol, 1 volume of 0.3% Alcian blue 8GX (Sigma) in 70% ethanol, 1 volume of 100% acetic acid, and 17 volumes of ethanol. After rinsing with 96% ethanol, specimens were kept in 20% glycerol-1% KOH at room temperature until the skeletons became clearly visible. For hematoxylin-fast green-safranin O staining, bones were fixed in 4% paraformaldehyde overnight and decalcified in Morse’s solution (10% [wt/vol] sodium citrate, 22.5% [vol/vol] formic acid) overnight prior to embedding in paraffin. For Villanueva Goldner, toluidine blue, and tartartic acid resistance alkaline phosphatase (TRAP) staining, tibiae were embedded in glycolmethacrylate without decalcification (36) (see below).
Bone radiographic analysis and histomorphometry.
For radiographic analysis, femora from male weight-matched mice were dissected free of soft tissues and subjected to radiographic analysis with a soft X-ray apparatus (model CMB-2; SOFTEX) (36). Bone mineral density was measured by dual energy X-ray absorptiometry with a bone mineral analyzer (PIXImus2; GE Medical Systems). For in vivo fluorescent labeling (21), a single intraperitoneal injection of calcein (1.6 mg/kg of body weight) was administrated at days 0 and 4. Mice were sacrificed at day 5. Tibiae were fixed in 99.5% ethanol and embedded in glycolmethacrylate without decalcification. Longitudinal serial sections (7 μm thick) were prepared with a microtome (model 2050; Reichert Jung). The sections were stained with Villanueva Goldner to discriminate between mineralized and unmineralized bone and to identify cellular components (36). Images were visualized by fluorescent microscopy. Histomorphometry of bone sections was performed for at least eight optical fields of the secondary spongiosa with a semiautomated system for bone analysis (Osteoplan II; Carl Zeiss) at 200-fold magnification (17). All sections were examined blind. Nomenclature, symbols, and units are those recommended by the Nomenclature Committee of the American Society for Bone and Mineral Research (22).
Reverse transcription-PCR analysis.
For the isolation osteoblasts for primary culture, calvaria from newborn C57BL/6 mice were dissected into pieces with scissors and cultured in α-minimal essential medium (α-MEM) containing 10% heat-inactivated fetal bovine serum (FBS) at 37°C in 5% CO2. After the cells were grown to subconfluence, total cellular RNA was extracted as previously described (35). Femora and tibiae were dissected free of adherent tissues and epiphyseal cartilage, and the bone marrow was flushed out. The total RNA of the bone was prepared from several mice (12-week-old mice). For isolation of osteoclasts, primary calvarial osteoblasts (1.5 × 10⁶ cells/dish) and bone marrow cells (107 cells/dish) were cocultured in α-MEM supplemented with 10% FBS, 1α,25-dihydroxy vitamin D3 (10−8 M) and prostaglandin E2 (10−6 M) in 100-mm-diameter dishes precoated with type I collagen gel (cell matrix type-IA; Nitta Gelatin) (28). Osteoclasts were formed within 7 days in the coculture, and differentiated osteoclasts were collected as described previously (16). The purified osteoclasts in this preparation were subjected to total RNA extraction. First-strand cDNA was synthesized from total RNA with oligo(dT)12-18 primer with the Super Script II preamplification system (Life Technologies) and subjected to PCR amplification with Ex Taq polymerase (TaKaRa) and the specific pair of primers mChM-If (in exon 5) (5′-CTTAAGCCCATGTATCCAAA-3′) and mChM-Ir (in exon 7) (5′-CCAGTGGTTCACAGATCTTC-3′). Temperature cycling conditions were as follows: denaturation at 96°C for 3 min followed by 30 cycles of 96°C for 30s, 60°C for 1 min, and 72°C for 30s.
In vitro osteoclastogenesis.
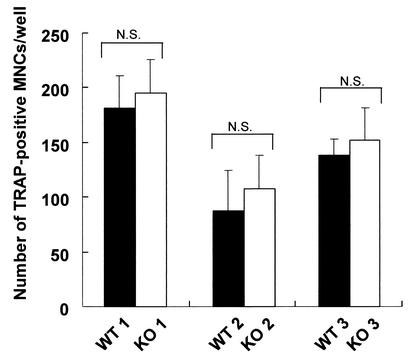
Bone marrow macrophages were isolated from whole tibial bone marrow of 12-week-old mice (n = 3) and cultured in α-MEM containing 10% heat-inactivated FBS at 37°C in 5% CO2 (16). After 24 h in culture, the nonadherent cells were collected and replaced in a 96-well plate (2 × 10⁵ cells/well) in α-MEM supplemented with 10% heat-inactivated FBS at 37°C in 5% CO2 in the presence of 100 ng of recombinant human macrophage colony-stimulating factor (rhM-CSF) (leukoprol; Kyowa Hakko Kogyo)/ml. Cells were stimulated with 100 ng of soluble recombinant human receptor activator of nuclear factor-κB ligand (rhRANKL; Pepro Teck EC Ltd.)/ml on day 4 in the presence of 100 ng of rhM-CSF/ml. Cells were fixed and stained for TRAP as described previously (29) on day 9 or 10. TRAP-positive multinucleated cells containing three or more nuclei were counted as osteoclasts under microscopic examination. The results were expressed as the means ± standard deviations of four wells.
Serum and urinary indicators.
Blood from 12-week-old male mice was collected by heart puncture under nembutal (Dainippon Pharmaceutical Co.) anesthesia. The levels of calcium, phosphorus, and alkaline phosphatase activity in serum were measured by using a calcium HR kit (Wako), inorganic phosphorus II kit (Wako), and liquitech alkaline phosphatase kit (Roche Diagnostic), respectively, with an autoanalyzer (type 7170; Hitachi) (36). The levels of osteocalcin in serum were measured by using the competitive radioimmunoassay kit by Biomedical Technologies, Inc. The urinary excretion of deoxypyridinoline cross-links, a marker of bone resorption (32), was measured in urine samples by using the Pyriliks-D enzyme-linked immunosorbent assay (Metra Biosystems). Results were expressed in nanomoles per millimole of urinary creatinine (Cr), as measured by a standard colorimetric technique with an autoanalyzer (type 7170; Hitachi).
RESULTS
Generation of targeted ChM-I-null mice.
We disrupted the murine ChM-I gene in ES cells by homologous recombination to generate ChM-I−/− mice. The targeting vector (Fig. 1A) was constructed to introduce a stop codon at Cys-21, and a 3.5-kb genomic fragment containing exon 3 was replaced by a phosphoglycerate kinase-neomycin cassette. No overt abnormalities were found in ChM-I+/− mice, and crossbreeding of ChM-I+/− mice produced normal numbers of pups of all three possible genotypes (Fig. 1C) with the expected Mendelian distribution (61 +/+ mice, 128 +/− mice, and 56 −/− mice, for a total of 245 offspring) (Fig. 1B and C). Northern blot analysis of rib cartilage from normal mice with a cDNA probe encoding the mature form of ChM-I protein detected a single 1.7-kb transcript. No transcripts were found in ChM-I−/− mice, confirming the disruption of the ChM-I gene (Fig. 1E). Western blot analysis of whole-rib extracts from ChM-I−/− mice with an antibody against the mature ChM-I protein also confirmed the absence of the ChM-I protein (Fig. 1F).
ChM-I is not required for cartilage development and endochondral bone formation.
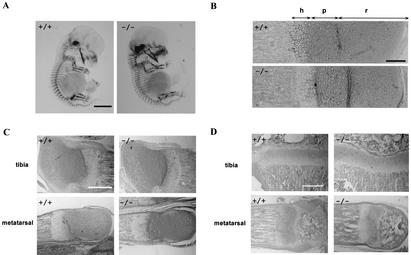
ChM-I−/− mice grew normally with no discernible physical defects and with normal fertility. As ChM-I had been implicated in cartilage development, endochondral bone formation, and morphogenesis of the eye, careful histological examination of these tissues from ChM-I−/− mouse embryos and mice at various growth stages was performed. However, we failed to defect any abnormalities in cartilage formation (Fig. 2A), first ossification (Fig. 2B) in ChM-I−/− fetuses, and secondary ossification in ChM-I−/− mice at 1 and 3 weeks old (Fig. 2C and D), in agreement with normal growth of ChM-I−/− mice.
FIG. 2.
No abnormality in cartilage development and endochondral bone formation of ChM-I−/− mice. (A) Alizarin red and Alcian blue staining of e13.5 embryos. Bar, 2 mm. (B) Safranin O-fast green-hematoxylin staining of proximal growth plate of tibiae from e18.5 embryos. Bar, 0.1 mm. h, hypertrophic zone; p, proliferating zone; r, resting zone. (C) Safranin O-fast green-hematoxylin staining of epiphyses from 1-week-old mice. Bar, 0.5 mm. (D) Safranin O-fast green-hematoxylin staining of epiphyses from 3-week-old mice. Bar, 0.5 mm. In all panels, no overt difference was detected between ChM-I+/+ and ChM-I−/− mice.
Mice homozygous for the ChM-I mutation exhibit increased bone mineral density.
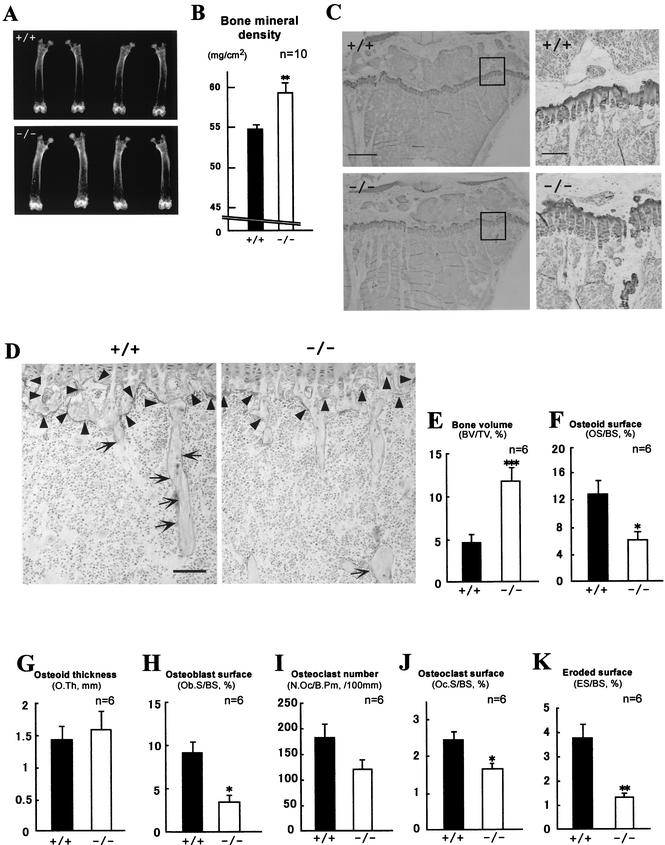
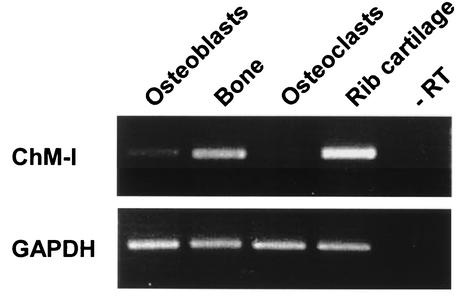
Unexpectedly, a significant increase in bone mineral density was observed in 12-week-old ChM-I−/− mice but not in ChM-I+/− mice. Also, the radiographic mineral density of the femur in mutant mice was approximately 10% higher than in wild-type mice (Fig. 3A and B). Histomorphometric analyses confirmed that trabecular bone volumes (bone volume per tissue volume) in mutant mice were 2.5-fold higher than in wild-type mice (Fig. 3C and E). However, no significant differences in bone or body size and shape were observed between ChM-I−/− and wild-type mice. Osteoid surfaces (osteoid surface per bone surface) in mutant mice were 54% lower than in wild-type mice (Fig. 3F), but the osteoid thickness value in mutant mice was equivalent to that in wild-type mice (Fig. 3G). Indeed, the expression of the ChM-I gene was detected in the primary culture osteoblasts and total bone, though their expression levels appear to be much lower than those in cartilage (Fig. 4).
FIG.3.
Increased bone mineral density in ChM-I−/− mice (12 weeks of age). (A and B) Radiological analyses of femora. (A) Plain X-ray images of femora. (B) Bone mineral density of femora measured by dual-energy X-ray absorptiometry. Bars represent means ± standard errors for wild-type (black bars) and mutant (white bars) mice. **, P < 0.01 between the two groups. Statistical differences between groups were assessed by Student's t test. (C and D) Histological analyses of proximal tibiae. (C) Undecalcified plastic sections were stained with toluidine blue, which stains cartilage violet and bone clear. The panels on the right are higher magnifications of the boxed areas in the panels on the left. Bars, 0.5 mm (left) and 0.1 mm (right). (D) Undecalcified plastic sections were stained with TRAP, which stains mature chondroclasts (arrowheads) and osteoclasts (arrows) red. Bar, 0.1 mm. (E to K) Static bone histomorphometric analyses of trabecular bones in proximal tibiae from 12-week-old mice. (E) Percent bone volume per tissue volume (BV/TV) represents the ratio of bone volume to tissue volume and estimates bone mass. Percent osteoid surface per bone surface (OS/BS) (F) and osteoid thickness (O.Th) (G) represent the proportion and thickness of bone surface covered with unmineralized matrix, respectively. (H) Percent osteoblast surface per bone surface (Ob.S/BS) represents the proportion of bone surface covered with osteoblasts. Osteoclast number per bone perimeter (N.Oc/B.Pm) (I) and percent osteoclast surface per bone surface (Oc.S/BS) (J) estimate bone resorption as osteoclast number and surface, respectively, divided by bone surface. (K) Eroded surface represents the function of osteoclasts. ES/BS, eroded surface per bone surface. Bars represent means ± standard errors for wild-type (black bars) and mutant (white bars) mice. Asterisks indicate statistically significant differences between the two groups. *, **, and *** indicate P values of <0.05, <0.01, <0.005, respectively.
FIG. 4.
ChM-I mRNA expression in bone. The top panel shows the ChM-I transcripts. The bottom panel shows glyceraldehydes-3-phosphate dehydrogenase (GAPDH) transcripts. Primary calvarial osteoblasts from newborn wild-type mice were cultured as described in Materials and Methods. Bones from wild-type 12-week-old mice were prepared as described in Materials and Methods. Osteoclasts were purified from coculture bone marrow cells with calvarial osteoblasts. Rib cartilage from 4-week-old wild-type mice was dissected free of adherent soft tissues. Reverse transcription-PCRs performed in the absence of reverse transcriptase (−RT) failed to detect any transcripts (representative lane shown).
As it was possible that the observed increase in bone mineral density was related to bone remodeling (2), we studied bone formation and resorption in terms of osteoblast and osteoclast function. TRAP-positive mature osteoclast and chondroclast numbers were reduced in ChM-I−/− mice (Fig. 3D). This was in agreement with the results of histomorphometry analyses that showed that the numbers of bone osteoclasts (osteoclast number per bone perimeter) and surface osteoclasts (osteoclast surface per bone surface) in ChM-I−/− mice were 33 and 34% lower than in wild-type mice, respectively (Fig. 3H and I). Eroded surface (eroded surface per bone surface) values, which represent osteoclast activity, were also significantly decreased in ChM-I−/− mice (Fig. 3J). In addition, osteoblast surface (osteoblast surface per bone surface) values, a reliable histomorphometric indicator of active osteoblast numbers, were significantly reduced to approximately 60% by ChM-I inactivation (Fig. 3K). Reflecting the reduced osteoclast and/or chondroclast activity in ChM-I−/− mice, more cartilaginous matrix remained in the first spongiosa of tibiae in the ChM-I−/− mice than in wild-type mice (Fig. 3C, right).
Loss of ChM-I affects bone metabolism.
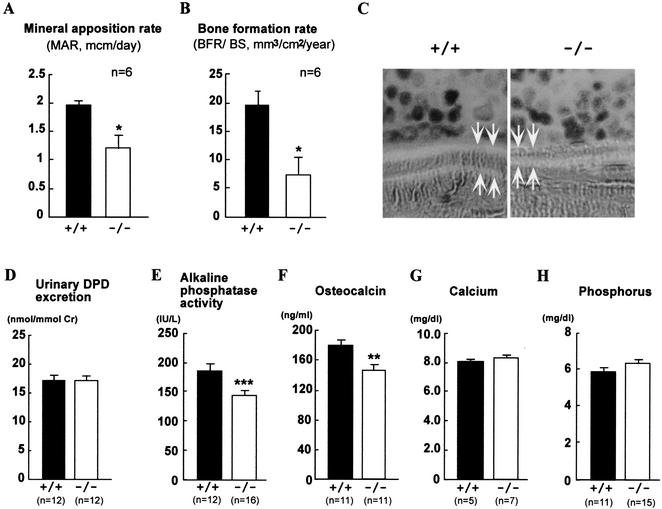
We then estimated the bone formation rate directly by using calcein double-labeling of the mineralized matrix (22). Both the mineral apposition rate (MAR) and bone formation rate (BFR) (BFR per bone surface) were significantly decreased in ChM-I−/− mice (Fig. 5A, B, and C). Reduced levels in serum of markers for osteoblastic function (alkaline phosphatase activity and osteocalcin) (Fig. 5E and F) and no alteration in serum minerals (Fig. 5G, H) supported the hypothesis that bone formation activity was reduced by ChM-I inactivation. Total urinary deoxypyridinoline levels, a marker of bone resorption, were measured by enzyme-linked immunosorbent assay; however, no statistical difference was observed between wild-type and ChM-I−/− mice (Fig. 5D). Moreover, in vitro osteoclastogenesis with donor bone marrow macrophages from mutant and wild-type mice revealed that ChM-I inactivation appears to cause no abnormality in osteoclastogenesis (Fig. 6). Our results indicated that the increased bone mineral density in ChM-I−/− mice appeared to be due to lowered bone resorption with respect to bone formation. Thus, the present study established that ChM-I is likely to be a bone remodeling factor rather than being involved in chondrocyte development.
FIG. 5.
Dynamic histomorphometric and serum biochemical parameters of bone metabolism in ChM-I+/+ and ChM-I−/− mice (12 weeks of age). MAR (A) and BFR (B) are using sections from animals that were double-labeled with calcein in vivo. MAR and BFR measure the amount of bone that is mineralized or deposited per time unit and are based on the measurement of the distance between the two fluorescent labels. (C) Two calcein-labeled mineralization fronts of tibiae trabecular bones from ChM-I+/+ and ChM-I−/− mice were visualized by fluorescent micrography. (D) Urinary deoxypyridinoline (DPD) excretion in 12-week-old wild-type and ChM-I−/− mice. (E) Alkaline phosphatase activity in serum. (F) Osteocalcin level in serum. (G) Calcium level in serum. (H) Phosphorus level in serum. Bars represent means ± standard errors for wild-type (black bars) and mutant (white bars) mice. Asterisks indicate statistically significant differences between the two groups (*, P < 0.05; **, P < 0.01, ***, P < 0.005).
FIG. 6.
In vitro osteoclastogenesis is not attached to ChM-I inactivation. Bone marrow macrophages were isolated from tibial bone marrow of 12-week-old mice and were induced to osteoclast formation by stimulation with 100 ng of M-CSF/ml and 100 ng of soluble rhRANKL/ml as described in Materials and Methods. TRAP-positive multinucleated cells (MNCs) per well were counted. Data are means ± standard deviations for four wells. WT, wild type; KO, knockout; N.S., not significant.
DISCUSSION
ChM-I is a 25-kDa glycoprotein generated from a larger transmembrane precursor after posttranslational modification and proteolytic cleavage at a processing signal site (10). ChM-I was originally purified from bovine epiphyseal cartilage as a growth factor that stimulated anchorage-independent growth of chondrocytes in agarose (8) and induced proteoglycan synthesis (8). However, ChM-I also possesses inhibitory activity on the growth and tube morphogenesis of cultured vascular endothelial cells. Due to its bifunctional activities in vitro, it was thought that ChM-I might play a pivotal role in endochondral bone development during embryogenesis and in postnatal cartilage growth in vivo (27). However, our present observations with ChM-I−/− mice showed that ChM-I was not essential for normal cartilage formation and development. Indeed, our study revealed that ChM-I is more likely to be involved in normal bone remodeling, probably through regulating osteoclast and osteoblast numbers and functions. Detailed analysis of bones from ChM-I−/− mice showed that bone resorption was lower in comparison to bone formation, leading to increased bone mineral density and insufficient bone turnover.
Considering the marked cartilage phenotypes of mice deficient for angiogenic factors (6, 11, 33) or their inhibitors (7, 14), with which ChM-I was considered an equally potent factor in the cell culture systems (8, 9), the normal development of cartilage at embryonic and postnatal stages in ChM-I−/− mice was unexpected. Furthermore, no overt abnormalities were found in tests for rib fracture healing in adult ChM-I−/− mice (data not shown). It is possible that a functionally redundant factor may compensate for the lack of ChM-I activity in ChM-I−/− mice. While tenomodulin was once assumed to mimic ChM-I action in cartilage development, it was recently shown that its expression patterns do not overlap with that of ChM-I in cartilage (25). Moreover, tenomodulin expression was not affected by ChM-I inactivation in mice (data not shown). Thus, taken together, our study suggested the possible existence of a functionally redundant factor for ChM-I in chondrocytes.
As the only reported activity for ChM-I involved the stimulation of osteoblast proliferation and differentiation (19), which does not appear to explain the bone phenotype of the ChM-I−/− mice, the function of ChM-I in osteoclasts remains elusive. However, given the increased bone mineral density in ChM-I−/− mice, ChM-I expression in osteoblasts at low levels may regulate the expression of receptors or ligands that control the proliferation and/or differentiation of both osteoblasts and osteoclasts. In this respect, as decreased numbers of TRAP-positive mature osteoclasts were observed in ChM-I−/− mice, the possibility of the involvement of ChM-I in the RANKL-receptor activator of nuclear factor κB system of osteoclastogenesis (13, 15) is of interest and remains to be tested.
Acknowledgments
We thank H. Murayama (Kureha Chemical Industry) for technical assistance with bone histology and Yasuhiro Kobayashi (Matsumoto Dental University) for helpful discussions about osteoclast generations. We thank R. Nakamura and H. Higuchi for manuscript preparation.
This work was supported by a grant-in-aid from the Japan Society for the Promotion of Science Research for the Future Program (to Y.H.) and priority areas from the Ministry of Education, Science, Sports and Culture of Japan (to S.K.).
REFERENCES
- 1.Ducy, P., C. Desbois, B. Boyce, G. Pinero, B. Story, C. Dunstan, E. Smith, J. Bonadio, S. Goldstein, C. Gundberg, A. Bradley, and G. Karsenty. 1996. Increased bone formation in osteocalcin-deficient mice. Nature 382:448-452. [DOI] [PubMed] [Google Scholar]
- 2.Ducy, P., T. Schinke, and G. Karsenty. 2000. The osteoblast: a sophisticated fibroblast under central surveillance. Science 289:1501-1504. [DOI] [PubMed] [Google Scholar]
- 3.Gelb, D. E., R. N. Rosier, and J. E. Puzas. 1990. The production of transforming growth factor-beta by chick growth plate chondrocytes in short term monolayer culture. Endocrinology 127:1941-1947. [DOI] [PubMed] [Google Scholar]
- 4.Gerber, H. P., T. H. Vu, A. M. Ryan, J. Kowalski, Z. Werb, and N. Ferrara. 1999. VEGF couples hypertrophic cartilage remodeling, ossification and angiogenesis during endochondral bone formation. Nat. Med. 5:623-628. [DOI] [PubMed] [Google Scholar]
- 5.Gonzalez, A. M., M. Buscaglia, M. Ong, and A. Baird. 1990. Distribution of basic fibroblast growth factor in the 18-day rat fetus: localization in the basement membranes of diverse tissues. J. Cell Biol. 110:753-765. [DOI] [PMC free article] [PubMed] [Google Scholar]
- 6.Haigh, J. J., H. P. Gerber, N. Ferrara, and E. F. Wagner. 2000. Conditional inactivation of VEGF-A in areas of collagen2a1 expression results in embryonic lethality in the heterozygous state. Development 127:1445-1453. [DOI] [PubMed] [Google Scholar]
- 7.Hankenson, K. D., S. D. Bain, T. R. Kyriakides, E. A. Smith, S. A. Goldstein, and P. Bornstein. 2000. Increased marrow-derived osteoprogenitor cells and endosteal bone formation in mice lacking thrombospondin 2. J. Bone Miner. Res. 15:851-862. [DOI] [PubMed] [Google Scholar]
- 8.Hiraki, Y., H. Inoue, K. Iyama, A. Kamizono, M. Ochiai, C. Shukunami, S. Iijima, F. Suzuki, and J. Kondo. 1997. Identification of chondromodulin I as a novel endothelial cell growth inhibitor. Purification and its localization in the avascular zone of epiphyseal cartilage. J. Biol. Chem. 272:32419-32426. [DOI] [PubMed] [Google Scholar]
- 9.Hiraki, Y., T. Kono, M. Sato, C. Shukunami, and J. Kondo. 1997. Inhibition of DNA synthesis and tube morphogenesis of cultured vascular endothelial cells by chondromodulin-I. FEBS Lett. 415:321-324. [DOI] [PubMed] [Google Scholar]
- 10.Hiraki, Y., H. Tanaka, H. Inoue, J. Kondo, A. Kamizono, and F. Suzuki. 1991. Molecular cloning of a new class of cartilage-specific matrix, chondromodulin-I, which stimulates growth of cultured chondrocytes. Biochem. Biophys. Res. Commun. 175:971-977. [DOI] [PubMed] [Google Scholar]
- 11.Holmbeck, K., P. Bianco, J. Caterina, S. Yamada, M. Kromer, S. A. Kuznetsov, M. Mankani, P. G. Robey, A. R. Poole, I. Pidoux, J. M. Ward, and H. Birkedal-Hansen. 1999. MT1-MMP-deficient mice develop dwarfism, osteopenia, arthritis, and connective tissue disease due to inadequate collagen turnover. Cell 99:81-92. [DOI] [PubMed] [Google Scholar]
- 12.Inoue, H., J. Kondo, T. Koike, C. Shukunami, and Y. Hiraki. 1997. Identification of an autocrine chondrocyte colony-stimulating factor: chondromodulin-I stimulates the colony formation of growth plate chondrocytes in agarose culture. Biochem. Biophys. Res. Commun. 241:395-400. [DOI] [PubMed] [Google Scholar]
- 13.Kong, Y. Y., H. Yoshida, I. Sarosi, H. L. Tan, E. Timms, C. Capparelli, S. Morony, A. J. Oliveira-dos-Santos, G. Van, A. Itie, W. Khoo, A. Wakeham, C. R. Dunstan, D. L. Lacey, T. W. Mak, W. J. Boyle, and J. M. Penninger. 1999. OPGL is a key regulator of osteoclastogenesis, lymphocyte development and lymph-node organogenesis. Nature 397:315-323. [DOI] [PubMed] [Google Scholar]
- 14.Kyriakides, T. R., Y. H. Zhu, L. T. Smith, S. D. Bain, Z. Yang, M. T. Lin, K. G. Danielson, R. V. Iozzo, M. LaMarca, C. E. McKinney, E. I. Ginns, and P. Bornstein. 1998. Mice that lack thrombospondin 2 display connective tissue abnormalities that are associated with disordered collagen fibrillogenesis, an increased vascular density, and a bleeding diathesis. J. Cell Biol. 140:419-430. [DOI] [PMC free article] [PubMed] [Google Scholar]
- 15.Li, J., I. Sarosi, X. Q. Yan, S. Morony, C. Capparelli, H. L. Tan, S. McCabe, R. Elliott, S. Scully, G. Van, S. Kaufman, S. C. Juan, Y. Sun, J. Tarpley, L. Martin, K. Christensen, J. McCabe, P. Kostenuik, H. Hsu, F. Fletcher, C. R. Dunstan, D. L. Lacey, and W. J. Boyle. 2000. RANK is the intrinsic hematopoietic cell surface receptor that controls osteoclastogenesis and regulation of bone mass and calcium metabolism. Proc. Natl. Acad. Sci. USA 97:1566-1571. [DOI] [PMC free article] [PubMed] [Google Scholar]
- 16.Li, X., N. Udagawa, K. Itoh, K. Suda, Y. Murase, T. Nishihara, T. Suda, and N. Takahashi. 2002. p38 MAPK-mediated signals are required for inducing osteoclast differentiation but not for osteoclast function. Endocrinology 143:3105-3113. [DOI] [PubMed] [Google Scholar]
- 17.Malluche, H. H., D. Sherman, W. Meyer, and S. G. Massry. 1982. A new semiautomatic method for quantitative static and dynamic bone histology. Calcif. Tissue Int. 34:439-448. [DOI] [PubMed] [Google Scholar]
- 18.Marks, S. C., and D. C. Hermey. 1996. The structure and development of bone, p. 3-14. In J. P. Bilezikian, L. G. Raise, and G. A. Rodan (ed.), Principles of bone biology. Academic Press, London, United Kingdom.
- 19.Mori, Y., Y. Hiraki, C. Shukunami, S. Kakudo, M. Shiokawa, M. Kagoshima, H. Mano, Y. Hakeda, T. Kurokawa, F. Suzuki, and M. Kumegawa. 1997. Stimulation of osteoblast proliferation by the cartilage-derived growth promoting factors chondromodulin-I and -II. FEBS Lett. 406:310-314. [DOI] [PubMed] [Google Scholar]
- 20.Moses, M. A., J. Sudhalter, and R. Langer. 1992. Isolation and characterization of an inhibitor of neovascularization from scapular chondrocytes. J. Cell Biol. 119:475-482. [DOI] [PMC free article] [PubMed] [Google Scholar]
- 21.Ogata, N., D. Chikazu, N. Kubota, Y. Terauchi, K. Tobe, Y. Azuma, T. Ohta, T. Kadowaki, K. Nakamura, and H. Kawaguchi. 2000. Insulin receptor substrate-1 in osteoblast is indispensable for maintaining bone turnover. J. Clin. Investig. 105:935-943. [DOI] [PMC free article] [PubMed] [Google Scholar]
- 22.Parfitt, A. M., M. K. Drezner, F. H. Glorieux, J. A. Kanis, H. Malluche, P. J. Meunier, S. M. Ott, and R. R. Recker. 1987. Bone histomorphometry: standardization of nomenclature, symbols, and units. Report of the ASBMR Histomorphometry Nomenclature Committee. J. Bone Miner. Res. 2:595-610. [DOI] [PubMed] [Google Scholar]
- 23.Sekine, K., H. Ohuchi, M. Fujiwara, M. Yamasaki, T. Yoshizawa, T. Sato, N. Yagishita, D. Matsui, Y. Koga, N. Itoh, and S. Kato. 1999. Fgf10 is essential for limb and lung formation. Nat. Genet. 21:138-141. [DOI] [PubMed] [Google Scholar]
- 24.Shukunami, C., K. Iyama, H. Inoue, and Y. Hiraki. 1999. Spatiotemporal pattern of the mouse chondromodulin-I gene expression and its regulatory role in vascular invasion into cartilage during endochondral bone formation. Int. J. Dev. Biol. 43:39-49. [PubMed] [Google Scholar]
- 25.Shukunami, C., Y. Oshima, and Y. Hiraki. 2001. Molecular cloning of tenomodulin, a novel chondromodulin-I related gene. Biochem. Biophys. Res. Commun. 280:1323-1327. [DOI] [PubMed] [Google Scholar]
- 26.Shukunami, C., S. Yamamoto, T. Tanabe, and Y. Hiraki. 1999. Generation of multiple transcripts from the chicken chondromodulin-I gene and their expression during embryonic development. FEBS Lett. 456:165-170. [DOI] [PubMed] [Google Scholar]
- 27.Suzuki, F. 1996. Roles of cartilage matrix proteins, chondromodulin-I and -II, in endochondral bone formation: a review. Connect. Tissue Res. 35:303-307. [DOI] [PubMed] [Google Scholar]
- 28.Takahashi, N., T. Akatsu, N. Udagawa, T. Sasaki, A. Yamaguchi, J. M. Moseley, T. J. Martin, and T. Suda. 1988. Osteoblastic cells are involved in osteoclast formation. Endocrinology 123:2600-2602. [DOI] [PubMed] [Google Scholar]
- 29.Takeda, S., T. Yoshizawa, Y. Nagai, H. Yamato, S. Fukumoto, K. Sekine, S. Kato, T. Matsumoto, and T. Fujita. 1999. Stimulation of osteoclast formation by 1,25-dihydroxyvitamin D requires its binding to vitamin D receptor (VDR) in osteoblastic cells: studies using VDR knockout mice. Endocrinology 140:1005-1008. [DOI] [PubMed] [Google Scholar]
- 30.Teitelbaum, S. L. 2000. Bone resorption by osteoclasts. Science 289:1504-1508. [DOI] [PubMed] [Google Scholar]
- 31.Twal, W. O., R. Vasilatos-Younken, C. V. Gay, and R. M. Leach, Jr. 1994. Isolation and localization of basic fibroblast growth factor-immunoreactive substance in the epiphyseal growth plate. J. Bone Miner. Res. 9:1737-1744. [DOI] [PubMed] [Google Scholar]
- 32.Uebelhart, D., E. Gineyts, M. C. Chapuy, and P. D. Delmas. 1990. Urinary excretion of pyridinium crosslinks: a new marker of bone resorption in metabolic bone disease. Bone Miner. 8:87-96. [DOI] [PubMed] [Google Scholar]
- 33.Vu, T. H., J. M. Shipley, G. Bergers, J. E. Berger, J. A. Helms, D. Hanahan, S. D. Shapiro, R. M. Senior, and Z. Werb. 1998. MMP-9/gelatinase B is a key regulator of growth plate angiogenesis and apoptosis of hypertrophic chondrocytes. Cell 93:411-422. [DOI] [PMC free article] [PubMed] [Google Scholar]
- 34.Yagi, T., T. Tokunaga, Y. Furuta, S. Nada, M. Yoshida, T. Tsukada, Y. Saga, N. Takeda, Y. Ikawa, and S. Aizawa. 1993. A novel ES cell line, TT2, with high germline-differentiating potency. Anal. Biochem. 214:70-76. [DOI] [PubMed] [Google Scholar]
- 35.Yagishita, N., Y. Yamamoto, T. Yoshizawa, K. Sekine, Y. Uematsu, H. Murayama, Y. Nagai, W. Krezel, P. Chambon, T. Matsumoto, and S. Kato. 2001. Aberrant growth plate development in VDR/RXR gamma double null mutant mice. Endocrinology 142:5332-5341. [DOI] [PubMed] [Google Scholar]
- 36.Yoshizawa, T., Y. Handa, Y. Uematsu, S. Takeda, K. Sekine, Y. Yoshihara, T. Kawakami, K. Arioka, H. Sato, Y. Uchiyama, S. Masushige, A. Fukamizu, T. Matsumoto, and S. Kato. 1997. Mice lacking the vitamin D receptor exhibit impaired bone formation, uterine hypoplasia and growth retardation after weaning. Nat. Genet. 16:391-396. [DOI] [PubMed] [Google Scholar]


