Abstract
A stable cell line expressing EB1-green fluorescent protein was used to image growing microtubule plus ends at the G2/M transition. By late prophase growing ends no longer extend to the cell periphery and were not uniformly distributed around each centrosome. Growing ends were much more abundant in the area surrounding the nuclear envelope, and microtubules growing around the nucleus were 1.5 fold longer than those growing in the opposite direction. The growth of longer ends toward the nucleus did not result from a localized faster growth rate, because this rate was ∼11 μm/min in all directions from the centrosome. Rather, microtubule ends growing toward the nucleus seemed stabilized by dynein/dynactin associated with the nuclear envelope. Injection of p50 into late prophase cells removed dynein from the nuclear envelope, reduced the density of growing ends near the nuclear envelope and resulted in a uniform distribution of growing ends from each centrosome. We suggest that the cell cycle-dependent binding of dynein/dynactin to the nuclear envelope locally stabilizes growing microtubules. Both dynein and microtubules would then be in a position to participate in nuclear envelope breakdown, as described in recent studies.
INTRODUCTION
Microtubule assembly dynamics during the interphase and mitotic stages of the cell cycle have been well characterized over the last decade, demonstrating the faster turnover of mitotic microtubules relative to those assembled during interphase (Saxton et al., 1984; Belmont et al., 1990; Zhai et al., 1996; Rusan et al., 2001). In contrast, microtubule assembly dynamics at the transitions between interphase and mitosis have received considerably less attention. Understanding changes in microtubule assembly dynamics during the interphase–mitosis transition will be critical to understanding how the cell disassembles the interphase microtubule array and assembles the mitotic spindle.
During the G2/M transition the amount of tubulin subunits assembled into polymer decreases dramatically at or near the time of nuclear envelope breakdown (NEB; Zhai et al., 1996). This major loss of microtubule polymer likely represents disassembly of interphase microtubules. The turnover of microtubules, estimated from photobleaching or dissipation of photoactivated tubulin, also increases from the relatively slow interphase rate to the faster mitotic rate at a time near NEB (Saxton et al., 1984; Zhai et al., 1996). The turnover of individual microtubules has not been characterized during the G2/M transition.
In addition to changes in microtubule dynamics, the nuclear envelope is torn apart by a cytoplasmic dynein-dependent process during the progression from prophase to prometaphase (Busson et al., 1998; Salina et al., 2002.). The dynein/dynactin complex localizes to the nuclear envelope during prophase (Busson et al., 1998). Clearly, microtubules must interact with dynein/dynactin at the nuclear membrane to generate the pulling forces necessary for NEB, but the organization of microtubules around the prophase nucleus has not been examined.
Herein, we report results using the microtubule plus end binding protein EB1, fused to green fluorescent protein (GFP), to examine growing microtubules at the G2/M transition. We elected to use EB1-GFP as a marker for microtubule plus ends because it proved difficult to image GFP-tubulin in prophase cells due to cell rounding and the increased background fluorescence from soluble tubulin dimers. EB1 binds to microtubule plus ends while they are in a growth state, and the apparent movement of the EB1-GFP spots at microtubule tips provides a measure of microtubule growth rate (Tirnauer et al., 1999; Mimori-Kiyosue et al., 2000). The EB1-GFP marker allowed us to measure the distribution of microtubule lengths at the G2/M transition, measure the growth rate of individual microtubules, and to determine whether dynein/dynactin at the nuclear envelope influences microtubule organization.
MATERIALS AND METHODS
EB1-GFP Cloning
The full-length EB1 cDNA was obtained in the pBluescript II SK vector (Berrueta et al., 1998; gift of D. Pellman, Dana-Farber Cancer Institute, Boston, MA). Primers were designed to amplify the entire length of the EB1 cDNA from the pBS+EB1 plasmid. The coding sequence of EB1 was generated using the forward primer 5′ GGAAACAGCTATGACCATGATTACGCC 3′ and the reverse primer 5′ GCGCTCATCCCGGGTATACTCTTCTTGCTCCTCC 3′, which introduced a SmaI site (shown in bold) into the polymerase chain reaction (PCR)-generated fragment. The PCR product was digested with SmaI and SacI and cloned in frame into the pEGFP-N1 vector (BD Biosciences Clontech, Palo Alto, CA).
Cell Culture
Porcine kidney epithelial cells (LLCPK; American Type Culture Collection, Manassas, VA) were grown at 37°C and 5% CO2 in high-glucose DMEM (Sigma-Aldrich, St. Louis, MO) supplemented with 10% fetal bovine serum (Sigma-Aldrich), antibiotic/antimycotic (Invitrogen, Carlsbad, CA), and 1 mM sodium pyruvate (Sigma-Aldrich). Cell doubling time was determined by plating cells onto grid-etched coverslips (Bellco Glass, Vineland, NJ) and counting the number of cells in 10 boxes every 12 h for 3 d. The number of cells vs. time was graphed and a final average doubling time was determined from four experiments performed in triplicate. For some experiments, cells were synchronized using a double aphidicolin (Sigma-Aldrich) block. Cells were trypsinized and plated on 35-mm coverslips in culture medium containing 0.1 μg/ml aphidicolin for 16 h. Cells were then released for 9 h, blocked again for 16 h, and then released again. Cells entered prophase 5–6 h later. In some experiments, monastrol (100 μM; Kapoor et al. 2000; a generous gift from Tarun Kapoor, Rockefeller University, New York, NY) was added to tissue culture medium and cells incubated for 4 h before examination.
Coverslips for live cell imaging were placed in Rose chambers containing high-glucose DMEM lacking phenol red and supplemented with 10 mM HEPES pH 7.3, 10% fetal bovine serum, and 1 mM sodium pyruvate. Oxyrase (Oxyrase) was added to the culture medium at 20 μl/ml to reduce photobleaching. Cells were treated with SYTO-59 (Molecular Probes, Eugene, OR Inc., Mansfield, OH) diluted 1:1000 in culture medium for 1 h before Rose chamber preparation to visualize chromosomes in living cells.
Stable Cell Line Expressing EB1-GFP
LLCPK/EB1-GFP stable cell lines were initiated by a transient transfection of the pEGFP-C1/EB1 plasmid into cells growing on a 60-mm tissue culture dish at 30% confluence. Transient transfections were performed using the FuGENE 6 transfection reagent (Roche Diagnostics, Indianapolis, IN). Transfected cells were grown in culture medium for 3 d and then trypsinized and split into 15 60-mm tissue culture dishes and cultured in DMEM supplemented with 1.4–1.8 mg/ml G418 (Sigma-Aldrich). Resulting colonies were trypsinized and isolated using sterile glass cloning rings (Bellco Glass) and grown in tissue culture chambers with coverslip bottoms (Nalge Nunc, Naperville, IL) in the selective medium. Potential colonies were screened by fluorescence microscopy, and selected colonies were expanded. Western blots were performed on selected colonies to ensure proper fusion protein expression. Stable cell lines were maintained in medium supplemented with 0.4 mg/ml G418. One line was chosen for study and was designated EB1/GFP-3. An LLCPK GFP α-tubulin–expressing cell line was also used (Rusan et al. 2001; a gift of P. Wadsworth, University of Massachusetts, Amherst, MA).
Confocal Microscopy
Methanol fixed cells (below) were observed using a 63×/1.4 numerical aperture plan apo objective on an inverted microscope (Axiovert 200 M; Carl Zeiss, Jena, Germany) equipped with an LSM510 META scan head (Carl Zeiss). Argon ion, 543 HeNe, and 633 HeNe lasers were used to generate the 488, 543, and 633 lines used for excitation, and pinholes were typically set to 1–1.5 Airy units. Images, usually 1024 × 1024 or 512 × 512, were acquired using four-line mean averaging in a Z-series typically containing 20 slices ∼0.5 μm in thickness for a total stack depth of ∼10 μm. Image stacks were then converted to two-dimensional (2D) projections using a LSM510 META 3.0 software (Carl Zeiss). Images were exported as JPEG files and printed using Photoshop 5.0 (Adobe Systems, Mountain View, CA).
Wide Field Microscopy
Cells were examined by wide field microscopy by using a 100×/1.4 numerical aperture planapo objective on an inverted microscope (TE300; Nikon, Tokyo, Japan) equipped for epi-illumination. The microscope stage was heated to 37°C by using an Air Stream stage incubator. Images were projected to a cooled charge-coupled device camera (C4742-95; Hamamatsu, Bridgewater, NJ) and acquired and stored as 12-bit files by using Image ProPlus software (Phase 3 Imaging) or MetaMorph (Universal Imaging, Downingtown, PA). Cells were illuminated with light from a 100-W mercury lamp that was first passed through a GG400 filter to remove UV light, a KG5 filter to remove infrared (IR) radiation (Khodjakov and Rieder, 1999), and 2–4× neutral density filters to reduce light intensity. During fluorescence imaging, illumination of cells was further reduced through use of a software-controlled shutter (Uniblitz Electronics, Rochester, NY), which limited exposure to the image acquisition time (200 ms/frame). For phase contrast imaging, cells were illuminated with light from a 12-V/100-W halogen lamp with a green interference filter. Khodjakov and Rieder (1999) previously noted that illumination of cells with UV or IR could slow progression from G2 to M, and in some cases caused prophase cells to revert back to interphase. The UV and IR filters in the epi-illumination pathway were sufficient to prevent this radiation-induced change in the cell cycle because we typically saw prophase cells proceed into prometaphase. GFP was imaged using a long pass filter cube (excitation 425–475, emission 485LP) or the Endow filter cube (excitation 450–490, emission 500–550). Digital time-lapse movies of GFP-EB1 dynamics were recorded by acquisition of 20–200 frames (200 ms/frame) every 2–5 s. Typically, 30 frames were collected for each movie. Additional cells were examined after fixation with ice cold methanol (described below).
Immunofluorescence
Cells grown to 60–80% confluence on 35-mm coverslips were rinsed in 37°C PEM and then fixed in −20°C methanol supplemented with 1 mM EDTA for 10 min, followed by rehydration in phosphate-buffered saline. Cells were incubated with antibodies as described previously (Howell et al., 1999). Primary antibodies used were monoclonal antibody (mAb) DM1A anti-α-tubulin (1:40; Sigma-Aldrich) and rabbit anti-dynein IC (1:250; Vaughan and Vallee, 1995; gift of Kevin Vaughan, University of Notre Dame, Notre Dame, IN). Cy3-conjugated sheep anti-mouse (1:500; Jackson Immunoresearch Laboratories, West Grove, PA) and Cy5 and AlexaFluor 568-conjugated goat anti-rabbit (1:250; Cy5, Jackson Immunoresearch Laboratories; AlexaFluor, Molecular Probes) were used as secondary antibodies. DNA was stained with either Hoechst 33258 or propidium iodide.
Microinjection
GFP/EB1-3 cells were grown on grid-etched coverslips. Prophase cells were identified by phase contrast microscopy and microinjected with 10 mg/ml (needle concentration) purified p50 (Echeverri et al., 1996; Howell et al., 2001) in microinjection buffer (Howell et al., 1999). Approximately 5 min after injection, cells were fixed in −20°C methanol and processed for anti-dynein immunofluorescence as described above. Interphase cells were injected with rhodamine tubulin (2 mg/ml needle concentration; Cytoskeleton, Denver, CO) and fixed within 5 min. Cells were injected on a Diaphot inverted microscope (Nikon, Tokyo, Japan) by using a Femtojet (Brinkmann Instruments, Westbury, CT) regulator, InjectMan NI 2 (Brinkmann Instruments) micromanipulator, and Femtotips (Eppendorf) microneedles.
Western Blotting
Western blotting was performed as described previously (Howell et al., 1999). Primary antibodies used were mAb GD10 anti-human EB1 antibody (1:1000; Oncogene Research Products, San Diego, CA; gift of J. Tirnauer, Harvard University, Cambridge, MA) and anti-GFP mAb (1:1000; BD Biosciences Clontech).
Image Analysis
Microtubule lengths were determined by measuring the distances of EB1-GFP comets from the centrosome. Measurements were made on 2D projections of confocal stacks. The 2D projection flattens the image and did not include height information. Therefore, our measurements underestimate the lengths of microtubules located significantly above or below the plane of the centrosome. From image stacks it seems that the majority of microtubules are contained within a relatively small number of image slices, so we did not correct for cell thickness.
Comets of EB1-GFP fluorescence were assigned to a centrosome based on comet orientation (fixed cells) or trajectory (digital movies) relative to the two centrosomes. Any comets that could not be assigned unambiguously to one centrosome or the other were not included in analysis.
To measure microtubule elongation rates, sequences of images were advanced frame by frame, and x,y coordinates of the distal position of EB1-GFP at microtubule tips was marked with a cursor overlay. The imaging software recorded these sequential positions along with time of each frame. The x,y position data were converted into microtubule length relative to the initial length (interphase) or from the centrosome (mitotic stages). Regression analysis of length vs. time plots was used to calculate growth rate. Means were compared at the 95% confidence limit using the ANOVA package provided by Microsoft Excel (Microsoft, Redmond, WA).
RESULTS
EB1-GFP LLCPK Cell Line
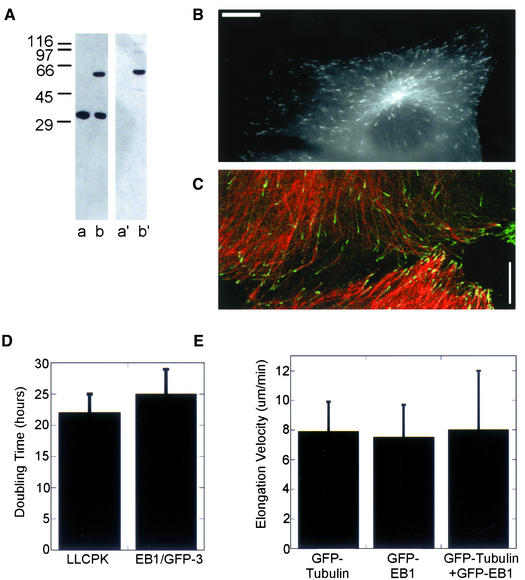
We first established a stable LLCPK cell line expressing EB1-GFP (EB1/GFP-3; see MATERIALS AND METHODS). These cells express a protein of the expected molecular weight (∼65 kDa) that was recognized by antibodies to either EB1 or GFP (Figure 1A) and was expressed at a level similar to the endogenous EB1. EB1-GFP was localized to microtubule tips, where it appeared as a short comet, and to centrosomes (Figure 1B) as reported previously (Berrueta et al., 1998; Mimori-Kiyosue et al., 2000; Morrison and Ashkam, 2001). EB1 binds to microtubule plus ends in a growing state (Mimori-Kiyosue et al., 2000), but the fraction of growing ends bound by EB1 had not been determined. To see whether the majority of growing microtubule ends were also labeled with EB1-GFP, we injected EB1/GFP-3 cells with rhodamine-labeled tubulin and fixed cells <5 min after injection. We find that ∼90% of the microtubule ends that had incorporated rhodamine tubulin also had EB1-GFP at their tips (Figure 1C). Because some of the rhodamine tubulin-labeled ends could have switched into depolymerization or pause states before fixation, our data suggest that nearly all growing ends have EB1-GFP at their tips.
Figure 1.
EB1/GFP-3 cell line expresses the EB1-GFP fusion protein at a level that does not alter cell doubling time or interphase microtubule elongation velocity. (A) Western blot of cell lysates from EB1/GFP-3 and the parent LLCPK cell lines. Lanes (a and a′): lysates from the parent LLCPK cell line; lanes (b and b′): lysates from EB1/GFP-3 cell line. Lanes a and b were probed with anti-EB1. Endogenous EB1 is detected in both cell lines at the expected molecular mass of 30 kDa. Lanes (a′) and (b′) were probed with anti-GFP. The EB1-GFP fusion protein is identified in lane (b′). (B) Interphase cell from the EB1/GFP-3 cell line. (C) Interphase EB1-GFP-3 cell fixed <5 min after injection of rhodamine-labeled tubulin. Most microtubule ends incorporating rhodamine tubulin should be in a growth state. The majority of these microtubules have EB1-GFP comets at their tips. (D). Cell doubling times were determined as described in MATERIALS AND METHODS. The growth rates of LLCPK and EB1/GFP-3 cell lines were not significantly different. Means (± SD) of four experiments performed in triplicate are shown. (B). Interphase microtubule elongation velocity was not statistically different in GFP-tubulin (n = 7 cells, 20 microtubule ends) and EB1/GFP-3 (n = 8 cells, 34 microtubule ends) cell lines. Transient transfection of EB1-GFP into the GFP-tubulin cell line also did not change microtubule growth rate (n = 5 cells, 15 microtubule ends). Bars in B and C, 10 μm.
To determine whether expression of EB1-GFP altered cell growth, we compared cell doubling times for LLCPK (nontransfected) and EB1/GFP-3 cell lines. The doubling time was similar for the two cell lines (∼23 h) and the mean doubling times were not significantly different (Figure 1D). Interphase microtubule growth rates were also not altered in the EB1/GFP-3 cell line. We measured the growth rate of microtubules in the lamellar regions of interphase LLCPK cells expressing either EB1-GFP (EB1/GFP-3 cell line; growth rate measured from the rates of EB1-GFP “movement”) or GFP-α-tubulin (Rusan et al., 2001). The average microtubule growth rate was nearly identical in these two cell lines (Figure 1E). As an additional control, we transiently transfected EB1-GFP into the GFP-α-tubulin cell line and measured microtubule growth rates in these cells (transfected cells were identified by cotransfection of a plasmid expressing DsRed; our unpublished data). We selected interphase cells having comets of GFP-EB1 at their tips with brightness similar to those in the EB1/GFP-3 cell line (our unpublished data). Again, the microtubule growth rate was not significantly changed (Figure 1E). Therefore, we conclude that EB1-GFP can serve as a marker for growing microtubule plus ends without significantly modifying cell processes.
Organization of Microtubule Growing Ends during the Early Stages of Mitosis
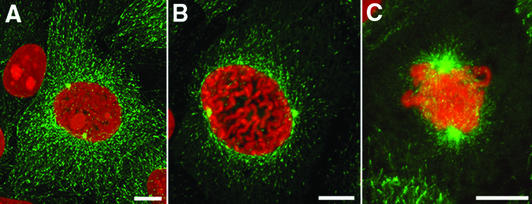
We first used the EB1/GFP-3 cell line to examine the distribution of growing microtubule ends during the G2/M transition. The 2D projections of confocal image stacks are shown in Figure 2. In early prophase cells, growing microtubule ends were distributed throughout the cell (Figure 2A). By late prophase, the growing microtubule ends no longer reached the cell periphery and were instead concentrated near the nucleus (Figure 2B). The highest density of EB1-GFP comets was within a 2- to 3-μm-wide ring surrounding the nuclear envelope. The nuclear envelope was still intact in these cells as judged by differential interference contrast, the lack of EB1-GFP comets within the nuclear area, and the lack of soluble EB1-GFP in the nucleus (our unpublished data; see also video supplement 1). During prometaphase EB1-comets were distributed throughout the spindle (Figure 2C).
Figure 2.
EB1-GFP localization from early prophase to prometaphase. Maximum intensity projections of images collected by confocal microscopy. (A) In early prophase cells, growing microtubule ends are distributed throughout the cytoplasm and seem to have a distribution similar to interphase cells. (B) By late prophase, EB1-GFP was localized to shorter microtubules that no longer extend to the cell periphery. The highest density of growing microtubule ends was within 2–3 μm of the nuclear envelope. A three-dimensional projection of B is provided in video supplement 1. (C) At prometaphase, the forming spindle is dense with growing microtubule tips. Bars, 10 μm.
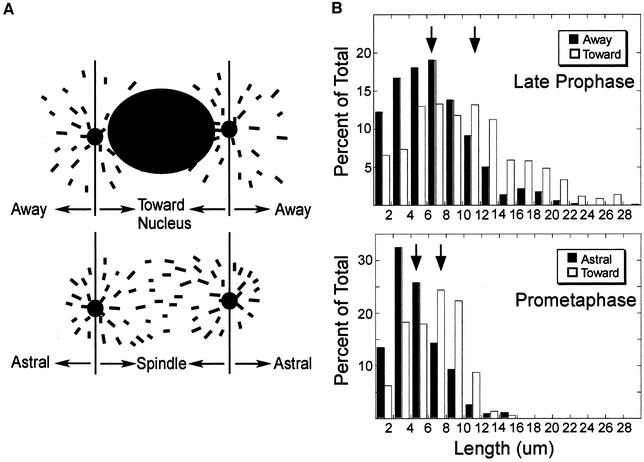
From images of late prophase cells obtained using either confocal or wide field microscopy (our unpublished data), it seemed that microtubules grew to longer lengths in the direction of the nucleus. To quantify microtubule lengths we measured the distance of each EB1-GFP comet from the centrosome and scored them as growing toward or away from the nucleus (Figure 3A, see diagram). Note that the majority of growing ends classified as growing toward the nucleus were within several micrometers of the nuclear envelope. Using this classification, we found that microtubules growing toward the nucleus were on average 1.5 times longer than those growing in the opposite direction (Figure 3B). The difference in average lengths was statistically significant (p < 0.01). For comparison, we also measured the lengths of growing microtubule ends in prometaphase cells. As shown in Figure 3, microtubules also grew to longer lengths in the direction of the chromosomes (p < 0.01).
Figure 3.
Microtubules grow to longer lengths in the vicinity of the nucleus/chromatin during late prophase and prometaphase. (A) Drawings showing microtubules classified as growing toward or away from the nucleus (late prophase) or chromatin (prometaphase). (B). Histograms of growing microtubule length distributions during late prophase and prometaphase. Lengths were determined by measuring the distances of EB1-GFP comets from the centrosomes as described in MATERIALS AND METHODS. Histograms are based on 1440 late prophase and 982 prometaphase growing microtubules imaged by confocal microscopy. Mean lengths are noted by the arrows. (A, away/astral; T, toward; and S, spindle).
Microtubule Growth Rate Is Not Spatially Regulated during Mitosis
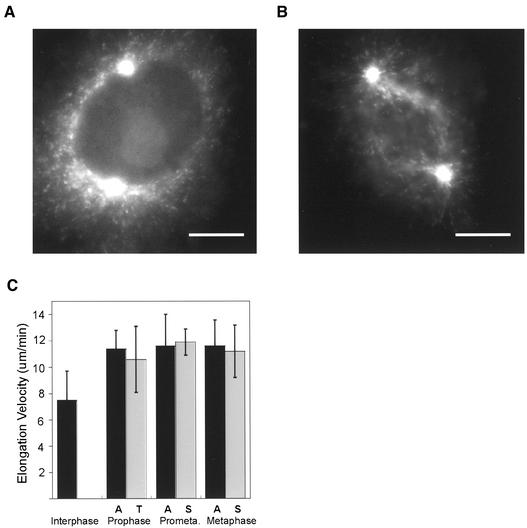
Microtubules could grow to longer lengths toward the nucleus (late prophase) or chromosomes (prometaphase) if growth rate was locally increased in the area around the nucleus/chromatin. Therefore, we measured microtubule growth rates in late prophase and prometaphase cells by the “movement” of EB1-GFP comets. Typical images used to track EB1-GFP comets from digital movies collected using wide field microscopy are shown in Figure 4, A and B (see also video supplements 2 and 3). In late prophase cells, microtubules grew at a rate of ∼11 μm/min and this rate was not significantly different (p < 0.05) for microtubules growing toward (10.6 μm/min) or away (11.4 μm/min) from the nucleus (n = 5 cells; direction assigned as shown in Figure 3A). To determine whether there were regional differences in microtubule growth rate after NEB, we measured astral and spindle growth rates during prometaphase and metaphase. Again, growth rate was ∼11 μm/min, with no difference in growth velocity between astral and spindle microtubules (Figure 4C).
Figure 4.
Microtubule elongation velocity increases in prophase and this higher rate continues through metaphase. (A and B) Typical wide field images used to track EB1-GFP comets. Late prophase (A) and prometaphase (B). Bars, 10 μm. (C) Mean elongation rates (± SD) for interphase (lamellar), prophase, prometaphase, and metaphase microtubules measured by movement of EB1-GFP comets. Regional differences in microtubule elongation rate were not found; instead, microtubules grew at the same rate toward or away from the nucleus/chromatin (see Figure 3A for classifications). Data shown is mean ± SD. Digital movies of late prophase, prometaphase and metaphase are provided in video supplements 2–4.
Injection of p50/Dynamitin Disrupts Organization of Growing Microtubule Ends at Late Prophase
Because microtubules grew to longer lengths in the direction of the nucleus, yet grew at the same rate toward or away from the nucleus, microtubules must be stabilized when growing in the vicinity of the nucleus. We examined two possible mechanisms responsible for regional microtubule stabilization: interaction with dynein/dynactin at the nuclear envelope or interaction with microtubules from the opposite spindle pole.
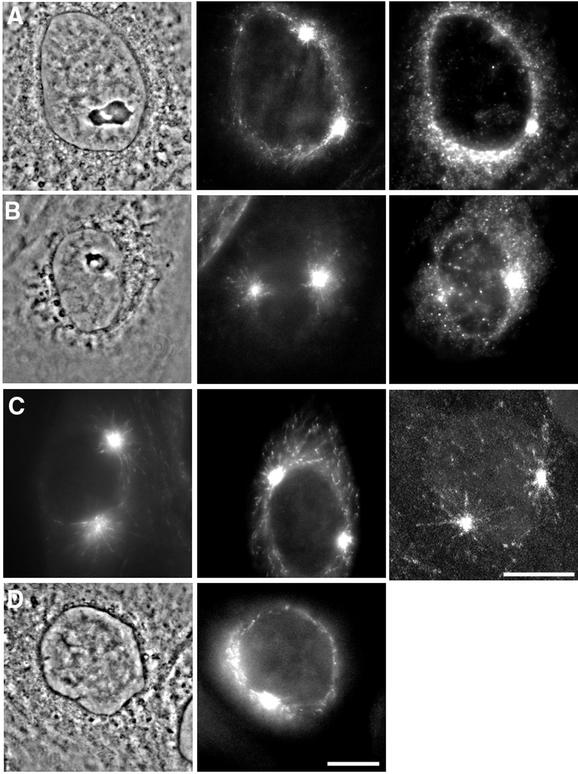
In late prophase cells, we found that dynein localized to the nuclear envelope as shown previously (Busson et al., 1998; Salina et al., 2002); dynein was also present as a punctate pattern concentrated near the nuclear envelope, which extended out from the nuclear envelope in a ring 2 to 3 μm in diameter. Dynein staining was also prominent at the centrosomes. We inhibited dynein function by microinjection of purified p50/dynamitin into late prophase cells (Figure 5). In most prophase cells (15 of 17 cells) injected with p50 and fixed 5 min later, dynein was no longer localized at the nuclear envelope or in the punctate ring surrounding the nuclear envelope (Figure 5B). The density of growing microtubule ends near the nuclear envelope was also reduced (Figure 5, B and C). These results suggest that dynein/dynactin may stabilize microtubules growing in the vicinity of the nuclear envelope.
Figure 5.
Microtubule stabilization in the vicinity of the nucleus depends on dynein/dynactin. Late prophase cells were observed by wide field or confocal microscopy after microinjection with p50 to disrupt the dynein/dynactin complex or monastrol to block spindle pole separation. (A) Uninjected cell showing high density of EB1-GFP comets and dynein surrounding the nucleus (left to right: phase contrast, EB1-GFP, and antidynein staining). (B) Injection of p50 dynamitin removes dynein from the nuclear envelope (right). The EB1-GFP comets are no longer associated with the nuclear envelope (middle). (C) Additional examples of EB1-GFP comet organization after p50 injection. Left and middle panels were obtained using wide field microscopy, whereas the right panel was obtained using a confocal microscope (2D projection of eight sections near the spindle poles). (D). Blocking spindle pole separation with monastrol did not alter EB1-GFP comet organization around the nuclear envelope. Bars, 10 μm.
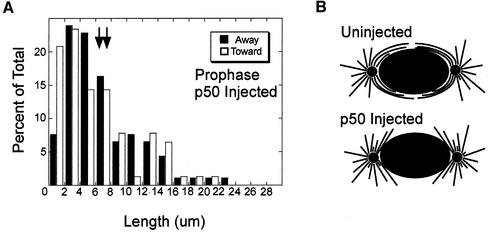
Microinjection of p50 also reduced the lengths of microtubules growing toward the nucleus. The length distributions of microtubule ends growing toward or away from the nucleus were similar after p50 injection (Figure 6; n = 2 cells). Both distributions were also similar to that measured in uninjected cells for microtubules growing in the direction away from the nucleus (compare Figures 3B and 6). Measurements from images collected by wide field microscopy showed the same result: the length distributions of growing ends were similar for ends growing toward or away from the nucleus (lengths measured in five cells).
Figure 6.
Microinjection of p50 dynamitin into prophase cells reduces the length of microtubules growing in the vicinity of the nucleus. (A) Histograms of the lengths of growing microtubules in cells fixed 5 min after p50 injection and imaged by confocal microscopy. The means are noted by the arrows. The distribution of growing microtubule ends is similar for ends growing toward or away from the nucleus. (B) Predicted distributions of growing microtubules in uninjected and p50 injected cells based on the organization of EB1-GFP comets. In uninjected cells, there is a high density of microtubules surrounding the nuclear envelope. After p50 injection, microtubules are released from the nuclear envelope.
We also injected p50 into interphase cells to determine whether p50 had a general effect on the organization of growing microtubules or their growth rate (cells were imaged several minutes after injection). In preliminary experiments, we found that injected cells had a distribution of EB1-GFP comets that was indistinguishable from their uninjected neighbors. We were surprised to find that p50 injection slowed microtubule growth rate, but this slower rate was not sufficient to change the distribution of growing microtubules.
In contrast to the reorganization of growing microtubule ends observed after p50 injection, blocking spindle pole separation with monastrol did not change the high density of growing ends near the nuclear envelope (Figure 5D). These results suggest that microtubules from the opposite spindle pole do not contribute to late prophase microtubule stabilization.
DISCUSSION
The results presented herein demonstrate the utility of EB1-GFP as a label for growing microtubules because EB1-GFP binds most, if not all, growing microtubule ends. At the level of EB1-GFP expressed in our cell line, EB1-GFP had no measurable effects on microtubule dynamics or cell growth. The EB1-GFP comets at the tips of growing microtubules can be imaged by wide field microscopy, and these comets can be followed in regions of the cell where microtubule density would make imaging of fluorescent tubulin assembly difficult (Mimori-Kiyosue et al., 2000; Morrison and Askham, 2001).
Microtubule Assembly Dynamics during Early Mitosis
Previous experiments by Zhai et al. (1996) suggested that major changes in microtubule polymer level and dynamic turnover occur near the time of NEB. In initial experiments using LLCPK cells expressing GFP-α-tubulin, we also saw a large increase in soluble tubulin at late prophase (our unpublished observations). Using EB1-GFP to label growing microtubule ends, we see a change in the distribution of growing ends between early and late prophase. Our observations of increased soluble tubulin and a change in the distribution of growing microtubule ends during late prophase are consistent with the increase in microtubule turnover observed at this stage (Saxton et al., 1984; Zhai et al., 1996).
By following EB1-GFP movement in living cells we found that microtubule growth rate increased ∼1.5 fold in prophase cells compared with that measured during interphase. This faster velocity was also observed during early prometaphase and metaphase. Several previous studies measured microtubule growth rate in interphase and prometaphase/metaphase. In each case, growth rate was faster in mitosis, although increased rates varied from a small 1.1- to 1.3-fold increase (Rusan et al., 2001; Belmont et al., 1990) to a near doubling in velocity (Hayden et al., 1990). Although we detected an increase in microtubule growth rate during mitosis, we did not see any evidence for a spatial regulation of this rate.
Microtubules must be locally stabilized in a region near the nucleus (late prophase) or chromosomes (prometaphase) because microtubules grow to longer lengths in these areas (Figure 3). Mitchison et al. (1986) previously localized biotin-labeled tubulin immediately after injection into prometaphase cells. They also found that growing microtubules (detected by incorporation of biotin-tubulin at their plus ends) were of longer length in the direction of the chromosomes. Regional regulation of microtubule assembly dynamics has also been measured in interphase cells (Wadsworth, 1999; Waterman-Storer et al., 2000). Because both catastrophe and rescue rates are regulated during mitosis (Belmont et al., 1990; Rusan et al., 2001), we cannot determine whether microtubule stabilization results from an increase in rescue, a decrease in catastrophe, or both.
Disruption of Dynein/Dynactin Complex Disrupts Organization of Growing Microtubules at Late Prophase
Late prophase cells have a high density of growing microtubule ends that colocalizes with dynein in a ring ∼2–3 μm in width surrounding the nuclear envelope. Prophase microtubules have also been observed tightly associated with the nuclear envelope in electron micrographs (Paweletz and Lang, 1988). We found that injection of these cells with p50/dynamitin to disrupt the dynein/dynactin complex significantly reduced dynein localization to this ring, and growing ends seemed to lose attachment to the nuclear envelope (Figure 5A, shown schematically in Figure 6B). In p50 injected cells, the microtubule length distributions for ends growing toward or away from the nucleus were similar to each other and to the length distribution for ends growing away from the nucleus in uninjected cells. These results suggest that dynein/dynactin locally stabilizes microtubules growing in the vicinity of the nuclear envelope.
In experiments using interphase cells, we found that p50 injection did not change the distribution of growing ends, although it did slow their growth rate. The slower growth rate observed after p50 injection does not change our interpretation of the experiments in prophase cells for several reasons. The mean length of growing microtubule ends after p50 injection is similar to that measured for microtubules growing away from the nucleus in noninjected cells, suggesting that p50 injection did not cause a shortening of microtubules throughout the cell. Injection of p50 into late prophase cells seemed to specifically release growing microtubule ends from close association with the nuclear envelope, and this effect should not be dependent on microtubule growth rate.
Recent results demonstrated a role for dynein in nuclear envelope breakdown and suggested a model where dynein localized to the nuclear envelope binds to microtubules to facilitate NEB by pulling and tearing the nuclear envelope toward the poles (Beaudouin et al., 2002; Salina et al., 2002). Our results suggest that dynein/dynactin first stabilizes microtubules, favoring their growth in close association with the nuclear envelope. Subsequent dynein-based movement toward the spindle poles would help break up the nuclear envelope, as proposed by Beaudouin et al. (2002) and Salina et al. (2002).
Supplementary Material
ACKNOWLEDGMENTS
We thank David Pellman for the gift of hEB1 cDNA, Pat Wadsworth for the GFP-tubulin LLCPK cell line, and Tarun Kapoor for the generous gift of monastrol. We also thank Bonnie Howell for the purified p50 protein, Kevin Vaughan for the anti-dynein IC antibody, and Jennifer Tirnauer for anti-EB1 antibody. We thank Bob Skibbens for microscope use during a filter cube catastrophe and Bonnie Howell, Trina Schroer, Bob Skibbens, Meg Kenna, Vincent VanBuren, and Justin Morabito for helpful discussions. Finally, we thank the anonymous reviewers for helpful suggestions. This study was supported by National Institutes of Health grant GM-58025 (to LC.).
Abbreviations used:
- NEB
nuclear envelope breakdown
Footnotes
Online version of this article contains video material for some figures. Online version available at www.molbiolcell.org.
Article published online ahead of print. Mol. Biol. Cell 10.1091/mbc.E02–09–0607. Article and publication date are at www.molbiolcell.org/cgi/doi/10.1091/mbc.E02–09–0607.
REFERENCES
- Beaudouin J, Gerlich D, Daigle N, Eils R, Ellenberg J. Nuclear envelope breakdown proceeds by microtubule-induced tearing of the lamina. Cell. 2002;108:83–96. doi: 10.1016/s0092-8674(01)00627-4. [DOI] [PubMed] [Google Scholar]
- Belmont LD, Hyman AA, Sawin KE, Mitchison TJ. Real time visualization of cell cycle dependent changes in microtubule dynamics in cytoplasmic extracts. Cell. 1990;62:579–589. doi: 10.1016/0092-8674(90)90022-7. [DOI] [PubMed] [Google Scholar]
- Berrueta L, Kraeft SK, Tirnauer JS, Schuyler SC, Chen LB, Hill DE, Pellman D, Bierer BE. The adenomatous polyposis coli-binding protein EB1 is associated with cytoplasmic and spindle microtubules. Proc Natl Acad Sci USA. 1998;95:10596–10601. doi: 10.1073/pnas.95.18.10596. [DOI] [PMC free article] [PubMed] [Google Scholar]
- Busson S, Dujardin D, Moreau A, Dompierre J, De Mey JR. Dynein and dynactin are localized to astral microtubules and at cortical sites in mitotic epithelial cells. Curr Biol. 1998;8:541–544. doi: 10.1016/s0960-9822(98)70208-8. [DOI] [PubMed] [Google Scholar]
- Echeverri CJ, Paschal BM, Vaughan KT, Vallee RB. Molecular characterization of the 50-kD subunit of dynactin reveals function for the complex in chromosome alignment and spindle organization during mitosis. J Cell Biol. 1996;132:617–633. doi: 10.1083/jcb.132.4.617. [DOI] [PMC free article] [PubMed] [Google Scholar]
- Hayden JH, Bowser SS, Rieder CL. Kinetochores capture astral microtubules during chromosome attachment to the mitotic spindle: direct visualization in live newt lung cells. J Cell Biol. 1990;111:1039–1045. doi: 10.1083/jcb.111.3.1039. [DOI] [PMC free article] [PubMed] [Google Scholar]
- Howell BH, Deacon H, Cassimeris L. Decreasing oncoprotein 18/stathmin levels reduces microtubule catastrophes and increases microtubule polymer in vivo. J Cell Sci. 1999;112:3713–22. doi: 10.1242/jcs.112.21.3713. [DOI] [PubMed] [Google Scholar]
- Howell BH, McEwen BF, Canman JC, Hoffman DB, Farrar EM, Rieder CL, Salmon ED. Cytoplasmic dynein/dynactin drives kinetochore protein transport to the spindle poles and has a role in mitotic spindle checkpoint inactivation. J Cell Biol. 2001;155:1159–1172. doi: 10.1083/jcb.200105093. [DOI] [PMC free article] [PubMed] [Google Scholar]
- Kapoor TM, Mayer TU, Coughlin ML, Mitchison TJ. Probing spindle assembly mechanisms with monastrol, a small molecule inhibitor of mitotic kinesin, Eg5. J Cell Biol. 2000;150:975–988. doi: 10.1083/jcb.150.5.975. [DOI] [PMC free article] [PubMed] [Google Scholar]
- Khodjakov A, Rieder CL. The sudden recruitment of gamma-tubulin to the centrosome at the onset of mitosis and its dynamic exchange throughout the cell cycle, do not require microtubules. J Cell Biol. 1999;146:585–596. doi: 10.1083/jcb.146.3.585. [DOI] [PMC free article] [PubMed] [Google Scholar]
- Mimori-Kiyosue Y, Shiina N, Tsukita S. The dynamic behavior of the APC-binding protein EB1 on the distal ends of microtubules. Curr Biol. 2000;10:865–8. doi: 10.1016/s0960-9822(00)00600-x. [DOI] [PubMed] [Google Scholar]
- Mitchison T, Evans L, Schultze E, Kirschner M. Sites of microtubule assembly and disassembly in the mitotic spindle. Cell. 1986;45:515–527. doi: 10.1016/0092-8674(86)90283-7. [DOI] [PubMed] [Google Scholar]
- Morrison EE, Askham JM. EB1 immunofluorescence reveals an increase in growing astral microtubule length and number during anaphase in NRK-52E cells. Eur J Cell Biol. 2001;80:749–753. doi: 10.1078/0171-9335-00221. [DOI] [PubMed] [Google Scholar]
- Paweletz N, Lang U. Fine structural studies of early mitotic stages in untreated and nocodazole-treated HeLa cells. Eur J Cell Biol. 1988;47:334–345. [PubMed] [Google Scholar]
- Rusan NM, Fagerstrom CJ, Yvon A-MC, Wadsworth P. Cell cycle-dependent changes in microtubule dynamics in living cells expressing green fluorescent protein-alpha tubulin. Mol Biol Cell. 2001;12:971–980. doi: 10.1091/mbc.12.4.971. [DOI] [PMC free article] [PubMed] [Google Scholar]
- Salina D, Bodoor K, Eckley DM, Schroer TA, Rattner JB, Burke B. Cytoplasmic dynein as a facilitator of nuclear envelope breakdown. Cell. 2002;108:97–107. doi: 10.1016/s0092-8674(01)00628-6. [DOI] [PubMed] [Google Scholar]
- Saxton WM, Stemple DL, Leslie RJ, Salmon ED, Zavortink M, McIntosh JR. Tubulin dynamics in cultured mammalian cells. J Cell Biol. 1984;99:2175–2186. doi: 10.1083/jcb.99.6.2175. [DOI] [PMC free article] [PubMed] [Google Scholar]
- Tirnauer JS, O'Toole E, Berrueta L, Bierer BE, Pellman D. Yeast Bim1p promotes G1-specific dynamics of microtubules. J Cell Biol. 1999;145:993–1007. doi: 10.1083/jcb.145.5.993. [DOI] [PMC free article] [PubMed] [Google Scholar]
- Vaughan KT, Vallee RB. Cytoplasmic dynein binds dynactin through a direct interaction between the intermediate chains and p150Glued. J Cell Biol. 1995;131:1507–1516. doi: 10.1083/jcb.131.6.1507. [DOI] [PMC free article] [PubMed] [Google Scholar]
- Waterman-Storer CM, Salmon WC, Salmon ED. Feedback interactions between cell-cell adherens junctions and cytoskeletal dynamics in newt lung epithelial cells. Mol Biol Cell. 2000;11:2471–2483. doi: 10.1091/mbc.11.7.2471. [DOI] [PMC free article] [PubMed] [Google Scholar]
- Wadsworth P. Regional regulation of microtubule dynamics in polarized, motile cells. Cell Motil Cytoskeleton. 1999;42:48–59. doi: 10.1002/(SICI)1097-0169(1999)42:1<48::AID-CM5>3.0.CO;2-8. [DOI] [PubMed] [Google Scholar]
- Zhai Y, Kronebusch PJ, Simon PM, Borisy GG. Microtubule dynamics at the G2/M transition: abrupt breakdown of cytoplasmic microtubules at nuclear envelope breakdown and implications for spindle morphogenesis. J Cell Biol. 1996;135:201–214. doi: 10.1083/jcb.135.1.201. [DOI] [PMC free article] [PubMed] [Google Scholar]
Associated Data
This section collects any data citations, data availability statements, or supplementary materials included in this article.


