Abstract
Chemokine receptor expression is exquisitely regulated on T cell subsets during the course of their migration to inflammatory sites. In the present study we demonstrate that CCR4 expression marks a pathogenic population of autoimmune T cells. CCR4 was found exclusively on memory CD4+ T cells during the progression of disease in NOD mice. Cells expressing the CCR4 ligand TARC (thymus- and activation-regulated chemokine) were detected within infiltrated islets from prediabetic mice. Interestingly, neutralization of macrophage-derived chemokine (MDC) with Ab caused a significant reduction of CCR4-positive T cells within the pancreatic infiltrates and inhibited the development of insulitis and diabetes. Furthermore, enhanced recruitment of CCR4-bearing cells in NOD mice resulting from transgenic expression of MDC resulted in acceleration of clinical disease. Cumulatively, the results demonstrate that CCR4-bearing T cells participate in the development of such tissue-driven autoimmune reactions.
Introduction
Chemokines and chemokine receptors provide directional cues for leukocyte migration and concomitantly induce the recruitment of T cells into sites of inflammation (1, 2). This process is particularly important in autoimmune diseases such as diabetes (3). Initial studies in this area have emphasized that chemokine receptor expression is tightly regulated on Th cells, and that Th cell subsets express restricted receptors for chemokines (4–8). For example, Th1 cells express the chemokine receptors CXCR3 and CCR5, while CCR3, CCR4, and CCR8 are found on Th2 cells. It was reported that the CCR4/macrophage-derived chemokine (MDC) axis plays a key role in the long-term recruitment of Th2 cells, indicating in vivo significance of distinct CCR4 expression on Th2 cells (9). However, recent observations suggest that CCR4 expression is not restricted to highly polarized Th2 cells. T cells expressing cutaneous lymphocyte–associated antigen can produce both IFN-γ and IL-4, yet more than 95% of these cells express high levels of CCR4 (10). Furthermore, a significant proportion of cells expressing cutaneous lymphocyte–associated antigen coexpress CCR4 and the Th1-associated receptors CXCR3 (35%) and CCR5 (50%). While these findings highlight the complexity of CCR4 expression by T cell subsets, the role played by CCR4 in the physiological and pathophysiological migration of T cells in vivo is unappreciated.
We have investigated the role of CCR4 in the migratory capacity of T cells during pathogenic autoimmunity in NOD mice, a model for human insulin-dependent diabetes mellitus in which Th1 cells mediate the destruction of pancreatic β cells. Here we demonstrate that CCR4-bearing T cells are in vivo pathogenic populations participating in the development of tissue-driven autoimmune reactions.
Methods
Mice.
NOD/shi, NOD/Lt-scid/scid, C57BL/6, and BDC2.5 NOD (11) were obtained from The Scripps Research Institute. NOD-scid and BDC2.5 NOD mice were used at 8–10 weeks and 6–8 weeks of age, respectively.
Generation of transgenic mice.
MDC-transgenic (MDC-TG) NOD mice were raised and maintained in specific pathogen–free quarters at The Scripps Research Institute. Use of the human insulin promoter resulted in the generation of founder mice that selectively expressed soluble MDC in the pancreatic β cells, which was confirmed by immunohistochemistry.
Ab’s.
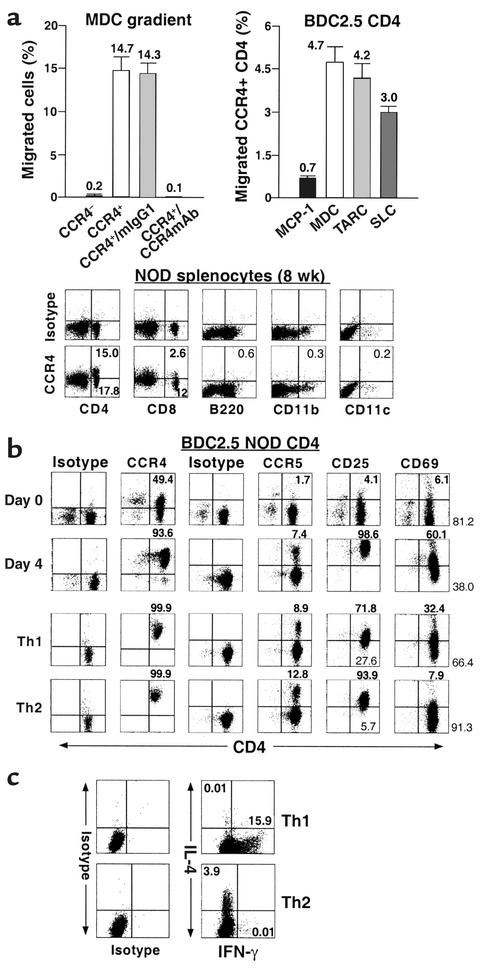
mAb’s were generated as previously described (12). B cell hybridomas secreting these mAb’s were purchased from American Type Culture Collection (Manassas, Virginia, USA). They included CD3 (145-2C11, hamster IgG), CD16/32 (FcγIII/II, 2.4G2, rat IgG2b), CD28 (37.51, hamster IgG), and Vβ4 (KT4, rat IgG2b). The mAb’s specific for CD4 (L3T4, GK1.5, rat IgG2b), CD8 (Lyt-2, 53-6-7, rat IgG2a), CD11b (Mac-1, M1/70, rat IgG2b), CD11c (integrin αx chain, HL3, hamster IgG), CD25 (3C7, IL-2 receptor α chain, rat IgG2b), CD44 (pgp-1, IM7, rat IgG2b), CD45RB (16A, rat IgG2a), CD54 (ICAM-1, 3E2, hamster IgG), CD62L (L-selectin, Mel-14, rat IgG2a), CD69 (very early activation marker, H1.2F3, rat IgG1), CD95 (Fas, Jo2, hamster IgG), CCR5 (C34-3448, rat IgG2c), B220 (CD45, RA3-6B2, rat IgG2a), and MHC class I (H-2Kd, SF1-1.1, mouse IgG2a) were obtained from Pharmingen (La Jolla, California, USA). Antibodies to MDC (rabbit polyclonal), thymus- and activation-regulated chemokine (TARC) (hamster monoclonal), and CCR4 (mouse monoclonal) were obtained from ICOS Corp. Polyclonal Ab’s against mouse MDC were prepared by immunizing New Zealand white rabbits with synthetic murine MDC (kindly provide by Ian Clarke-Lewis, University of British Columbia, Vancouver, British Columbia, Canada) conjugated to keyhole limpet hemocyanin. The IgG was purified from rabbit sera. This polyclonal Ab was demonstrated to recognize MDC in ELISA at a dilution of 1:500,000. The specificity of this Ab was evaluated by ELISA and shown not to recognize a panel of CC and CXC chemokines, including murine TARC. Neutralizing activity to mouse MDC was shown in chemotaxis assays using L1.2 cells expressing murine CCR4 (data not shown). The endotoxin content of this reagent was below 0.05 endotoxin units/ml, the limit of sensitivity of the assay (Pyrogent; BioWhittaker Inc., Walkersville, Maryland, USA) (13). The anti-CCR4 mAb was generated using L1.2/CCR4-expressing cells as antigen and was screened for specific recognition of human CCR4 transfectants by FACS (14). We further confirmed a high cross-reactivity between human and murine CCR4 by a functional migration assay. FACS-sorted CCR4-positive cells specifically responded to the CCR4 ligand murine MDC (Figure 1a), indicating that the anti-CCR4 mAb specifically recognized putative murine CCR4. T cells that did not stain with the CCR4 mAb responded to murine MDC. The anti-human CCR4 Ab was found to cross-react with murine CCR4 of T cells from NOD (Figure 1) and C57BL/6 mice (15) but not BALB/c mice, which was mouse-strain immunized (14). In addition, this anti-human CCR4 Ab showed a unique expression pattern of CCR4 on leukocyte memory subsets (CD45RBlowCD62LlowCD27+CD44high) of NOD mice (Figure 2) that was comparable to the expression pattern of human leukocytes (16). Furthermore, expression of CCR4 was inducible by activation (Figure 1b and Figure 3a).
Figure 1.
Functional responsiveness of CCR4+ T cells to the murine CCR4 ligand MDC. (a) Chemotactic response of CCR4+CD4+ T cells to murine chemokines. The migration of FACS-sorted CCR4-negative and -positive BDC2.5 CD4+ T cells to murine MDC (15 ng/ml) was studied in a Transwell assay. The assay was also carried out in the presence of anti-human CCR4 and isotype control mAb’s (left). In addition, the chemotactic function of the various murine chemokines MDC, TARC, SLC, and MCP-1 was evaluated on CCR4-expressing BDC2.5 CD4+ T cells (right). Data representing the percentage of migrating sorted cells (left) or CCR4+CD4+ T cells are expressed as the mean of triplicates ± SEM. Left graph: black bar, CCR4–; white bar, CCR4+; light gray bar, CCR4+/IgG1; dark gray bar, CCR4+/anti-CCR4 mAb. Right graph: black bar, murine MCP-1; white bar, murine MDC; light gray bar, murine TARC; dark gray bar, murine SLC. These data indicate that the human CCR4 mAb cross-reacts with murine CCR4. (b) Expression of CCR4 and CCR5 and activation molecules CD25 and CD69 in leukocyte subsets 8-week-old NOD/shi mice and their modulation through the activation or polarization of BDC2.5 CD4+ T cells. (c) Cytokine profile of polarized Th subsets. To assess the polarization of Th1 and Th2 cells in vitro, we have examined the double intracellular cytokine staining of the polarized Th effectors generated by short-term culture of highly purified naive BDC2.5 T cell populations. We demonstrated that Th1 and Th2 cells were well polarized and differentiated (n = 5).
Figure 2.
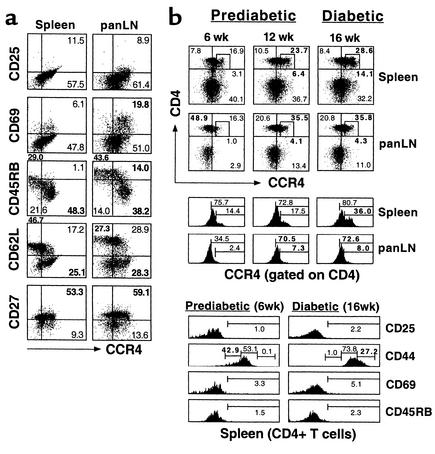
Memory phenotype and clinical diabetogenic potential of CCR4-bearing T cells. (a) Memory/effector phenotype of CCR4-expressing CD4+ T cells. To assess and characterize the in vivo immunophenotype of CCR4+CD4+ T cells, flow cytometry of CD4+ T cells from the spleen and panLN’s of 10- to 12-week-old NOD mice (n = 3) was performed. Values for CD25, CD27, CD45RB, CD62L, CD69, and CCR4 expression were determined by FACS analysis. We found that CCR4-expressing CD4+ T cells have a memory/effector phenotype. (b) Systemic expansion of pathogenic CCR4-expressing CD4+ T cell populations in lymphoid organs. To verify the clinical significance of CCR4-bearing CD4+ T cells in vivo, the CCR4-positive pathogenic population was monitored by FACS analysis during disease progression in NOD mice. Six-week-old and 12-week-old prediabetic mice and 16-week-old diabetic mice are shown. Squares mark the CCR4high population. The CCR4-bearing population was expanded in the secondary lymphoid tissues such as spleen and panLN’s of NOD mice during the diabetic or prediabetic state. The data shown are representative of three separate experiments.
Figure 3.
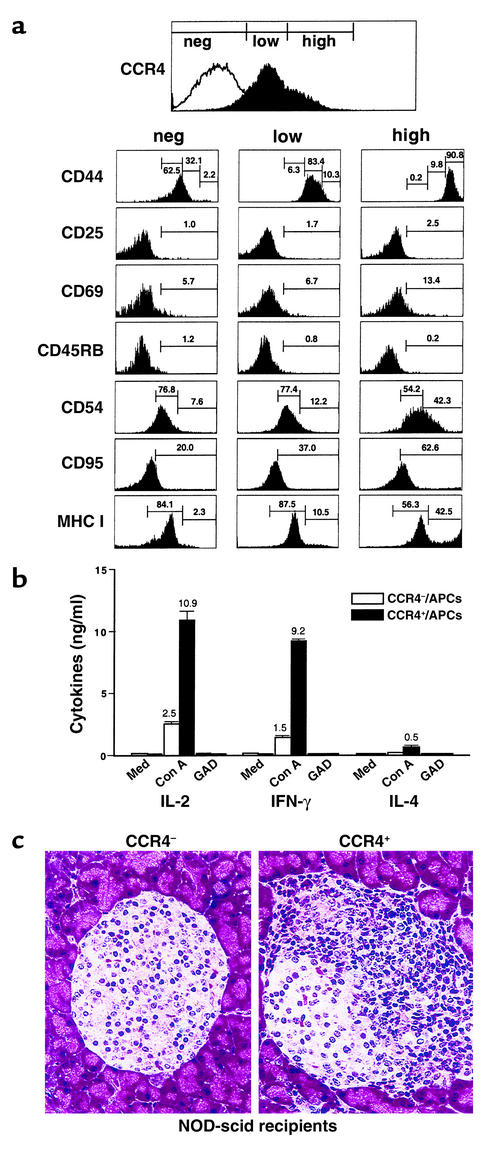
Immune characteristics and homing capacity of CCR4-bearing T cells in vivo. (a) Immunophenotype of CCR4+CD4+ T cells. CD4+ T cells from 16- to 18-week-old diabetic NOD mice were incubated with the indicated Ab’s and then analyzed by flow cytometry to determine the CCR4 expression levels. Left column, CCR4– (neg); center column, CCR4low (low); right column, CCR4high (high) populations. (b) Th1-type cytokine production by CCR4-positive cells. CCR4-positive (CCR4low and CCR4high) and -negative cells were cocultured with APCs for 3 days with Con A, GAD65, and media stimulation. Culture supernatants were examined by ELISA for their cytokine profiles. White bars, CCR4-negative cells/APCs; black bars, CCR4-positive cells/APCs. (c) Higher frequency and severity of insulitis of pancreatic islets of 8- to 10-week-old NOD-scid female recipients (each group, n = 2) 1 week after adoptive transfer of CCR4-positive and CCR4-negative CD4+ cells.
Purification of CD4+ T cells.
CD4+ T cells were purified from splenocytes of 6- to 8-week-old BDC2.5 or 16- to 18-week-old diabetic NOD mice using the StemSep CD4 isolation kit (StemCell Technologies Inc., Vancouver, British Columbia, Canada).
Sorting of CCR4-positive and -negative cells and characterization.
For the isolation and characterization of CCR4-positive cells, purified CD4+ T cells were incubated with CD16/32 (FcγIII/II) for 10 minutes to remove Fc background staining, and then stained with anti-CCR4 mAb (mouse IgG1) and other Ab’s for indicated cell surface markers. Stained cells were analyzed and sorted on a FACStar Plus (Becton, Dickinson and Co., Franklin Lakes, New Jersey, USA). Sorted cells were used for a chemotactic assay against the murine CCR4 ligand MDC or immediately activated with concanavalin A (Con A; 2.5 μg/ml) or glutamic acid decarboxylase (GAD65) (10 μg/ml) for 2–4 days in a coculture using irradiated spleen cells as antigen-presenting cells (APCs). The culture supernatants were harvested and analyzed for cytokine production. For the study of CCR4 expression kinetics, CCR4-negative cells were stimulated with media or anti-CD3 and anti-CD28 Ab’s.
Chemotaxis assays.
Cell migration assays were performed as previously described (17). The sorted CCR4-negative and -positive BDC2.5 CD4+ T cells were adapted for 1 hour at 37°C in an incubator with 5% CO2. Briefly, 2.0 × 10⁵ cells were resuspended in 200 μl of RPMI 1640 medium containing 1.0% FCS and transmigrated through bare filter Transwell inserts with 5-μm pores (Corning-Costar Corp., Cambridge, Massachusetts, USA) for 6 hours. For blocking experiments, CCR4+ T cells were preincubated with anti-CCR4 mAb (106 cells/μg) for 15 minutes at 37°C before being added to the Transwell inserts. Migrated cells were counted by FACS analysis of scatter-gated lymphocytes. Chemotaxis was performed in the presence of optimized ligands (15–50 ng/ml), including murine MDC (CCL22), TARC (CCL17), secondary lymphoid-tissue chemokine (SLC, also known as CCL21) (all obtained from R&D Systems Inc., Minneapolis, Minnesota, USA), and monocyte chemoattractant protein-1 (MCP-1) from Pharmingen. The percentage of migrating cells was determined as the number of cells migrating to chemokines (lower chamber) less the number of cells migrating to medium (lower chamber), divided by the total number of cells. Three independent experiments were performed.
Generation of Th subsets.
Purified resting CD4+ cells were isolated from BDC2.5 spleens. Th1 and Th2 cells were induced by culture of CD4+ T cells for 4 days in 25 ml of RPMI 1640 supplemented with 7% FCS. Flasks were coated with anti-CD3 mAb (145-2C11 clone) and washed before the addition of CD4+ T cells (5 × 10⁵/ml). The cultures were supplemented with recombinant IL-2 (rIL-2) and anti-CD28 (37.51 clone). To generate Th1 cells, cultures were supplemented with rIL-12 and anti–IL-4 mAb (11B11 clone). To induce Th2 cells, rIL-4 and anti–IFN-γ mAb (46A2 clone) were added. After 60 hours, the cells were expanded in medium containing rIL-2. To confirm polarization, double intracellular staining of IFN-γ and IL-4 was performed.
Adoptive transfer.
For the diabetic onset study using splenocyte transfer, newly diagnosed diabetic (16–18 weeks old) or nondiabetic (8 weeks old) MDC-TG and non-TG NOD littermates were used as splenocyte donors. NOD-scid females 8–10 weeks old were injected intravenously with 2 × 10⁷ donor splenocytes in suspension. For the T cell homing study, 2 × 10⁶ CCR4-sorted CD4+ T cells were injected into 8- to 10-week-old NOD-scid females.
Effect of anti-MDC Ab on disease onset and insulitis.
In a blocking experiment, 8- to 10-week-old NOD-scid females were injected intravenously with 1.5 × 10⁷ splenocytes from diabetic NOD mice followed by intraperitoneal injection of blocking Ab against MDC (rabbit IgG, 250 μg/mouse), (13), or the same amount of intraperitoneal control Ab (rabbit IgG; Pierce, New York, New York, USA) on days 0, 4, 7, 10, and 14. An estimation of the percentage of CCR4+CD4+ T cells within the infiltrates in pancreas, spleen, and pancreatic lymph nodes (panLN’s) and in circulating blood was made by flow cytometry and histologic analyses on days 7 and 14 after adoptive transfer. To determine the role of anti-MDC blocking Ab in the development of diabetes, blood glucose measurements were performed 7 days after Ab injection.
Cytokine ELISA and proliferative responses.
Splenocytes or CCR4-sorted CD4+ T cells were resuspended in serum-free HL-1 medium. To measure antigen-specific proliferative responsiveness, cells were incubated with or without culture medium containing GAD65 that was produced and isolated as previously described (18). CD4+ T cell–depleted irradiated (15 Gy) splenocytes from NOD mice were used as APCs. As a nonspecific stimulation, splenocytes were incubated in microplates precoated with anti-CD3 and/or anti-CD28 mAb’s. At days 2–4, supernatants from these cultures were collected and analyzed for IL-2, IL-4, and IFN-γ by ELISA. Following incubation for 18 hours with 1 μCi/well [3H]thymidine (Amersham Pharmacia Biotech Inc., Piscataway, New Jersey, USA), cells were harvested and [3H]thymidine incorporation was measured in a scintillation counter. The results were expressed as a stimulation index, which was determined by dividing total counts from wells with antigen or Ab’s by background counts from wells lacking antigen or Ab’s.
Analysis of islet-specific CD4 cells by flow cytometry.
The endogenous CCR4-expressing CD4+ T cells of MDC-TG NOD mice and NOD recipients injected by anti-MDC blocking Ab were identified for T cell homing and tissue distribution by flow cytometry. Pancreas, panLN’s, spleen, Peyer’s patches, and mesenteric LNs were teased into suspensions. The suspended cells (1 × 10⁶ cells) were stained for the indicated surface markers. Gating on 10,000 cells using a FACScan flow cytometer (Becton, Dickinson and Co.) generated the histograms and dot plots.
Assessment of diabetes.
The development of diabetes was assessed weekly by blood glucose measurements using the one-step Bayer Glucometer Elite (Bayer Corp., Elkhart, Indiana, USA). Animals were considered diabetic after two consecutive glucose values greater than 300 mg/dl were measured.
Immunohistochemical and histologic analyses.
Tissue sections were stained with hematoxylin and eosin (H&E) for histologic evaluation or prepared for immunocytochemical techniques as described (12). Paraffin-embedded pancreata or panLN’s were stained by the indirect immunoperoxidase method using a polyclonal rabbit anti-mouse MDC Ab (obtained from ICOS Corp.). Frozen sections were stained with hamster anti-mouse TARC mAb (ICOS Corp.). H&E-stained sections were graded for the presence of insulitis as follows: 0, absence of inflammation; 1, presence of less than 20% insulitis; 2, presence of 20–50% insulitis; or 3, presence of 50–100% insulitis (12). By taking an average of the grade of insulitis we derived an insulitis score representing the overall severity of inflammation.
Statistical analysis.
Significant differences were determined by Student t test (paired or unpaired) and log rank test using StatView software (Abacus Concepts Inc., Berkeley, California, USA). A value of P < 0.05 was taken as indication of significance.
Results
Functional responsiveness of CCR4-positive T cells to murine MDC.
Previous studies demonstrated a high degree of sequence homology and similar binding characteristics and tissue distribution between human and mouse CCR4 (19, 20). The antigenic similarity of CCR4 between human and mouse has allowed us to validate the use of anti-human CCR4 mAb for the analysis of murine CCR4. We obtained and tested the anti-human CCR4 mAb for cross-reactivity with mouse CCR4. The Ab was used to sort CCR4-positive and -negative T cells from BDC2.5 NOD mice. To determine whether CCR4-positive T cells (sorted using the anti-human CCR4 mAb) could respond to the mouse CCR4 ligand MDC, we performed a migration assay using murine MDC as a chemoattractant for CCR4-expressing cells. As shown in Figure 1a, we confirmed that CCR4+CD4+ T cells obtained by sorting BDC2.5 CD4+ T cells with anti-human CCR4 mAb showed a comparatively high migratory capacity in response to the MDC chemoattractant (migration: 14.7%, n = 3). In contrast, the absence of CCR4 in CD4+ T cells resulted in a remarkable absence of migration against an MDC gradient (migration: 0.2%). Additionally, there was a blockade in the chemotactic response of murine CCR4-positive cells to murine MDC when engaged by anti-human CCR4 mAb before migration (migration: 0.1%), whereas no significant reduction was observed in the migration of CCR4-positive cells treated with isotype control (mouse IgG1) (migration: 14.3%).
In addition, we evaluated the chemotactic function of the CCR4 ligands murine MDC and murine TARC as well as other chemokines, murine SLC and murine MCP-1, on resting/naive BDC2.5 CD4+ T cells. We found that the conditioned medium containing murine MDC and murine TARC significantly induced the migration of CCR4-positive CD4+ T cells (MDC, 4.7%; TARC, 4.2%, n = 3) (21); however, less migration was observed against SLC chemoattractant (3.0%, n = 3). There was no significant effect on migration of CCR4+CD4+ T cells in response to MCP-1 (0.7%, n = 3) (Figure 1a), since this chemokine attracts CCR2-expressing monocytes (22) as well as activated and memory T cells, including Th1 and Th2 cells (6–8). This indicates cross-reactivity between human and murine CCR4 and validates the use of the anti-human mAb’s to study murine CCR4.
We also found that the anti-human CCR4 Ab’s, which was raised in BALB/c mice, fails to recognize CCR4-expressing T cells from this strain (data not shown). However, the anti-human mAb cross-reacts with CCR4 from C57BL/6 (15) and NOD mice. We propose that anti–human CCR4 mAb will be useful in elucidating the role of murine CCR4 in mouse models of human autoimmune disease. Therefore, we first asked whether CCR4 expression could be differentially modulated in leukocyte subsets such as CD4+, CD8+, B220+, CD11b+, and CD11c+ cells, or following the activation or polarization of cells. In agreement with CCR4 expression patterns of human leukocytes (16), we demonstrated that our anti-CCR4 Ab showed a distinct pattern of CCR4 expression in CD4+ and CD8+ T cells, but CCR4 was not expressed on B220+, CD11b+, or CD11c+ cells from NOD/shi mice (Figure 1b). In addition, CD4+ T cells acquired higher levels of CCR4 and CCR5 when they were stimulated/activated with anti-T cell receptor/anti-CD28 mAb’s for 4 days or polarized into Th1 and Th2 effectors in vitro (Figure 1b).
CCR4 expression on polarized Th subsets.
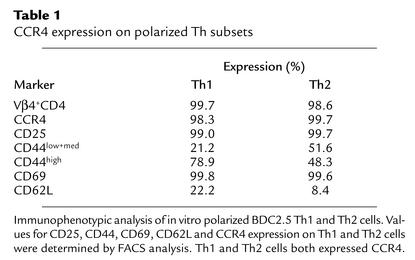
We next asked which subset of helper T cells expresses CCR4. Th1 and Th2 cells were induced by culture of BDC2.5 CD4+ T cells for 4 days in RPMI 1640 supplemented with rIL-12/anti–IL-4 mAb (11B11 clone) and rIL-4/anti–IFN-γ mAb (46A2 clone). We verified the polarization of Th1 and Th2 cells in vitro by comparing the intracellular cytokine profile of the T cells. As shown in Figure 1c, it was demonstrated that the cells capable of producing IFN-γ as a Th1-type cytokine (15.9% positive), and no IL-4 (0.01%) were significantly increased by Th1 induction, whereas production of Th2-type cytokine IL-4 (3.9%) but no IFN-γ (0.01%) was seen in the polarized Th2 cells. This indicates that Th1 and Th2 cells were well polarized and differentiated. Our in vitro experiment polarizing BDC2.5 T cells, which are a clonal population of CD4+ T cells that recognize a pancreatic islet antigen, demonstrated that Th1 and Th2 cells were positive for CD25, CD69, and CD44, reflecting their activated state (Table 1). Interestingly, CD4+ T cells exhibited downregulation of activation molecules CD25 and CD69 following polarization compared with CD4+ T cells stimulated with CD3/CD28 (day 4) (Figure 1b). Significantly, and in contrast to earlier reports (6–10) but in accordance with a recent report (23), we found that these Th1 and Th2 cells both express high levels of CCR4 (Table 1), indicating that Th1 and Th2 cells expressing CCR4 are activated memory/effector populations in vivo.
Table 1.
CCR4 expression on polarized Th subsets
Memory phenotype and clinical diabetogenic potential of CCR4-bearing T cells.
To further delineate the relationship between memory/effector phenotypes and CCR4 expression in vivo, we characterized the activation and memory markers on CD4+ T cells in the spleen and panLN’s from NOD mice. We found high levels of CCR4 expression on activated (CD25+CD69+) and memory/effector leukocyte subsets (CD45RBlow/CD62Llow/CD27+) in the spleen and panLN’s of NOD mice (Figure 2a). This was comparable to the expression pattern of human leukocytes (16), indicating that CCR4 expression marks the memory/effector CD4+ T cell population in vivo. To understand the clinical significance of CCR4-bearing CD4+ T cells in vivo, we determined the proportion of CCR4+CD4+ T cells during disease progression in 6-week-old prediabetic NOD mice with no lymphocyte infiltration, 12-week-old prediabetic NOD mice with insulitis, and 16-week-old diabetic NOD mice (24). We demonstrated that the CCR4-bearing (CCR4low and CCR4high) T cell population was significantly expanded in the secondary lymphoid tissues such as spleen and panLN’s of NOD mice during the later prediabetic (12 weeks of age) (percentage of total T cells: spleen, 23.7%; panLN’s, 35.5%) and diabetic stage of disease (spleen, 28.6%; panLN, 35.8%) compared with that in 6-week-old prediabetic mice (spleen, 16.9%; panLN, 16.3%). A low proportion of CCR4-bearing T cells was found in the spleens of 6- to 16-week old C57BL/6 mice (<5%) (data not shown). Interestingly, the percentage of CD4+ T cells that were CCR4high was remarkably increased in the spleens (4.6-fold) and panLN’s (4.3-fold) of diabetic NOD mice compared with younger prediabetic mice (Figure 2b).
Immune characteristics and homing capacity of CCR4-bearing T cells in vivo.
CCR4 expression marks a diabetogenic population of activated/memory autoimmune T cells in vivo (Figure 2). Memory CD4+ T cells primarily reside in or circulate through the spleen (25). From these findings, we investigated the in vivo activation/memory status and immunophenotype of CCR4+CD4+ T cells from the spleen of diabetic NOD mice 16–18 weeks old. We divided splenic CD4+ populations into three categories of CCR4 expression according to the criteria for human CCR4 expression (26): CCR4low (45.7%), CCR4high (35.0%), and CCR4-negative (19.3%) populations (Figure 3a). Strikingly, the CCR4-positive population exclusively comprises CD44high/med cells, whereas the CCR4-negative population includes the CD44low cells. It seems likely that CCR4high/CD44high CD4+ T cells are the in vivo pathogenic population, considering the recent finding that injection of anti-CD44–blocking mAb induces resistance to insulin-dependent diabetes mellitus (27). The majority of splenic CD4+ T cells were CD25low/CD69low/CD45RBlow cells, irrespective of the presence of CCR4 (Figure 3a, top), reflecting that the spleen is a major site for the residence of memory T cells (25). Furthermore, the CCR4high population expressed higher levels of ICAM-1 (CD54), MHC class I, and CD95 than did CCR4-negative cells (Figure 3a). Cumulatively, these results indicate that the CCR4-positive populations in vivo are cells with a memory phenotype that harbor stronger cell adhesion capabilities than are found on CCR4-negative cells. In addition, CCR4-positive T cells displayed Th1-cytokine production (IFN-γ and IL-2) when cocultured with APCs upon Con A stimulation (Figure 3b). Interestingly, massive aggregation between CCR4-positive CD4+ T cells and APCs upon Con A stimulation was followed by Th1-type cytokine production, whereas cytokine production and heterotypic aggregation were not found in the coculture of CCR4-negative T cells and APCs upon Con A stimulation (data not shown).
To further determine whether these CCR4-positive cells have a stronger cell migratory capacity than CCR4-negative cells, CCR4-positive and -negative T cell populations were sorted from spleen cells of 16- to 18-week-old diabetic NOD mice and injected into 8- to 10-week-old immunodeficient recipients. As shown in Figure 3c and Table 2, these adoptive transfer studies using CCR4-expressing T cells demonstrated a higher frequency of insulitis in pancreatic islets of NOD-scid recipients 1 week after transfer (mean score for insulitis: 1.68 ± 0.165, total islets: 105) than was found in recipients of CCR4-negative T cells (mean score for insulitis: 0.22 ± 0.015; total islets: 124) (n = 3, P = 0.001). This suggests that CCR4-positive cells harbor islet-homing capability.
Table 2.
High frequency of insulitis caused by CCR4+CD4+ T cells
CCR4 induction following in vitro CD3/CD28 stimulation.
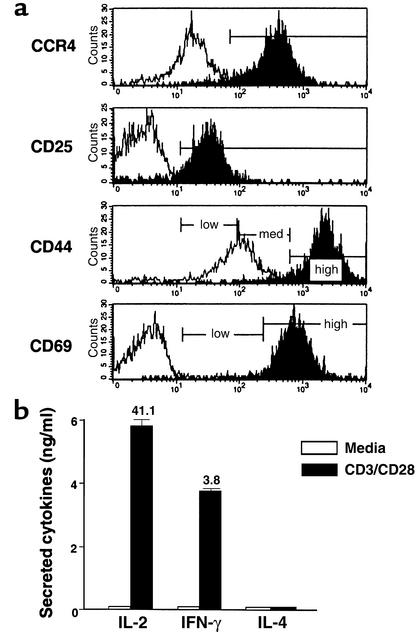
We next asked whether CCR4 acquisition correlates with the activation status of cells stimulated by T cell receptor and costimulatory molecule ligation. In vitro experiments to evaluate the characteristics of these cells revealed that CCR4 expression was induced on the majority of T cells when purified CCR4+CD4+ T cells (Figure 3a) from NOD mice were stimulated with anti-CD3 and anti-CD28 mAb’s (Figure 4a), suggesting that CD4+ T cells upregulate CCR4 following T cell receptor/CD28 signaling. Concomitantly, high levels of the Th1 cytokines (IFN-γ and IL-2) but not Th2 cytokines were expressed by these CCR4-negative cells following stimulation by anti-CD3 and anti-CD28 engagement (Figure 4b).
Figure 4.
CCR4 induction following in vitro CD3/CD28 stimulation. (a) Sorted CCR4–CD4+ T cells purified from spleens of 16- to 18-week-old diabetic NOD mice were analyzed for expression of CCR4 and activation markers following in vitro CD3/CD28 stimulation. CCR4-negative cells were incubated in vitro for 2 days in the presence or absence of anti-CD3/anti-CD28 mAb’s. The majority of CCR4-negative populations induced CCR4 expression following stimulation with anti-CD3/anti-CD28 mAb’s. These CCR4-positive cells also expressed CD25 and high levels of CD44 and CD69. Open area, media stimulation; filled area, anti-CD3/anti-CD28 stimulation. (b) The culture supernatants generated from CD3/CD28-stimulated (black bars) and media-stimulated cells (white bars) were analyzed for IL-2, IFN-γ, and IL-4 by ELISA.
TARC expression in pancreatic islets of prediabetic NOD mice.
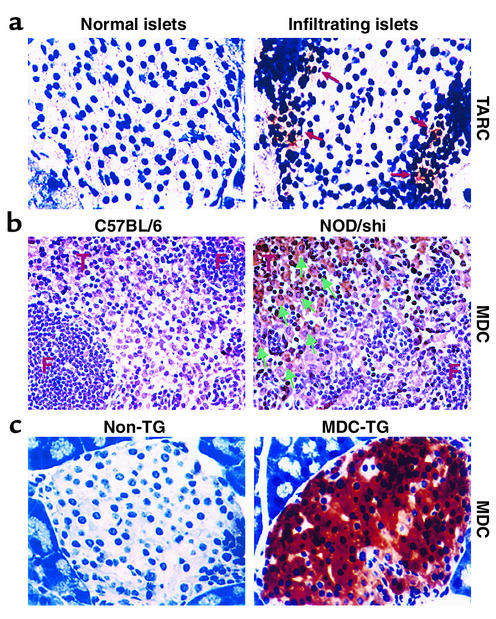
We sought to determine whether the CCR4 ligands MDC (21, 28) and TARC (29) are upregulated by the NOD pancreas, whose infiltrating cells are known to include dendritic cells, macrophages (2, 30), and activated B cells (31, 32) as cellular sources for these factors at the initial stages of development of diabetes (24). Using immunolocalization techniques, we identified TARC-expressing cells in the infiltrated islets of 10- to 14-week-old prediabetic NOD mice but not in normal islets of 6- to 8-week-old NOD mice (n = 3) (Figure 5a), strengthening the in vivo relevance of the CCR4 pathway in the development of diabetic pathogenesis. Unlike TARC-expressing cells, MDC-expressing cells were not readily detected in the infiltrated islets.
Figure 5.
TARC and MDC expression in pancreatic islets and lymph nodes of prediabetic NOD mice. (a) The CCR4 ligand TARC was expressed at low levels by infiltrating cells (right, arrow) in pancreatic islets of 10- to 14-week-old prediabetic NOD mice, but not in the normal islets of 6- to 8-week-old NOD mice (left). (b) MDC was distinctly expressed in the panLN’s of NOD/shi mice (right), but not in B57BL/6 NOD mice (left). Arrows indicate MDC-positive cells in the T cell area (T) but not in the follicle (F). (c) MDC was strongly expressed in pancreatic islets of MDC-TG mice (right), but not in non-TG NOD mice (left).
Attenuation of autoimmune diabetes by Ab’s to MDC.
MDC has been described as a functional ligand for the chemokine receptor CCR4 (21), and we demonstrated that CCR4-expressing T cells distinguish potentially pathogenic populations harboring a potent islet-homing capacity. According to a recent report (33), neutralization of MDC with specific rabbit polyclonal Ab’s effectively prevented interstitial lung inflammation and development of airway hypersensitivity by regulating the migration and accumulation of leukocytes within the tissues. To determine the role of CCR4 engagement on the severity of insulitis and diabetes, neutralizing Ab’s against MDC were injected on days 0, 3, 7, 10, and 14 into NOD-scid mice that had received splenocytes from diabetic NOD mice on day 0. Thereafter, mice were analyzed for the proportion of CCR4+CD4+ T cells in the pancreas and for severity of insulitis by flow cytometry and histologic analyses, respectively, on day 7 and day 14, respectively. The specific inhibition of MDC caused a significant decrease (2.5-fold) in the proportion of these T cells in panLN’s after 1 week, whereas no difference was found in the spleen, pancreas and blood (n = 3) (Figure 6a). We found that MDC was distinctly expressed on the large cells in the T cell area (T) but not in the follicle (F) of panLN’s from 12-week-old prediabetic NOD/shi mice, while no MDC-positive cells were observed in age-matched control B57BL/6 mice (Figure 5b). This is in agreement with previous reports that MDC is distinctly expressed by dendritic cells within the T cell zone draining into LNs, and that acquisition of MDC responsiveness is an early event during in vivo antigen-specific T cell activation (34–36). This suggests that at early stages of the response, LNs are the primary sites in which MDC acts to control recruitment of CCR4-expressing T cells.
Figure 6.
Attenuated disease onset and insulitis frequency after MDC blockage. The effect of anti-MDC blocking Ab on the development of diabetes was determined using a specific neutralizing Ab against MDC. Flow cytometry analysis was performed on days 7 and 14 after adoptive cell transfer. (a) Percentage of CCR4+CD4+ T cells infiltrating the panLN’s, pancreas, and spleen and in the circulating blood (n = 3). (b) The absolute cell number of pancreas-infiltrating and panLN CCR4+CD4+ T cells. Control group, black bars (n = 3); blocking Ab group, white bars (n = 3). (c) Attenuated disease onset after MDC blockage. Open circles, control group (n = 5); filled circles, blocking Ab group (n = 5). Seventy-five percent of anti-MDC Ab-treated mice were diabetic by 38 ± 2 days; 25% of control rabbit IgG–treated mice were diabetic at 40 ± 2 days, P = 0.041. This data supports a role for CCR4 engagement in the development of insulitis and diabetes.
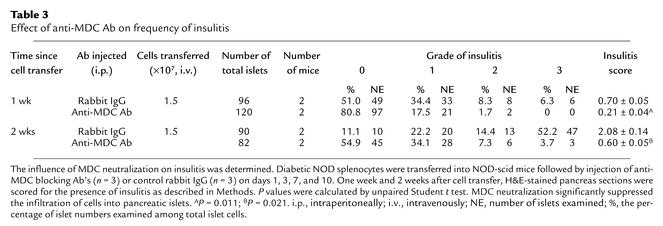
However, during later stages of our MDC inhibition experiment (at 14 days), the proportion of CCR4-positive cells was significantly decreased in the target pancreas (2.3-fold) and circulating blood (1.9-fold), while LNs and spleen no longer demonstrated the reduced proportion of T cells (Figure 6a). MDC blockage also resulted in a remarkable decrease (6.6-fold) in the absolute number of CCR4+CD4+ T cells after 1 week and 2 weeks (8.9-fold) within the pancreatic infiltrates compared with control Ab–treated mice (n = 3) (Figure 6b). In accordance with the findings in Figure 6, a and b, neutralization of MDC ultimately prevented accumulation of CCR4-expressing T cells in the pancreatic islets compared with rabbit IgG–treated mice (Table 3). On weeks 1 and 2 after cell transfer, mice treated with anti-MDC Ab had significantly reduced levels of insulitis (mean score for insulitis: 1 week, 0.21 ± 0.04; 2 weeks, 0.60 ± 0.05, P = 0.011, n = 3) compared with control group mice (1 week, 0.70 ± 0.05; 2 weeks, 2.08 ± 0.14, P = 0.021, n = 3).
Table 3.
Effect of anti-MDC Ab on frequency of insulitis
Finally, we determined whether MDC neutralization could affect disease onset. This experiment must be presented with the caveat that the last anti-MDC treatment occurs on day 14, after which the concentration of this reagent in vivo is expected to decline. Interestingly however, Figure 6c shows that MDC neutralization indeed resulted in reduced incidence of diabetes (25% of anti-MDC treated mice were diabetic by 40 ± 2 days, n = 5) compared with control rabbit IgG–treated mice (75% had diabetes at 38 ± 2 days, n = 5) (P = 0.041). This data supports a role for CCR4 engagement by MDC in the expansion/activation of “central” memory T cells in the lymph nodes and subsequently for further expansion of memory/effector cells in the spleen and homing of effector T cells into the pancreas during development of insulitis and diabetes.
Intensive recruitment of CCR4-bearing T cells by MDC.
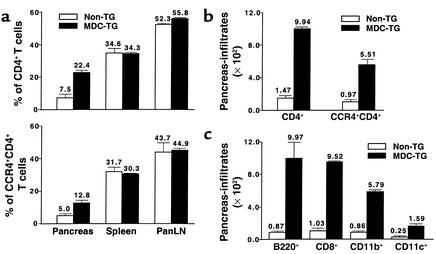
Having determined that Th1-polarized islet antigen-specific cells express CCR4 and that CCR4-bearing T cells exhibit a memory phenotype and strong islet-homing potential, we sought to determine whether CCR4-expressing T cells precipitate disease. It was reported that the two functional ligands for CCR4, MDC and TARC, are encoded on human chromosome 16 and have overlapping chemotactic properties (30). To elicit increased recruitment of CCR4-bearing T cells to the pancreas, we engineered NOD mice to express the CCR4 ligand MDC in the pancreas (Figure 5c). These MDC-expressing pancreata of 12-week-old NOD mice contained a 2.6-fold higher percentage (Figure 7a, bottom) and 5.7-fold higher absolute number (Figure 7b) of CCR4-expressing CD4+ T cells in the pancreas than did non-TG NOD littermates (n = 3). However, no difference was found in the proportion of CCR4+CD4+ T cells in the spleen, panLN’s (Figure 7a, bottom), Peyer’s patches, or mesenteric LNs (data not shown). Interestingly, as demonstrated in Figure 7c, MDC expression promoted the intensive recruitment not only of CCR4-expressing CD8+ T cells (9.2-fold), but also of APCs, which include CCR4+ B220+ cells (11.5-fold), CCR4+CD11b+ macrophages (9.2-fold), and CD11c+ dendritic cells (6.4-fold). This finding was further supported by assessing the severity of insulitis in pancreatic islets from 9- to 11-week-old MDC-TG mice (insulitis grades: 0, 17.0%; 1, 19.5%; 2, 15.5%; 3, 48.0%; total islets, 123) compared with age-matched non-TG NOD mice (insulitis scores: 0, 39.1%; 1, 40.2%; 2, 9.2%; 3, 11.5%; total islets, 87) (n = 3, P < 0.01) (data not shown).
Figure 7.
Intensive recruitment of CCR4-bearing T cells by MDC. The effect of MDC on the recruitment of CCR4-bearing CD4+ T cells and APCs to the pancreas was analyzed in MDC-TG (black bars, n = 3) and non-TG NOD mice (white bars, n = 3) by FACS. (a) Percentage and (b) absolute cell number of pancreas-infiltrating CCR4+CD4+ T cells. (c) Absolute number of CCR4+CD8+ T cells and APCs that infiltrated pancreas. Data shown are representative of three separate experiments.
MDC-mediated acceleration of disease.
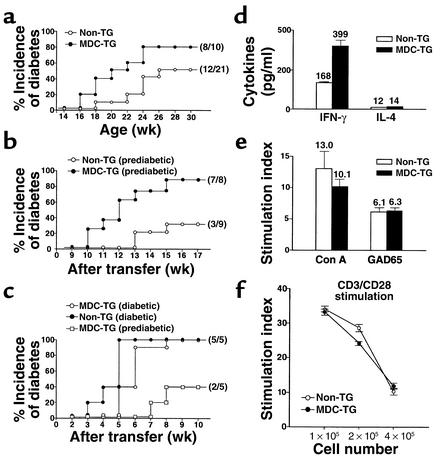
To assess the impact of this process on disease, we compared the clinical onset of disease in MDC-TG mice with their non-TG NOD littermates. As seen in Figure 8a, the intensive accumulation of CCR4-expressing T cells and APCs (Figure 7) accelerated the development of disease: 50% of MDC+ mice were diabetic by 142 ± 17 days, compared with 50% diabetes at 238 ± 30 days in MDC+ mice (P = 0.017). We also examined whether MDC-mediated recruitment enhances the diabetogenic capacity of T cells by performing adoptive transfer experiments, injecting splenocytes from MDC-NOD mice into NOD-scid recipient mice. As demonstrated in Figure 8b, splenocytes from prediabetic MDC-TG mice (8 weeks old) accelerated disease dramatically compared with splenocytes from non-TG NOD mice (25% disease onset at 70 ± 19 days and 50% at 77 ± 5 days with splenocytes from MDC-TG donors; 25% at 104 ± 18 days with splenocytes from Non-TG donors; P = 0.005). This indicates that the enhanced recruitment of CCR4-expressing T cells magnifies their pathogenicity. Not surprisingly, we also observed higher amounts of IFN-γ but not IL-4 when MDC-TG splenocytes were stimulated with GAD65 presented by APCs, indicating increased Th1 autoimmunity (Figure 8d). Interestingly, there were no differences in MDC-mediated T cell proliferation upon stimulation with GAD65 presented by APCs (Figure 8e) and engagement of anti-CD3 and anti-CD28 Ab’s (Figure 8f). We suggest that the recruitment of CCR4-bearing T cells into pancreatic islets intensifies Th1 immune responses, independent of the marked expansion of these T cells.
Figure 8.
MDC-mediated acceleration of disease. (a) Acceleration of diabetes in MDC-TG NOD mice. Diabetogenic potential was compared after adoptive transfer of splenocytes from (b) 8-week-old prediabetic (n = 3) or (c) 16- to 18-week-old diabetic (n = 3) MDC-TG and non-TG littermates into 8- to 10-week-old NOD-scid female recipients. Open circles, non-TG NOD littermates; filled circles, MDC-TG NOD mice. (d) MDC-mediated Th1 immune response. Splenocytes from 11-week-old MDC-TG and non-TG NOD females (three mice/group) were stimulated with the islet antigen, GAD65, presented by irradiated spleen cells as APCs. Culture supernatants were analyzed for cytokine secretion by ELISA. T cell proliferation was measured in response to GAD65 presented by APCs (e) or upon stimulation of costimulatory factors such as CD3/CD28 (f). Bars represent mean values ± SEM from two separate experiments. White bars and open circles, non-TG littermates. Black bars and filled circles, MDC-TG NOD females.
Discussion
We demonstrate in this study that CCR4 expression marks a pathogenic population of autoimmune T cells participating in the development of tissue-driven autoimmune reactions. The CCR4-bearing pathogenic T cell population was extensively expanded in the secondary lymphoid tissues such as spleen and panLN’s of NOD mice during the progression of autoimmune diabetes, implying that spleen and panLN’s are the sites for in vivo expansion and maintenance of the diabetogenic T cell population. An increase in the CCR4-positive population in spleen and panLN’s of 12-week-old prediabetic NOD mice may reflect the tight relationship between expansion of the pathogenic T cell pool in the secondary lymphoid organs and the onset of insulitis. This suggests that the CCR4-positive T cell population might be systemically expanded through antigenic stimulation in the lymphoid organs and subsequently infiltrates the target islets. In spite of extensive and active insulitis, intact β cells persist for long periods and no diabetes occurs, indicating the uncoupling of insulitis and diabetes. The molecular mechanisms and factors underlying the transition between passive insulitis and diabetes are unclear (37). Here we demonstrate an increase in the number of CCR4high T cells in the spleen of diabetic NOD mice (16 weeks old), compared with prediabetic (6 weeks and 12 weeks old) mice. This suggests that the transition accompanies the acquisition of pathogenic potential by CCR4high lymphoid populations, which controls the switch from insulitis to overt diabetes through the acquisition of new effector capabilities.
In the system used here, Th1 and Th2 cells were maximally polarized and activated (CD25+CD69+CD44high) to express their characteristic cytokine profiles, yet both subtypes expressed CCR4, in contrast to several recent reports (6–10). This distinction could represent species differences or a different degree of differentiation/activation between cells used in the experiments described here and those used by other investigators.
Chemokines produced in vivo at the sites of inflammation are likely to play a major role in the recruitment of particular cell types that infiltrate and participate in the pathological lesions. Presumably the differential expression of chemokine receptors may discriminate pathogenic T cells within bulk populations. Based on the observations that cells expressing the functional ligand for CCR4, TARC, were detected within infiltrated islets from prediabetic mice and that pancreatic MDC expression induced intensive recruitment of CCR4-positive cells and accelerated disease, we speculate that TARC or MDC is an initial signal as well as a modulator for recruitment and maintenance of antigen-specific T cell populations through T cell–APC interactions in target tissues (2, 11, 30–32). It was reported that MDC (34–36) and TARC (38) are constitutively expressed by dendritic cells in T cell areas of lymph nodes for the preferential recruitment of antigen-specific activated T cells through T cell–dendritic cell interactions. In the present study, MDC neutralization experiments (Figure 6) showed that LNs are the primary sites for the initial in vivo expansion of diabetogenic CCR4-positive T cells. Therefore, it is plausible that the CCR4 ligands TARC or MDC can play a dual role in the non-lymphoid as well as lymphoid organs: they can assume an inflammatory role when produced in the target organ and can also participate in the regulation of cell-cell interactions leading to lymphoid expansion in secondary lymphoid organs.
The interaction between CCR4 and MDC (or TARC) has been described as the primary requirement for in vivo biological phenomena such as recognition of memory T cells (39), cell migration (9), T cell development in the thymus (13), and dendritic cell maturation (34). However, little was known about the role of CCR4-dependent migration during autoimmune pathogenesis. This study demonstrated that CCR4-expressing T cells exhibited a remarkable homing capacity (Figure 3 and Table 2) accompanied by hyperexpression of adhesion/activation molecules (ICAM-1, MHC class I, CD95, and CD44) on their cell surface. Therefore, it appears that activation signals through T cell receptor/CD28 provided by APCs render T cells competent for recruitment to sites of immune and inflammatory reactions as well as Th1 cytokine secretion and firm adhesion through upregulation of CCR4 and adhesion/activation molecules, suggesting an inflammatory cascade in the diabetogenic pancreas. Thus, CCR4-positive T cell populations require APC participation for attaining their effector phenotype and eliciting Th1 immunity.
In addition, the enhanced recruitment of CCR4-bearing cells and APCs in NOD mice via expression of the ligand MDC resulted in acceleration of clinical disease. Interestingly, while 9-week-old MDC-TG NOD mice showed a significant increase in CD4+ and CD8+ T cell accumulation, the numbers of APCs were comparable to those in non-TG mice (data not shown). Therefore, we propose that CCR4-bearing T cells with an activated memory phenotype home to the pancreatic islets, affecting the pancreatic microenvironment, which subsequently allows the recruitment of newly arriving CCR4-expressing T cells as well as APCs such as B cells, dendritic cells, and macrophages. We suppose a scenario explaining an amplified cascade of CCR4-bearing T cells and APC accumulation by MDC. Accumulated CCR4-bearing T cells secrete multiple “inflammatory” chemokines (40), especially MCP-1 (2, 41), and these molecules are able to function as ligands for particular types of cells expressing appropriate chemokine receptors to recruit the pancreatic islets. We suggest that the CCR4/TARC (or MDC) axis plays an initial role in recruitment of pathogenic T cells and subsequently provides an amplified inflammatory cascade in the diabetogenic pancreas through continuous T cell–APC interactions. Combined with the accelerated disease transfer in the NOD-scid model, the presence of MDC appeared to amplify antigen-specific diabetogenicity of T cells, which become pathogenic populations in vivo.
We found that a small proportion of the CCR4-negative splenic T cell population was memory cells (CD45RBlow) (Figure 2a), indicating that the CCR4+ phenotype of CD4+ T cells found in the target pancreas after adoptive splenocyte transfer (Figure 6a) might be related to transferring CCR4-positive as well as CCR4-negative memory CD4+ T cells. We also observed that CD4 downregulation was induced in the pancreas-infiltrating CD4+ T cells, while no downregulation of other cell type–specific surface markers such as CD8, B220, CD11b, or CD11c in NOD/shi mice was detected (data not shown). This could be due to a counterregulatory mechanism acting on autoreactive CD4+ T cells in the inflamed tissues.
From the data presented we conclude that CCR4-positive cells possess disease-causing potential due to increased cell migratory capacity and an ability to establish firm contact between T cells and APCs, implying that CCR4-expressing cells are the authentic pathogenic population in vivo. Thus, CCR4 may be a contributing factor in facilitating the migration of autoimmune pathogenic T cell populations.
We suggest that CCR4-bearing T cells participate in autoimmune pathogenesis by eliciting the migration of antigen-specific memory T cell effectors. Modulation of the CCR4-bearing population may reduce the inflammatory response by allowing rapid clearance of pathogenic cells from the lesion. From this point of view, manipulation of CCR4-expressing T cells could comprise a potential target for the treatment of inflammatory disorders.
Acknowledgments
We thank M. Flodström, M. Horwitz, and C. King for critically reading the manuscript; F.-D. Shi, B. Balasa, and A. La Cava for discussions; and T. Krahl and E. Rodriguez for technical support.
Footnotes
See the related Commentary beginning on page 1611.
Conflict of interest: The authors have declared that no conflict of interest exists.
Nonstandard abbreviations used: macrophage-derived chemokine (MDC); MDC-transgenic (MDC-TG); thymus- and activation-regulated chemokine (TARC); concanavalin A (Con A); glutamic acid decarboxylase (GAD65); antigen-presenting cell (APC); secondary lymphoid-tissue chemokine (SLC); monocyte chemoattractant protein-1 (MCP-1); recombinant IL-2 (rIL-2); pancreatic lymph node (panLN); hematoxylin and eosin (H&E).
References
- 1.Luster AD. Chemokines: chemotactic cytokines that mediate inflammation. N Engl J Med. 1998;338:436–445. doi: 10.1056/NEJM199802123380706. [DOI] [PubMed] [Google Scholar]
- 2.Hedrick JA, Zlotnik A. Chemokines and lymphocyte biology. Curr Opin Immunol. 1996;8:343–347. doi: 10.1016/s0952-7915(96)80123-3. [DOI] [PubMed] [Google Scholar]
- 3.Bradley LM, Watson SL. Lymphocyte migration into tissue: the paradigm derived from CD4 subsets. Curr Opin Immunol. 1996;8:312–320. doi: 10.1016/s0952-7915(96)80118-x. [DOI] [PubMed] [Google Scholar]
- 4.Mackay CR. Chemokine receptors and T cell chemotaxis. J Exp Med. 1996;184:799–802. doi: 10.1084/jem.184.3.799. [DOI] [PMC free article] [PubMed] [Google Scholar]
- 5.Sallusto F, et al. Switch in chemokine receptor expression upon TCR stimulation reveals novel homing potential for recently activated T cells. Eur J Immunol. 1999;29:2037–2045. doi: 10.1002/(SICI)1521-4141(199906)29:06<2037::AID-IMMU2037>3.0.CO;2-V. [DOI] [PubMed] [Google Scholar]
- 6.Sallusto F, Lenig D, Mackay CR, Lanzavecchia A. Flexible programs of chemokine receptor expression on human polarized T helper 1 and 2 lymphocytes. J Exp Med. 1998;187:875–883. doi: 10.1084/jem.187.6.875. [DOI] [PMC free article] [PubMed] [Google Scholar]
- 7.Sallusto F, Lanzavecchia A, Mackay CR. Chemokines and chemokine receptors in T cell priming and Th1/Th2-mediated responses. Immunol Today. 1998;19:568–574. doi: 10.1016/s0167-5699(98)01346-2. [DOI] [PubMed] [Google Scholar]
- 8.Bonecchi R, et al. Differential expression of chemokine receptors and chemotactic responsiveness of type 1 T helper cells (Th1s) and Th2s. J Exp Med. 1998;187:129–134. doi: 10.1084/jem.187.1.129. [DOI] [PMC free article] [PubMed] [Google Scholar]
- 9.Lloyd CM, et al. CC chemokine receptor (CCR)3/eotaxin is followed by CCR4/monocyte-derived chemokine in mediating pulmonary T helper lymphocyte type 2 recruitment after serial antigen challenge in vivo. J Exp Med. 2000;191:265–274. doi: 10.1084/jem.191.2.265. [DOI] [PMC free article] [PubMed] [Google Scholar]
- 10.Teraki Y, Picker LJ. Independent regulation of cutaneous lymphocyte associated antigen expression and cytokine synthesis phenotype during human CD4 memory T cell differentiation. J Immunol. 1996;159:6018–6029. [PubMed] [Google Scholar]
- 11.Katz JD, Wang B, Haskins K, Benoist C, Mathis D. Following a diabetogenic T cell from genesis through pathogenesis. Cell. 1993;74:1089–1100. doi: 10.1016/0092-8674(93)90730-e. [DOI] [PubMed] [Google Scholar]
- 12.Mueller R, Bradley LM, Krahl T, Sarvetnick N. Mechanism underlying counterregulation of autoimmune diabetes by IL-4. Immunity. 1997;7:411–418. doi: 10.1016/s1074-7613(00)80362-3. [DOI] [PubMed] [Google Scholar]
- 13.Chantry D, et al. Macrophage-derived chemokine is localized to thymic medullary epithelial cells and is a chemoattractant for CD3 (+), CD4 (+), CD8 (low) thymocytes. Blood. 1999;94:1890–1898. [PubMed] [Google Scholar]
- 14.Annunziato F, et al. Macrophage-derived chemokine and EBI1-ligand chemokine attract human thymocytes in different stage of development and are produced by distinct subsets of medullary epithelial cells: possible implications for negative selection. J Immunol. 2000;165:238–246. doi: 10.4049/jimmunol.165.1.238. [DOI] [PubMed] [Google Scholar]
- 15.Shi FD, et al. Germ line deletion of the CD1 locus exacerbates diabetes in the NOD mouse. Proc Natl Acad Sci USA. 2001;98:6777–6782. doi: 10.1073/pnas.121169698. [DOI] [PMC free article] [PubMed] [Google Scholar]
- 16.Andrew DP, et al. C-C chemokine receptor 4 expression defines a major subset of circulating nonintestinal memory T cells of both Th1 and Th2 potential. J Immunol. 2001;166:103–111. doi: 10.4049/jimmunol.166.1.103. [DOI] [PubMed] [Google Scholar]
- 17.Bleul CC, Fuhlbriggem RC, Casasnovas JM, Aiuti A, Springer TA. A highly efficacious lymphocyte chemoattractant, stromal cell-derived factor 1 (SDF-1) J Exp Med. 1996;184:1101–1109. doi: 10.1084/jem.184.3.1101. [DOI] [PMC free article] [PubMed] [Google Scholar]
- 18.Lee DS, Tian J, Phan T, Kaufman DL. Cloning and sequence analysis of a murine cDNA encoding glutamate decarboxylase (GAD65) Biochim Biophys Acta. 1993; 1216:157–160. doi: 10.1016/0167-4781(93)90056-j. [DOI] [PubMed] [Google Scholar]
- 19.Hoogewerf A, Black D, Proudfoot AE, Wells TN, Power CA. Molecular cloning of murine CC CKR-4 and high affinity binding of chemokines to murine and human CC CKR-4. Biochem Biophys Res Commun. 1996;218:337–343. doi: 10.1006/bbrc.1996.0059. [DOI] [PubMed] [Google Scholar]
- 20.Youn BS, et al. Molecular cloning and characterization of a cDNA, CHEMR1, encoding a chemokine receptor with a homology to the human C-C chemokine receptor, CCR-4. Blood. 1997;89:4448–4460. [PubMed] [Google Scholar]
- 21.Imai T, et al. Macrophage-derived chemokine is a functional ligand for the CC chemokine receptor 4. J Biol Chem. 1998;273:1764–1768. doi: 10.1074/jbc.273.3.1764. [DOI] [PubMed] [Google Scholar]
- 22.Rollins BJ. Chemokines. Blood. 1997;90:909–928. [PubMed] [Google Scholar]
- 23.Kim CH, et al. Rules of chemokine receptor association with T cell polarization in vivo. J Clin Invest. 2001;108:1331–1339. doi: 10.1172/JCI13543. [DOI] [PMC free article] [PubMed] [Google Scholar]
- 24.Jansen A. Immunohistochemical characterization of monocytes-macrophages and dendritic cells involved in the initiation of the insulitis and beta-cell destruction in NOD mice. Diabetes. 1994;43:667–675. doi: 10.2337/diab.43.5.667. [DOI] [PubMed] [Google Scholar]
- 25.Bradley LM, Harbertson J, Watson SR. Memory CD4 cells do not migrate into peripheral lymph nodes in the absence of antigen. Eur J Immunol. 1999;29:3273–3284. doi: 10.1002/(SICI)1521-4141(199910)29:10<3273::AID-IMMU3273>3.0.CO;2-2. [DOI] [PubMed] [Google Scholar]
- 26.Kunkel EJ, et al. Expression of the chemokine receptors CCR4, CCR5, and CXCR3 by human tissue-infiltrating lymphocytes. Am J Pathol. 2002;160:347–355. doi: 10.1016/S0002-9440(10)64378-7. [DOI] [PMC free article] [PubMed] [Google Scholar]
- 27.Weiss L, et al. Induction of resistance to diabetes in non-obese diabetic mice by targeting CD44 with a specific monoclonal antibody. Proc Natl Acad Sci USA. 2000;97:285–290. doi: 10.1073/pnas.97.1.285. [DOI] [PMC free article] [PubMed] [Google Scholar]
- 28.Andrew DP, et al. STCP-1 (MDC) CC chemokine acts specifically on chronically activated Th2 lymphocytes and is produced by monocytes on stimulation with Th2 cytokines IL-4 and IL-13. J Immunol. 1998;161:5027–5034. [PubMed] [Google Scholar]
- 29.Imai T, et al. The T cell-directed CC chemokine TARC is a highly specific biological ligand for CC chemokine receptor 4. J Biol Chem. 1997;272:15036–15042. doi: 10.1074/jbc.272.23.15036. [DOI] [PubMed] [Google Scholar]
- 30.Godiska R, et al. Human macrophage-derived chemokine (MDC), a novel chemoattractant for monocytes, monocyte-derived dendritic cells, and natural killer cells. J Exp Med. 1997;185:1595–1604. doi: 10.1084/jem.185.9.1595. [DOI] [PMC free article] [PubMed] [Google Scholar]
- 31.Schaniel C, et al. Three chemokines with potential functions in T lymphocyte-independent and -dependent B lymphocyte stimulation. Eur J Immunol. 1999;29:2934–2947. doi: 10.1002/(SICI)1521-4141(199909)29:09<2934::AID-IMMU2934>3.0.CO;2-Q. [DOI] [PubMed] [Google Scholar]
- 32.Ghia P, Schaniel C, Rolink AG, Nadler LM, Cardoso AA. Human macrophage-derived chemokine (MDC) is strongly expressed following activation of both normal and malignant precursor and mature B cells. Curr Top Microbiol Immunol. 1999;246:103–110. doi: 10.1007/978-3-642-60162-0_13. [DOI] [PubMed] [Google Scholar]
- 33.Gonzalo JA, et al. Mouse monocyte-derived chemokine is involved in airway hyperreactivity and lung inflammation. J Immunol. 1999;163:403–411. [PubMed] [Google Scholar]
- 34.Tang HL, Cyster JG. Chemokine up-regulation and activated T cell attraction by maturing dendritic cells. Science. 1999;284:819–822. doi: 10.1126/science.284.5415.819. [DOI] [PubMed] [Google Scholar]
- 35.Katou F, et al. Macrophage-derived chemokine (MDC/CCL22) and CCR4 are involved in the formation of T lymphocyte-dendritic cell clusters in human inflamed skin and secondary lymphoid tissue. Am J Pathol. 2001;158:1263–1270. doi: 10.1016/S0002-9440(10)64077-1. [DOI] [PMC free article] [PubMed] [Google Scholar]
- 36.Vulcano M, et al. Dendritic cells as a major source of macrophage-derived chemokine/CCL22 in vitro and in vivo. Eur J Immunol. 2001;31:812–822. doi: 10.1002/1521-4141(200103)31:3<812::aid-immu812>3.0.co;2-l. [DOI] [PubMed] [Google Scholar]
- 37.André I, et al. Checkpoints in the progression of autoimmune disease: lessons from diabetes models. Proc Natl Acad Sci USA. 1996;93:2260–2263. doi: 10.1073/pnas.93.6.2260. [DOI] [PMC free article] [PubMed] [Google Scholar]
- 38.Lieberam I, Forster I. The murine beta-chemokine TARC is expressed by subsets of dendritic cells and attracts primed CD4+T cells. Eur J Immunol. 1999;29:2684–2694. doi: 10.1002/(SICI)1521-4141(199909)29:09<2684::AID-IMMU2684>3.0.CO;2-Y. [DOI] [PubMed] [Google Scholar]
- 39.Campbell JJ, et al. The chemokine receptor CCR4 in vascular recognition by cutaneous but not intestinal memory T cells. Nature. 1999;19:776–780. doi: 10.1038/23495. [DOI] [PubMed] [Google Scholar]
- 40.Bradley LM, et al. Islet-specific Th1, but not Th2, cells secrete multiple chemokines and promote rapid induction of autoimmune diabetes. J Immunol. 1999;162:2511–2520. [PubMed] [Google Scholar]
- 41.Grewal IS, et al. Transgenic MCP-1 in pancreatic islets produces monocyte-rich insulitis without diabetes: abrogation by a second transgene expressing systemic MCP-1. J Immunol. 1997;159:401–408. [PubMed] [Google Scholar]


