Abstract
The mouse coat color mutant mahoganoid (md) darkens coat color and decreases the obesity of Ay mice that ectopically overexpress agouti-signaling protein. The phenotypic effects of md are similar to those of the recently identified coat color mutant mahogany (Atrnmg). We report the positional cloning of mahoganoid, encoding a novel 494–amino acid protein containing a C3HC4 RING (really interesting new gene) domain that may function as an E3 ubiquitin ligase. The mutations in the mahoganoid allelic series (md, md2J, md5J) are all due to large retroviral insertions. In md and md2J, the result is minimal expression of the normal size transcripts in all tissues examined. Unlike Atrnmg/Atrnmg animals, we observe no evidence of neurological deficit or neuropathology in md/md mice. Body weight and body mass index (a surrogate for adiposity) measurements of B6.C3H-md-A md/+ and md/md animals on 9% and 45% kcal fat diets indicate that mahoganoid does not suppress body weight in B6.C3H animals in a gene dose-dependent fashion.
Introduction
Molecular cloning of the five extant monogenic forms of rodent obesity identified critical molecules in the pathways regulating energy homeostasis in animals and humans (1). The agouti (A) gene encodes a 131–amino acid peptide agouti-signaling protein (ASP) that is normally secreted only in the follicular cells of the dermal papilla of the skin (2–4). Mutations of agouti (e.g., Ay and Avy) that cause ectopic overexpression of ASP in the hypothalamus and skin result in a pleiotropic syndrome that includes increased lean and adipose tissue, yellow pelage (coat), hyperinsulinemia, hyperphagia, and hyperglycemia (3–5). ASP antagonizes the binding of
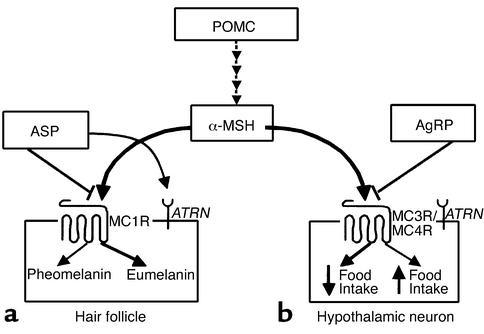
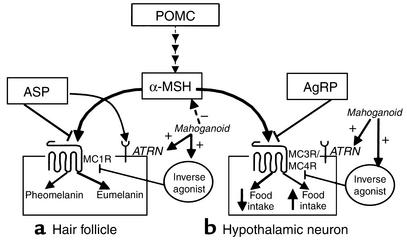
α-melanocortin stimulating hormone (α-MSH) to the melanocortin 1 receptor (MC1R), causing melanogenesis to switch from the production of black/brown pigment (eumelanin) to a yellow/red pigment (pheomelanin) (see Figure 1) (2). In the hypothalamus, agouti-related protein (AgRP) is the natural antagonist of MC3R and MC4R. AgRP also acts as an inverse agonist at MC4R in both the human and mouse (6, 7). In Ay mice, ectopically produced ASP competes with α-MSH for binding to MC3R and MC4R, resulting in hyperphagia, increased body fat, and disordered insulin homeostasis (8).
Figure 1.
Schematic of melanocortin-signaling pathways, specifically melanocortin signaling in the hair follicle and hypothalamus. α-MSH is a melanocortin peptide that is cleaved from the pro-opiomelanocortin precursor (POMC). (a) α-MSH acts on MC1R, resulting in an increase in cAMP to darken coat color. ASP antagonizes α-MSH binding at MC1R, resulting in pheomelanin synthesis. ATRN (mahogany) may function to downregulate or desensitize MC1R or may be involved in ASP processing or binding to MC1R. (b) α-MSH activates MC4R to decrease food intake and increase energy expenditure. AgRP competes with α-MSH for binding at MC4R/MC3R, resulting in increased food intake. Ay mice ectopically overproduce ASP, interfering with α-MSH signaling at MC4R/MC3R and resulting in an obese phenotype due to increased food intake.
Two other mutations, mahogany (Atrnmg, Chr 2) and mahoganoid (md, Chr 16), affect coat color and body weight. Both mutations are unique in their ability to suppress the obesity and darken the coat (umbrous effect) caused by mutations resulting in the ectopic overexpression of ASP. There are three reported alleles of mahogany, Atrnmg, Atrnmg-L, and Atrnmg-3J, that are coisogenic on mouse strains LDJ/Le, C3H/HeJ, and C3HeB/FeJ, respectively (9, 10). Atrnmg and Atrnmg-L are each the result of approximately 5 kb retrovirus insertions in introns 26 and 27, respectively, that disrupt the splicing of Atrn. Atrnmg-3J has a 5-bp deletion at nucleotide 2,809, introducing a stop codon that results in a severely truncated protein. Attractin (Atrn) encodes a single-pass transmembrane, approximately 210-kDa protein containing three EGF domains, two laminin-like EGF repeats, a CUB domain, two plexinlike repeats, a C-type lectin, and seven consecutive Kelch repeats (9, 10). The predicted structure of ATTRACTIN protein suggests that it functions as a receptor or receptor-like protein. The Atrnmg mutation does not suppress the obese phenotype of Mc4r-null mice or that of several monogenic obese models (Leprdb, Lepob, tub, Cpefat) (9, 10), but does suppress diet-induced obesity (10). Homozygosity for LDJ/Le Atrnmg backcrossed for six to eight generations onto a C57BL/6J background suppresses Ay- induced weight gain by increasing basal metabolic rate (11). In animals doubly mutant for mg and Ay, food intake is not reduced relative to controls (homozygous wild-type Ay/a and mg/mg a/a), but body weight is reduced due to higher metabolic rate (11). Mahogany mice are not hyperphagic on a C3H/HeJ background (12). Homozygous Atrnmg animals develop abnormal myelination and vacuolization throughout the brain and spinal cord in association with severe tremors and flaccid paresis (13). The tremors may account for the increased metabolic rate. The neuropathological changes characteristic of Atrnmg animals and the specificity of binding of ASP but not AgRP to ATRN (14) make it unlikely that ATRN plays a specific role in hypothalamic control of energy homeostasis, aside from its effects on muscle motor activity.
Md has effects on coat color and obesity in Ay mice that are analogous to Atrnmg. The md mutation originally arose spontaneously in the C3H/HeJ strain at The Jackson Laboratory (Bar Harbor, Maine, USA) in the early 1960s. Subsequently, four additional spontaneous mutations (md2J, md4J, md5J, and md6J) have been documented at this locus (http://www.informatics.jax.org/searches/allele_report.cgi?_Marker_key=11177). Like Atrn mg, mahoganoid darkens the back, ears, and tail of nonalbino mice (15, 16). This darkening effect is described as an “umbrous” coat. Md suppresses Ay-induced yellow pigmentation and Ay-induced obesity in a gene dose-dependent manner (17). Similar to Atrnmg on the C57BL/6J background, homozygosity for md on the C3H/HeJ background causes hyperphagia (11). The ability of md to induce hyperphagia suggests that the md gene product has effects on energy homeostasis distinct from epistatic effects in the context of overexpression of ASP (Ay). Genetic studies have positioned md, functionally, at the same level or upstream of MC1R and downstream of ASP based on findings that the Mc1re mutation (extension, resulting in a yellow coat) suppressed the coat color effect of md and that md suppressed both the yellow and obese phenotypes of Ay mice (17) (Figure 1). Linkage analysis positioned md on chromosome 16, about 2 cM from the centromere (18, 19). Identification of md and its function could provide additional insight into the control of melanocortin signaling. Here we report the positional cloning of the mouse mahoganoid through a combination of genetic mapping and bioinformatic approaches.
Methods
Animals.
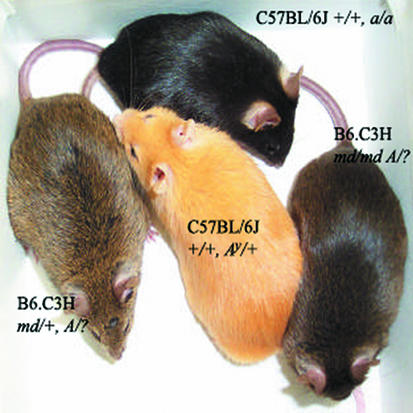
N7F14 B6.C3H-md-A (md/md and md/+) mice were obtained from The Jackson Laboratory. The coat color effect of the mutation is easiest to detect on an agouti (A) coat (Figure 2), hence these animals have been selected and bred for phenotypes at two loci on different chromosomes (md and A). Progeny for genetic mapping of the region around md were generated by mating md/md A/? × md/+ A/? animals of this congenic strain. The fact that this line was maintained by coat color selection offered the opportunity to map and reduce by meiotic recombination the C3H genetic interval containing the md locus. Mice were housed in a barrier facility under pathogen-free conditions with a 12-hour light/dark cycle. Mice were weaned at 21 days and were then given ad libitum access to 9% kcal fat Picolab Rodent Chow 20 (Purina Mills Inc., Richmond, Indiana, USA) or to 45% kcal fat D12451 (Research Diets Inc., New Brunswick, New Jersey, USA). Mice were fasted for 2 hours prior to sacrifice by CO2 asphyxiation at 105–120 days of age. Weight and nasoanal body length were measured. The kidneys were removed and immediately frozen at –80°C for sub-sequent isolation of genomic DNA. Other mice used were B6.V-Lepob (N30), B6.Cg-Ay (N66), C57BL/6J (F217), C3H/HeJ (F243), and C3H/HeJ-md2J (N2). All were obtained from The Jackson Laboratory.
Figure 2.
Coat colors. C57BL/6J +/+ Ay/a and C57BL/6J +/+ a/a mice have yellow and black pelage, respectively. Homozygosity for md results in a darkened pelage in Agouti (A/?) animals, whereas heterozygous md/+ animals have normal agouti (alternate black, yellow banding) pelage.
Microsatellite genotyping.
Genomic DNA was made from tail tips clipped at weaning using QIAamp Tissue Kit (QIAGEN Inc, Valencia, California, USA). Mice genotypes were determined for Whitehead Institute microsatellites in the region of md (http://www-genome.wi.mit.edu/cgi-bin/mouse/gmap) by PCR amplification. D16Mit182, D16Mit107, D16Mit154, D16Mit130, D16Mit129, D16Mit54, D16Mit159, D16Mit122, and D16Mit81 were scored using primers obtained from Research Genetics (Huntsville, Alabama, USA). PCR conditions consisted of 40 cycles of denaturation at 94°C for 30 seconds, annealing at 55°C for 30 seconds, and extension at 72°C for 45 seconds. PCR fragments were resolved on 6% denaturing polyacrylamide gels.
Genetic and physical mapping.
One hundred forty-nine progeny of an N7F14 B6.C3H-md/md A/? × N7F14 B6.C3H-md/+ A/? cross were used for genetic mapping of mahoganoid. Homozygosity for md was scored by observation of coat color (Figure 2). Homozygosity for md results in a darkening of the agouti coat color (umbrous); md/+ mice have an agouti coat color. Initially, the congenic C3H interval containing md was defined by scoring congenic B6.C3H-md/md A/? mice with microsatellite markers on proxi-mal chromosome 16 for B6 and C3H alleles. Next, all 149 progeny were scored for D16Mit182, D16Mit107, D16Mit154, D16Mit130, D16Mit129, D16Mit54, D16Mit159, D16Mit122, and D16Mit81 to identify recombinant md/md animals with B6/C3H heterozygous genotypes and md/+ animals with C3H/C3H homozygous genotypes. Once the minimal genetic interval was defined, all expressed sequence tags (ESTs) within the interval were obtained from the Whitehead radiation hybrid map (http://www-genome.wi.mit.edu/mouse_rh/rh_maps/Chr16.txt). Mouse and corresponding human genomic clones were identified through nucleotide basic local alignment search tool (nBlast) of ESTs and mouse microsatellite markers to online sources (http://www.ncbi.nlm.nih.gov; http://www.celera.com; http://www.genome.ucsc.edu; http://www.ensembl.org; http://www.informatics.jax.org). Mouse genomic clones were used to search these databases to construct a complete 2.5-Mb contig of mouse bacterial artificial chromosome clones (http://genomics.roswellpark.org/cgi-bin/mouse/markers.cgi?chr = 16) spanning the minimal interval containing md. All transcripts in the interval were identified using Celera (Rockville, Maryland, USA) and National Center for Biotechnology (NCBI; Bethesda, Maryland, USA) databases.
Sequence analysis of positional candidate genes.
To screen for mutations in the coding sequences of the transcripts and predicted genes mapping to the minimal contig, each of the exons was amplified from genomic DNA by PCR followed by amplicon purification by QIAquick Gel Extraction Kit (QIAGEN Inc.) and bidirectional fluorescent dideoxy termination sequencing (20). This process was prioritized so that the known transcripts were screened before the predicted genes. Sequences from C3H/HeJ +/+ and C3H/HeJ md2J/md2J (coisogenic on C3H/HeJ) were compared using Sequencher software 4.0.5 (Gene Codes Corp., Ann Arbor, Michigan, USA).
Southern blot analysis.
Genomic DNA of affected md, md2J, md4J, md5J, and md6J obtained from The Jackson Laboratory was analyzed by Southern blot analy-sis (21) using restriction enzymes PstI, EcoRI, HindIII, Sau3AI, MspI, and BglII (Roche Diagnostics Corporation, Indianapolis, Indiana, USA). Restriction fragments were separated by electrophoresis on 0.7% agarose gels, transferred by capillary action to a nylon membrane (Schleicher & Schuell Inc., Keene, New Hampshire, USA), prehybridized (Ultrahyb; Ambion Inc., Woodward, Texas, USA), and hybridized using a random-primed 32P-labeled C3H/HeJ genomic PCR-amplified fragment prepared using the following primers: probe 1, F: 5′-GATGGGGCTTGAGTCCTTAGA-3′, R: 5′-CCTCAGCCCAGCACTTT-CTCT-3′, flanking exon 12 of Riken full-length cDNA AK011747 (shown by mutation analysis to contain the md gene, see below); and probe 2, F: 5′-GGCAGGTGGGAACAGATGAGT-3′, R: 5′-CCGTCCGAGATGCCTGAGTAG-3′, spanning the intronic region between exon 11 and exon 12. Two cDNA probes (probes 3 and 4) spanning, respectively, exons 2–9 and exons 3–13 of AK011747, were prepared from pooled C57BL/6J cDNA obtained from liver, kidneys, lungs, spleen, brain, adipose, pancreas, and heart cDNA using the following primers: probe 3, F: 5′-TTGACACTCCCCATCCTGAAG-3′, R: 5′-TCCTGGTTGTT-CTTGTTCTCG, and probe 4, F: 5′-CCAG-TTTCCCTATGTCACCCC-3′, R: 5′-ATGG-ATGGGGAATGATGGAGA-3′. The blots were washed in 1× SSC/0.1% SDS twice for 10 minutes at room temperature and twice for 30 minutes at 64°C and exposed to x-ray film (RX-B; Denville, Metuchen, New Jersey, USA) at –80°C for 48 hours.
Northern blot analysis.
Northern blots of liver, heart, kidney, lung, skin, skeletal muscle, adipose, and brain tissue were performed using standard techniques (21). Total RNA was extracted using a commercial kit (Trizol; Invitrogen Corp., Carlsbad, California, USA) and size fractionated on a 1% agarose formaldehyde gel. Blot handling was as for Southern blots. Only probe 4 was used for Northern hybridizations.
Real time RT-PCR.
RNA was extracted from flash-frozen, freshly dissected whole organs using a commercial kit (Trizol; Invitrogen Corp.)and purified using RNeasy Mini kits (QIAGEN Inc.). cDNA was then made using SuperScript First-Strand Synthesis System for RT-PCR (Invitrogen Corp.) with 50 ng of random hexamers for each microgram of total RNA. A negative control for cDNA was made in an identical manner without adding the SuperScript II RT to each tube. The cDNA was diluted fivefold prior to use. A LightCycler (Roche Molecular Biochemicals, Mannheim, Germany) was used to quantify expression levels with 20-μl reactions consisting of 2 μl diluted cDNA, 16 μl FastStart DNA Master SYBR Green I mix (Roche Molecular Biochemicals), and 2 μl of primers (F: 5′-TGTCTCCCATCTCCTTCAGCC-3′; R: 5′-CTGTGTCTTGCCCTTCTGTAG-3′) spanning exon 11–12 of Riken cDNA AK011747. Each sample was run in triplicate with one negative control. β-actin (F: 5′-ATCGCTGCGCTGGTC-GTC-3′; R: 5′-GCTCTGGGCCTCGTCA-CC-3′) was used to normalize expression levels. Only one product was seen on the melting curves, so fluorescent acquisition was set at the extension stage. Relative expression levels were found by comparing expression levels in each organ to the level found in homozygous wild-type C57BL/6J mice in the same organ (22). PCR fragments were resolved on 2% agarose gel.
Generating restriction maps of md GENOMIC sequence.
Ensembl gene ENSMUSG00000022517, containing the complete genomic sequence of md, was identified through nBlast of transcript AK011747 into genomic DNA database Ensembl (Ensembl, Cambridge, United Kingdom). The genomic sequence obtained was used as a control template in creating the restriction map for the md. Sequencher software 4.0.5 (Gene Codes Corp.) was used on both the normal and inserted retroviral sequences to determine the restriction sites and fragment sizes for specific restriction enzymes.
Neuropathology.
Fifteen-week-old C3H.B6 md/md A/? and C57BL/6J +/+ male and female mice were sacrifice by CO2 asphyxiation, and the whole brain fixed overnight in 3.7% paraformaldehyde in PBS. One-year-old C3H.B6 md/md A/? male and female mice were also examined. Serial paraffin sections, including cortex, hippocampus, pons, thalamus, cerebellum, brain stem, midbrain, and hypothalamus, were cut and stained with hematoxylin and eosin (23). These sections were examined by light microscopy by James Goldman (Department of Pathology, Columbia University).
Body weight and length.
To assess the effects of md on energy homeostasis, at sacrifice at 105–120 days, body weight and nasoanal length were measured in male and female md/+ and md/md animals that had ingested 9% or 45% kcal fat diets since weaning at about 21 days of age.
Results
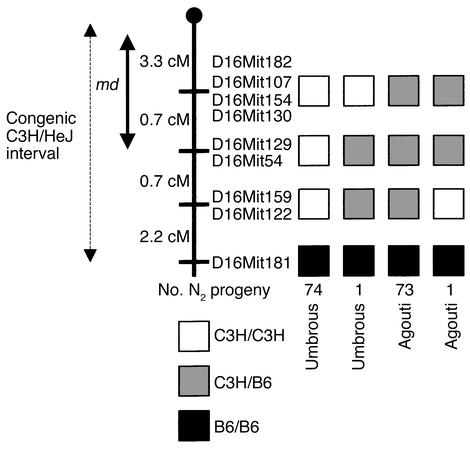
By genotyping congenic B6.C3H-md/md A/? mice for microsatellite genetic markers polymorphic between C57BL/6J and C3H/HeJ, the maximal congenic C3H/HeJ interval was determined to extend approximately 6.9 cM from the centromere to D16Mit181 (Figure 3). Genetic mapping of 149 progeny of a B6.C3H-md/+ A/? × B6.C3H- md/md A/? intercross, in which genotype for md was assigned by coat color, identified a double recombination event in the C3H congenic interval between markers D16Mit122/D16Mit159 distally and markers D16Mit54/D16Mit129 proxi-mally. Similarly, there was a single md/md mouse with a recombination between D16Mit54/D16Mit129 and D16Mit130/D16Mit154/D16Mit107/D16Mit182, narrowing the interval containing md to a region of approximately 4.0 cM proximal to D16Mit54/ D16Mit129 (Figure 3).
Figure 3.
Genetic map of region of proximal Chr.16 containing md. Map is based on 149 progeny of a B6.C3H-md-A md/md, A/? × B6.C3H-md-A md/+, A/? cross. The congenic C3H/HeJ interval is indicated. Genotype at md is inferred by coat color. The md/md A/? animals are umbrous (mahoganoid), and md/+ A/? are agouti. cM, centiMorgans.
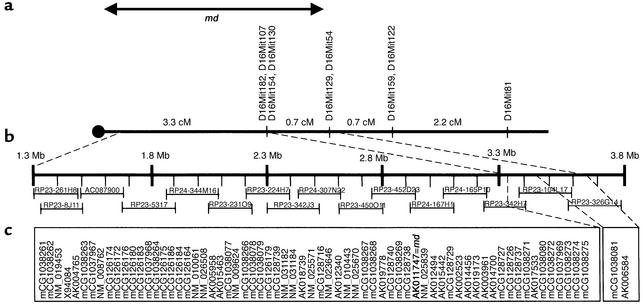
Using sequence databases at NCBI, Celera, Ensembl, The Jackson Laboratory, and University of California, Santa Cruz (see Methods for URL information), all mouse genomic clones in the 2.5-Mb interval containing md proximal to D16Mit129 and D16Mit54 were identified (Figure 4). Twenty-nine transcripts and 39 computationally predicted genes (24) were identified. Using nBlast, transcripts were compared against the Ensembl mouse cDNA database to obtain genomic sequences with exon predictions. These genes were then systematically analyzed as indicated below. The coding regions of 27 of the 29 known transcripts, excluding X94084 and AK004765, were systematically sequenced in md2J and coisogenic C3H/HeJ +/+ animals. By virtue of the disruptions described below in md2J and other members of the mahoganoid allelic series, Riken cDNA AK011747 was implicated as the mahoganoid transcript.
Figure 4.
Genetic and physical maps of md minimal interval. (a) Genetic map of proximal chromosome 16. Distances between markers indicated in centiMorgans (cM). (b) Mouse genomic clones spanning the minimal interval containing md. Distances indicated are in megabases (Mb). (c) Locations of all transcripts (identified by accession number) and predicted genes (all mCGs). Riken full-length cDNA AK011747 is the mahoganoid transcript (2,010 bp).
md2J, an 8 kb retroviral insertion within exon 12.
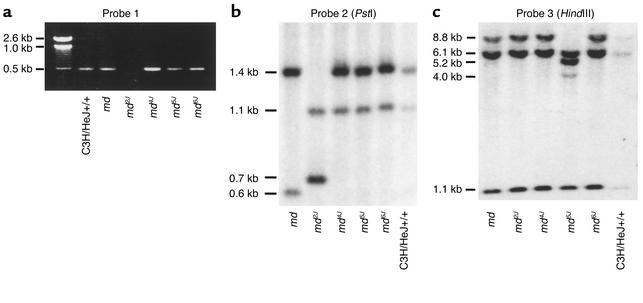
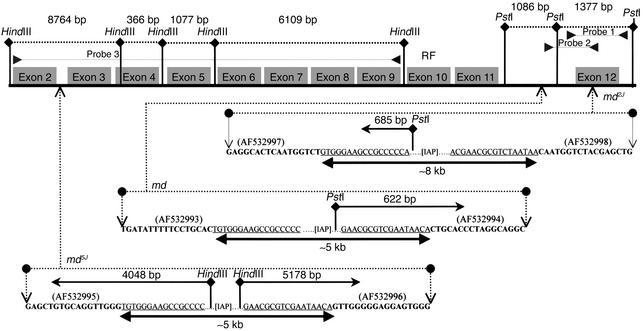
Each of the predicted coding sequences of ESTs, known genes, and computationally predicted genes in the minimum physical interval for mahoganoid were amplified from genomic DNA of an md2J/md2J mouse and a coisogenic nonmutant animal using intronic primers flanking the known or predicted exons in the interval. For the Riken cDNA clone AK011747, all exons except exon 12 were amplified from both the md2J/md2J and C3H/HeJ +/+ mice. For exon 12, the normal 589 bp C3H/HeJ allele could be amplified in the homozygous wild-type as well as all of the md alleles except md2J (Figure 5a). PCR amplification and subsequent bidirectional sequencing of predicted coding exons 2–16 from homozygous affected md, md2J, md4J, md5J, and md6J mice demonstrated normal genomic sequence. Southern blot analysis of md2J/md2J animals restricted with PstI, using probe 2, which contained part of exon 12 and its 5′ intronic region, showed a novel 0.7 kb fragment in the md2J/md2J animal compared with a 1.4 kb fragment corresponding to exon 12 in the C3H/HeJ coisogenic homozygous wild-type control and in mahoganoid alleles (md, md4J, md5J, md6J) (Figure 5b). The region of probe 2 containing part of exon 12 and its 5′ intronic region was then amplified and sequenced from genomic DNA and demonstrated an approximately 8 kb insertion in exon 12 of md2J (data not shown). The fragment was shown by sequence analysis to be a retroviral insertion (GenBank numbers AF532997 and AF532998) containing a PstI restriction site (Figure 6).
Figure 5.
PCR amplification and Southern blots analyses of md alleles. (a) PCR amplification of exon 12 from genomic DNA from all md alleles produces an approximately 0.5 kb fragment, except for md2J. (b) Southern blot of PstI digest of md allelic series (md, md2J, md4J, md5J, md6J) genomic DNA probed with part of exon 12 and its 5′ intronic region. The md2J revealed a new fragment of 0.7 kb and a lack of fragment of 1.4 kb corresponding to exon 12, whereas md showed a loss of a 1.1 kb fragment and a novel 0.6 kb fragment corresponding to the intronic region 5′ of exon 12. md4J, md5J, and md6J showed fragments of similar size to the C3H/HeJ+/+ control. (c) Southern blot of HindIII digest of md allelic series probed with cDNA for exons 2–9 shows novel restriction site in md5J.
Figure 6.
Restriction map and location/nature of mahoganoid mutations. (a) Restriction map of normal fragment sizes. (b) md, md2J, and md5J mutations are all due to retroviral insertions. md5J and md are due to an approximately 5 kb insertion located in the intronic region 3′ of exon 2 and 5′ of exon 12, respectively. md2J is due to an approximately 8 kb insertion within exon 12. Fragment sizes shown above the inserted sequences represent the sizes from the new restriction sites located within retrovirus insertion to the normal restriction site in the direction of the arrow. RF indicates the location of the RING finger domain located in exon 10. GenBank numbers for md with retrovirus insertions are indicated in parentheses adjacent to new sequences. Sequences in bold are normal sequences. The inserted sequences are underlined.
md5J, a 5 kb retroviral insertion in the intron 3′ of exon 2.
Southern blot analysis of md5J DNA restricted with HindIII (but not PstI, EcoRI, BglII, or Sau3AI) and probed with a cDNA corresponding to exons 2–9, demonstrated a different restriction pattern than the C3H/HeJ coisogenic homozygous wild-type control and the other md alleles (Figure 5c). The md5J DNA showed loss of an 8.8 kb fragment corresponding to the region of exons 2–4 and introduction of new 5.2 kb and 4.0 kb fragments. Similar results were obtained with a cDNA probe spanning exons 3–5 (data not shown). PCR amplification of genomic md5J DNA corresponding to the intronic region between exon 2 and exon 3 demonstrated a fragment approximately 5 kb larger than the C3H/HeJ coisogenic homozygous wild-type control (data not shown). Sequence analysis showed that md5J is a retroviral insertion (GenBank numbers AF532995 and AF532996) of approximately 5 kb in the intronic region 3′ of exon 2 (Figure 6).
md, a 5 kb retroviral insertion in the intron between exons 11–12.
Southern blot analysis of a PstI digest of md using probe 2 demonstrated a missing fragment of 1.1 kb and the presence of a new fragment of 0.6 kb corresponding to the intronic region 5′ of exon 12 (Figure 5b). PCR amplification in md genomic DNA of the intron between exons 11 and 12 demonstrated a fragment approximately 5 kb larger than the C3H/HeJ coisogenic +/+, suggesting that the md mutation is due to an insertion in this intron (data not shown). Sequence analysis of the PCR-amplified genomic DNA between exons 11 and 12 showed an inserted retroviral sequence (GenBank number AF532993 and AF532994) within the intron (Figure 6).
The insertions are intracisternal type A particle elements.
Comparison of the 5′ and 3′ regions of the insertions detected in md, md2J, and md5J with GenBank entries revealed that the insertion is a mouse retrovirus-like repetitive intracisternal type A particle (IAP) element matching GenBank number X04120. The IAP seen in the mahoganoid mutations reported here is similar to the element reported in mahogany (Atrnmg and Atrnmg-L) (12). The integrated IAP elements associated with the md mutations were flanked in all instances with canonical long terminal repeat sequences that are frequently observed in contiguous to retroviral IAP insertions (25).
Expression of mahoganoid alleles.
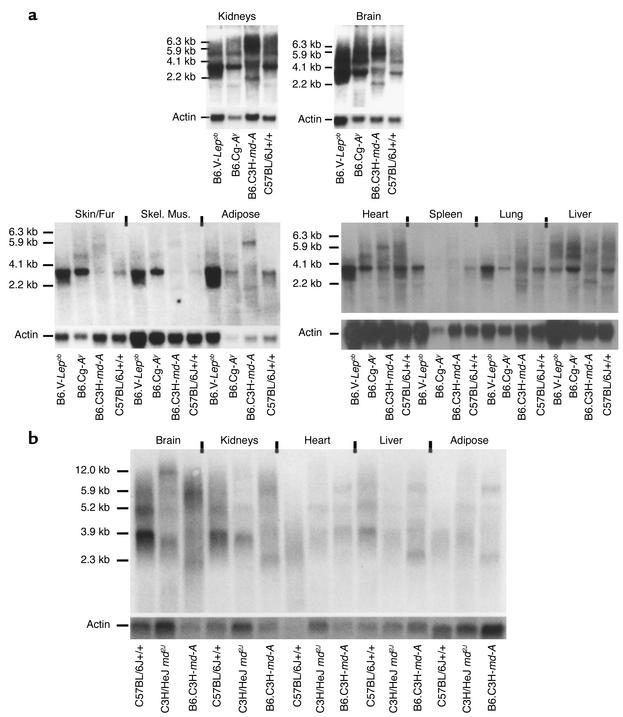
Northern blot analysis, using probe 5 that spans exons 3–13 containing the RING (really interesting new gene) finger domain in exon 10, demonstrated a 3.9 kb mahoganoid transcript expressed in kidney brain, heart, spleen, lung, skin, skeletal muscle, and adipose tissue in B6.V-Lepob, B6.Cg-Ay, and C57BL/6J +/+ mice (Figure 7a). An additional transcript of 5.2 kb was also seen in the kidney, brain, and liver; and a transcript of 1.9 kb in the kidney of C57BL/6J +/+, B6.V-Lepob, and B6.Cg-Ay mice (Figure 7a). Both were at lower levels of expression than the 3.9 kb transcript. Expression levels of the 3.9 kb and 5.2 kb transcripts were 10- to 20-fold lower in the md/md and md2J/md2J animals. Additionally, several aberrantly sized transcripts of 5.9, 5.5, 4.1, and 2.2 kb were observed in md/md animals and 12.0 kb and 3.6 kb transcripts in md2J/md2J mice (Figure 7b). The aberrantly sized transcripts were not sequenced.
Figure 7.
Northern blots. (a) The mahoganoid 3.9 kb transcript is expressed in all tissues tested. A 5.2 kb transcript is also seen in brain, kidneys, and liver. Only kidney showed a faint transcript of 1.9 kb. (b) The retrovirus insertion in md and md2J produces several aberrantly sized transcripts: 5.9 kb/5.5 kb/4.1 kb/2.2 kb in md and 12.0 kb/3.6 kb in md2J. Skel. Mus., skeletal muscle.
Using NCBI and Ensembl databases, KIAA0544 was identified as the human homologue of md. Like md, KIAA0544 is predicted to have 17 exons with a RING finger domain located in exon 10. NCBI Aceview analysis (http://www.ncbi.nih.gov/IEB/Research/Acembly/av.cgi?db=29&c=Gene&1=G_tl6_Hs16_10709_29_1_t16_Hs16_10709_29_2_5347) of KIAA0544 showed that the human homologue of md is defined by 139 sequences from 129 cDNA clones and produces, by alternative splicing, six mRNAs of variant a, 4.1 kb; variant b, 3.9 kb; variant c, 5.2 kb; variant d, 1.9 kb; variant e, 2.4 kb; and variant f, 2.2 kb. Using probe 4, which spans exons 3–13, only md transcripts of 3.9 kb, 5.2 kb, and 1.9 kb were detected in Northern blots. These transcripts are similar in size to human transcripts b, c, and d. The human 5.2 kb transcript is alternatively spliced to incorporate an additional 66-bp exon between exons 11 and 12 of the 3.9 transcript as well as to use an alternative splice site for the final exon. Further Blast analysis of md transcript AK011747 in the TIGR Mouse (Mus musculus) gene index (http://www.tigr.org/tigrscripts/tgi/tc_report.pl?species=mouse&tc=TC457132) identified mouse EST TC457132 that corresponds to the human 5.2 kb transcript. An expression profile of KIAA0544 in 14 different tissues (heart, brain, placenta, lung, liver, skeletal muscle, kidney, pancreas, spleen, thymus, prostate, testis, ovary, and small intestine) generated by RT-PCR, indicates that the human homologue has an expression pattern similar to mahoganoid in the mouse (26).
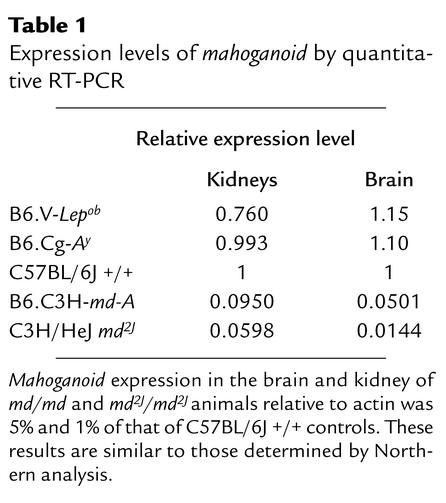
By quantitative RT-PCR using primers spanning exons 11–12, mahoganoid expression levels relative to actin were found to be similar in the brain and kidney among genetically obese Lepob/ Lepob and Ay/+ mice and C57BL/6J +/+ controls (Table 1). However, mahoganoid expression in the brain of md/md and md2J/md2J animals relative to actin was 5% and 1% of that of C57BL/6J +/+ controls (Table 1). The probe spanning exons 11–12 detects both the 3.9 kb and 5.2 kb transcripts. The quantitative RT-PCR results are consistent with the very low expression levels for these transcripts seen in the Northern blots of md and md2J RNA.
Table 1.
Expression levels of mahoganoid by quantitative RT-PCR
Mahoganoid does not suppress obesity related to a high-fat diet.
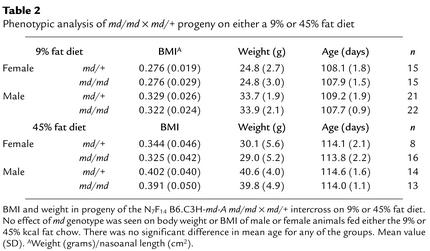
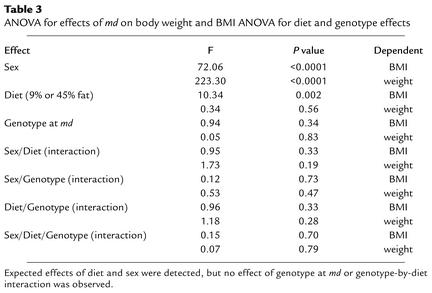
The dose-dependent effect of md in diminishing the obesity of Ay mice is striking and clear (17). The effect of this mutation on body composition in circumstances in which the gene is not in epistatic apposition to an obesity mutation is reportedly more subtle (17). We examined this issue by estimating the mouse equivalent of the body mass index (weight in grams/nasoanal length in square centimeters) (27) in progeny of the N7F14 B6.C3H-md-A md/md x md/+ intercross used for mapping and minimizing the C3H interval containing the md locus. The progeny were fed from the time of weaning at about 21 days with mouse chow containing either 9% or 45% kcal fat. Body weight and nasoanal length were measured every 2 weeks, and the animals were sacrificed at about 115 days when weight and nasoanal length were measured. Body mass index (BMI) was used as a surrogate measure for adiposity (27). As expected, animals fed 45% kcal as fat were heavier and had higher BMI than those fed 9% fat. However, no effect of md genotype was seen on body weight or BMI of animals fed either the 9% or 45% kcal fat chow (Table 2). No significant diet-by-genotype interaction was seen for either BMI or body weight as determined by ANOVA (Table 3). It is important to note that we looked only at md/+ and md/md animals in this analysis because these were the only genotypes issuing from the md/+ × md/md mapping cross.
Table 2.
Phenotypic analysis of md/md × md/+ progeny on either a 9% or 45% fat diet
Table 3.
ANOVA for effects of md on body weight and BMI ANOVA for diet and genotype effects
Absence of a neurological phenotype in md/md mice.
Md/md animals are neurologically normal at 15 weeks and at 1 year of age, without obvious tremor or movement disorder. Gross and microscopic examination of the midbrain, cerebellum, pons, hippocampus, hypothalamus, thalamus, cortex, and brainstem demonstrated normal anatomy with no evidence of vacuolization or dysmyelination as is observed in the mahogany mouse (data not shown).
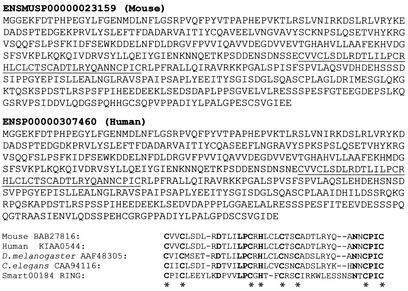
Mahoganoid encodes a 494–amino acid protein containing a C3HC4 RING domain from amino acids 240–278 (Figure 8). The human homologue, KIAA0544 (http://www.ncbi.nlm.nih.gov/LocusLink/LocRpt.cgi?l=76564), maps to 16p13.3 and is 81% identical in amino acid sequence. The RING finger domain of KIAA0544 is 99% identical to mahoganoid C3HC4 RING domain. There are homologous genes in Drosophila melanogaster and Caenorhabditis elegans with 43% and 37% identity of amino acids, respectively, that include the highly conserved C3HC4 RING domains (Figure 8).
Figure 8.
Mahoganoid protein (BAB27816): 494 amino acids containing a C3HC4 RING finger domain (underlined). Amino acid comparison of mahoganoid RING domain with Smart00184 (c-Cbl) and other proteins that have E3 ubiquitin-protein ligase activity (33), suggesting a general function of this domain. Human (KIAA0544), D. melanogaster (AAF48305), and C. elegans (CAA94116) homologues of mouse mahoganoid have the conserved C3HC4 RING finger. Conserved amino acids are bold. *The conserved cysteine and histidine residues found in all C3HC4 RING finger domains (34).
Discussion
Coat color mutations in mice have provided unique insights into the molecular physiology of melanocortin-related control of coat color and energy homeostasis in mice and other mammals (28). Remarkably similar (sometimes identical) pathways/molecules are involved in these disparate phenotypes. G protein–coupled melanocortin receptors (MC1R in skin, MC3R and MC4R in brain) mediate the effects of the physiologic ligand, α-MSH, and antagonists, ASP and AgRP (Figure 1). Binding of α-MSH to MC1R in the hair follicle, or to MC3R and MC4R in the hypothalamus, increases intracellular cAMP and increases the production of eumelanin in the hair follicle or decreases food intake by effects in the hypothalamus. Conversely, antagonism of MC1R by ASP in the hair follicle, or of MC4R by AgRP in the hypothalamus, produces increased pheomelanin in the hair follicle and increased food intake by effects in the hypothalamus. Constitutive overexpression of ASP in the Ay mouse outside of the hair follicle best demonstrates the analogies between the two pathways since the yellow coat color of these mice is due to ASP antagonism of MC1R and the increased weight and adiposity is due to ASP antagonism of MC3R and MC4R in the hypothalamus (28). Other genes, such as mahogany and mahoganoid, modulate the activity of this pathway in skin and the brain (17). Here we present evidence that the mahoganoid allelic series is due to mutations in a RING finger protein whose function is unknown but that has a strong impact on the melanocortin signaling. Mutations in the mahoganoid allelic series (md, md2J, and md5J) are due to large retroviral insertions that disrupt the expression of md. Retroviral insertions have been shown to affect gene expression in other coat color mutations such as dilute (29), agouti (2), and mahogany (10). Tissue expression data indicate that md is ubiquitously expressed with highest expression in the brain and kidney. Expression of normal mahoganoid transcripts is greatly reduced in md/md and md2J/md2J mice in all tissues examined by both Northern blot analysis and quantitative RT-PCR. The ability to identify md was greatly expedited by the availability of near-complete human and mouse genomic sequence and annotation.
Mutations of md in mice act as suppressors of obesity and yellow coat color that are associated with constitutive overexpression of Asp in the Ay mouse, but do not alter the yellow coat color phenotype of Mc1re-deficient mice (extension mutants) (17). Genetically, mutations in md are epistatic to Ay and Mc1re is epistatic to md, suggesting that mahoganoid is functionally distal to ASP and proximal to MC1R (Figure 1). The epistatic relationship appears to be similar in the hair follicle and the hypothalamus since mahoganoid is able to suppress both the yellow coat color phenotype induced by constitutive ASP antagonism of MC1R as well as to suppress the obesity induced by ASP antagonism of MC3R and MC4R (17). Furthermore, these mutations of mahoganoid appear to be loss-of-function alleles because the phenotypes of the various alleles are all similar and because mutations in the md and md2Jalleles result in loss of normal gene expression in all tissues examined (Figure 7). On the basis of similarities between the ASP/MC1R and AgRP/MC3R/MC4R pathways, we suggest that the normal mahoganoid allele acts through a similar mechanism in the hair follicle and hypothalamus, decreasing signaling through MC1R and MC3R/MC4R to produce increased pheomelanin production and increased body weight, respectively.
Both mg and md show epistatic effects on Ay coat color and adiposity.
Mahogany and mahoganoid have similar effects on coat color, but it is not yet clear if the mechanisms by which they confer their effects on body mass are similar. When expressed on an agouti (A/A or A/a) coat, mahogany mice have darker coat color than md (17). Mahogany fully suppresses Ay obesity, while md rescues about 80% of the Ay obesity phenotype (17). Atrnmg/Atrnmg mice are leaner than +/+ mice of the same strain and have approximately 20% higher levels of energy expenditure by indirect calorimetry, possibly secondary to the muscle tremors attributable to the associated spongy degeneration in the CNS (14). The effects of mg and md on body weight in nonobese animals are much more subtle. Barsh reported that female A/A md/md animals fed standard lab chow were heavier than md/+ or +/+ animals at 12–40 weeks (17); we did not see this effect in our approximately 115-day-old male and female animals fed 9% or 45% fat chow (Table 2). Atrnmg is due to deficiency of attractin, a transmembrane protein with binding specificity for ASP but not AgRP. Attractin is thought to act by localizing ASP to MC1R (10). Atrnmg specifically and fully suppresses obesity due to widespread overexpression of Asp in the Ay mouse, possibly by virtue of loss of the ability to keep ASP in proximity to MC3R/MC4R in the hypothalamus and/or by virtue of the tremors caused by neurodegeneration (14). In comparison, mahoganoid mice have no obvious neurological, behavioral, gross, or microscopic CNS anatomic phenotype. The quantity of Atrn expression in the various mg alleles parallels the effects of the mg alleles on pigmentation and neurodegeneration, with the Atrnmg-3J allele showing the lowest Atrn expression and having the most significant effects on coat color and neurodegeneration, while the Atrnmg-L allele conversely shows the highest Atrn expression and mildest phenotype (12).
The primary impact of mahoganoid on energy homeostasis is apparently via the melanocortin-signaling pathway(s) in the brain. This effect is clearest when amplified by overexpressing ASP in the brain (as in the Ay animal). This situation is reminiscent of what is seen in the neuropeptide Y (Npy) knockout mouse, where, despite a profound effect of the protein on food intake and energy metabolism, knockout of the gene does not have much effect on food intake or body composition of the knockout animal (30). However, Npy–/– substantially reduces the obesity of Lepob/Lepob mice (30). Additional studies of energy intake, energy expenditure, and body composition will be required to assess the effects of md on energy homeostasis.
Mahoganoid is a ubiquitously ex-pressed protein with a C3HC4 RING finger domain that is similar to the RING finger domain of the proto-oncogene c-Cbl. The RING finger, an evolutionarily conserved cysteine/histidine residue containing motif, Cys-X2-Cys-X9-39-Cys-X1-3-His-X2-3-Cys/His-X2-Cys-X4-48-Cys-X2-Cys (31), identi-fied in more than 200 proteins, is a small zinc-binding domain often found in subunits of multiprotein complexes (32). The RING finger binds two zinc atoms in a unique “cross-brace” system. RING fingers are located close to amino or carboxyl termini of proteins and may be associated with other domains to form larger conserved motifs like the RING finger-B box-a-helical coiled-coil motif (31). The RING domain is a common structural element in a superfamily of E3 ubiquitin ligase complexes: e.g., SCF (Skp1-Cdc53/CUL1-F-box protein) family, APC (anaphase-promoting complex) family, c-Cbl and MDM2 proto-oncogene, and members of the IAP family of antiapoptotic proteins (33). Based on protein-sequence homology to E3 RING domain ubiquitin ligases, mahoganoid may itself function as an E3 ubiquitin ligase (34). Ubiquitylation involves conjugation of proteins with the highly conserved 76–amino acid protein, ubiquitin. The process targets proteins for degradation in the proteosome, vacuoles, or lysosomes, or regulates cellular processes through translational control, protein kinase activation, or transcriptional regulation (35, 36). The specificity of the ubiquitylation process is conferred by the E3 ubiquitin ligase, of which there are many (36). Ubiquitylation has been implicated in the regulation of myriad cellular processes including cell cycling, apoptosis, cellular differentiation, DNA repair, and stress responses. Inherited loss-of-function mutations in other E3 ubiquitin ligase genes have been implicated in juvenile Parkinson disease, Angelman syndrome, breast and ovarian cancer susceptibility (BRCA1), and von Hippel Lindau disease (37). Ubiquitylation proceeds through a three-step process, involving ubiquitin-activating (E1), ubiquitin-conjugating (E2), and ubiquitin-ligating (E3) enzymes. The E3 enzymes mediate the transfer of ubiquitin from the E2 to the substrate and there-by confer substrate specificity (34). The mahoganoid protein may de-crease signaling through MC1R and MC3R/MC4R by increasing expression or activity of an inverse agonist of MC1R and MC3R/MC4R, influencing the physical proximity or binding of ASP and AgRP to their receptors by influencing binding of ATRN to ASP or by decreasing the amount of α-MSH available to MC1R or MC3R/MC4R through sequestration or turnover of α-MSH (Figure 9). If mahoganoid is an E3 ligase, identification of the targets of mahoganoid ubiquitylation should define additional components of this system. In this context, it should be noted that knockout mice lacking E3 ubiquitin ligase UBR1 activity have decreased body weight due to reduction in both skeletal muscle and adipose tissues (38). This phenotype supports a role for the E3 ligase in regulating body mass and composition.
Figure 9.
Three potential models for Mahoganoid biological effects: Mahoganoid may decrease signaling through MC1R or MC3R/MC4R by increasing expression or activity of an inverse agonist of MC1R or MC3R/MC4R; influencing the physical proximity or binding of ASP and AgRP to their receptors by influencing binding of ATRN to ASP; and decreasing the availability of α-MSH to its receptors through sequestration or turnover of α-MSH.
The human homologue of mahoganoid maps to 16p13.3. Loci for coronary heart disease, hypertension, and type 2 diabetes have been mapped to this region in Indo-Mauritians and Pondicherian families of Indian origin (39). These phenotypes could be related to allelic variation in mahoganoid. This possibility can now be tested by mutation analysis and association studies. Molecules that mimic the effects of mahoganoid by suppressing the production or action of its cognate protein might be effective agents in the treatment of obesity.
Acknowledgments
We thank James Goldman for neuropathological examination of the brains of md/md mice, Jean Claude Chevre for assistance with some aspects of the bioinformatics, Streamson C. Chua and Naoki Matsuoka for helpful discussions, the Columbia Cancer Center DNA sequencing facility, and Trung Ha for figure preparation. This work is supported by NIH grants DK-52431 and DK-26687.
Footnotes
Conflict of interest: The authors have declared that no conflict of interest exists.
Nonstandard abbreviations used: agouti-signaling protein (ASP); α-melanocortin stimulating hormone (α-MSH); melano-cortin 1 receptor (MC1R); agouti-related protein (AgRP); expressed sequence tags (ESTs); National Center for Biotechnology (NCBI); intracisternal type A particle (IAP); body mass index (BMI); really interesting new gene (RING).
References
- 1.Leibel RL, Chung WK, Chua SC. The molecular genetics of rodent single gene obesities. J Biol Chem. 1997;272:31937–31940. doi: 10.1074/jbc.272.51.31937. [DOI] [PubMed] [Google Scholar]
- 2.Bultman SJ, Michaud EJ, Woychik RP. Molecular characterization of the mouse agouti locus. Cell. 1992;71:1195–1204. doi: 10.1016/s0092-8674(05)80067-4. [DOI] [PubMed] [Google Scholar]
- 3.Miller MW, et al. Cloning of the mouse agouti gene predicts a secreted protein ubiquitously expressed in mice carrying the lethal yellow mutation. Genes Dev. 1993;7:454–467. doi: 10.1101/gad.7.3.454. [DOI] [PubMed] [Google Scholar]
- 4.Michaud EJ, et al. A molecular model for the genetic and phenotypic characteristics of the mouse lethal yellow (Ay) mutation. Proc Natl Acad Sci USA. 1994;91:2562–2566. doi: 10.1073/pnas.91.7.2562. [DOI] [PMC free article] [PubMed] [Google Scholar]
- 5.Wolff GL, Galbraith DB, Domon OE, Row JM. Phaeomelanin synthesis and obesity in mice. Interaction of the viable yellow (Avy) and sombre (eso) mutations. J Hered. 1978;69:295–298. doi: 10.1093/oxfordjournals.jhered.a108953. [DOI] [PubMed] [Google Scholar]
- 6.Nijenhuis W, Oosterom J, Adan R. AgRP(83–132) acts as an inverse agonist on the human melanocortin-4 receptor. Mol Endocrinol. 2001;15:164–171. doi: 10.1210/mend.15.1.0578. [DOI] [PubMed] [Google Scholar]
- 7.Haskell-Luevano C, Monck EK. Agouti-related protein functions as an inverse agonist as a constitutively active brain melanocortin-4 receptor. Regul Pept. 2001;99:1–7. doi: 10.1016/s0167-0115(01)00234-8. [DOI] [PubMed] [Google Scholar]
- 8.Ollmann MM. Antagonism of central melanocortin receptors in vitro and in vivo by agouti-related protein. Science. 1997;278:135–138. doi: 10.1126/science.278.5335.135. [DOI] [PubMed] [Google Scholar]
- 9.Nagle DL, et al. The mahogany protein is a receptor involved in suppression of obesity. Nature. 1999;398:148–152. doi: 10.1038/18210. [DOI] [PubMed] [Google Scholar]
- 10.Gunn TM, et al. The mouse mahogany locus encodes a transmembrane form of human attractin. Nature. 1999;398:152–156. doi: 10.1038/18217. [DOI] [PubMed] [Google Scholar]
- 11.Dinulescu DM, et al. Mahogany (mg) stimulates feeding and increases basal metabolic rate independent of its suppression of agouti. Proc Natl Acad Sci USA. 1998;95:12707–12712. doi: 10.1073/pnas.95.21.12707. [DOI] [PMC free article] [PubMed] [Google Scholar]
- 12.Gunn T. Molecular and phenotypic analysis of attractin mutant mice. Genetics. 2001;158:1683–1695. doi: 10.1093/genetics/158.4.1683. [DOI] [PMC free article] [PubMed] [Google Scholar]
- 13.Kuramoto T, Kitada K, Inui I, Sasaki Y, Ito K. Attractin/Mahogany/Zitter plays a critical role in myelination of the central nervous system. Proc Natl Acad Sci USA. 2001;98:559–564. doi: 10.1073/pnas.98.2.559. [DOI] [PMC free article] [PubMed] [Google Scholar]
- 14.He L, et al. A biochemical function for attractin in agouti-induced pigmentation and obesity. Nat Genet. 2001;27:40–47. doi: 10.1038/83741. [DOI] [PubMed] [Google Scholar]
- 15.Lane PW. New mutants. Mouse News Letter. 1960;22:35. [Google Scholar]
- 16.Lane PW, Green MC. Mahogany, a recessive color mutation in linkage group V of the mouse. J Hered. 1960;51:228–230. [Google Scholar]
- 17.Miller KA, et al. Genetic studies of the mouse mutations mahogany and mahoganoid. Genetics. 1997;146:1407–1415. doi: 10.1093/genetics/146.4.1407. [DOI] [PMC free article] [PubMed] [Google Scholar]
- 18.Green, M.C. 1989. Genetic variants and strains of the laboratory mouse. Oxford University Press. Oxford, United Kingdom. 1–876.
- 19.Roderick T, Davisson M, Lane P. Chromosome 16 and mahoganoid md. Mouse News Letter. 1976;55:18. [Google Scholar]
- 20.Chung WK, et al. Exonic and intronic sequence variation in the human leptin receptor gene (LEPR) Diabetes. 1997;46:1509–1511. doi: 10.2337/diab.46.9.1509. [DOI] [PubMed] [Google Scholar]
- 21.Sambrook, J., Fritsch, E.F., and Maniatis, T. 1989. Molecular cloning: a laboratory manual. Cold Spring Harbor Laboratory Press. Plainview, New York, USA. 9.31–9.57.
- 22.Pfaffl MW, et al. Real-time RT-PCR quantification of insulin-like growth factor (IGF)-1, IGF-1 receptor, IGF-2, IGF-2 receptor, insulin receptor, growth hormone receptor, IGF-binding proteins 1,2 and 3 in the bovine species. Domest Anim Endocrinol. 2002;22:91–102. doi: 10.1016/s0739-7240(01)00128-x. [DOI] [PubMed] [Google Scholar]
- 23.Roderick T, Donahue L, Samples R, Kim J, Naggert J. Mice with mutations in the mahogany gene atrn have cerebral spongiform changes. J Neuropathol Exp Neurol. 2001;60:724–730. doi: 10.1093/jnen/60.7.724. [DOI] [PubMed] [Google Scholar]
- 24.Venter JC, et al. The sequence of the human genome. Science. 2001;291:1304–1351. doi: 10.1126/science.1058040. [DOI] [PubMed] [Google Scholar]
- 25.Lower R. The pathogenic potential of endogenous retroviruses: facts and fantasies. Trends in Microbiol. 1999;7:350–356. doi: 10.1016/s0966-842x(99)01565-6. [DOI] [PubMed] [Google Scholar]
- 26.Nagase T, et al. Prediction of the coding sequences of unidentified human genes. IX. The complete sequences of 100 new cDNA clones from brain which can code for large proteins in vitro. DNA Res. 1998;5:31–39. doi: 10.1093/dnares/5.1.31. [DOI] [PubMed] [Google Scholar]
- 27.Bahary N, et al. Microdissection of proximal mouse chromosome 6: identification of RFLPs tightly linked to the ob mutation. Mamm Genome. 1993;4:511–515. doi: 10.1007/BF00364786. [DOI] [PubMed] [Google Scholar]
- 28.Yeo GSH, Farooqi IS, Challis BG, Jackson RS, O’Rahilly S. The role of melanocortin signalling in the control of body weight: evidence from human and murine genetic models. QJM. 2000;93:7–14. doi: 10.1093/qjmed/93.1.7. [DOI] [PubMed] [Google Scholar]
- 29.Seperack PK, Mercer JA, Strobel MC, Copeland NG, Jenkins NA. Retroviral sequences located within an intron of the dilute gene alter dilute expression in a tissue-specific manner. EMBO J. 1995;14:2326–2332. doi: 10.1002/j.1460-2075.1995.tb07227.x. [DOI] [PMC free article] [PubMed] [Google Scholar]
- 30.Palmiter RD, Erickson JC, Hollopeter G, Baraban SC, Schwartz MW. Life without neuropeptide Y. Recent Prog Horm Res. 1998;53:163–199. [PubMed] [Google Scholar]
- 31.Saurin AJ, Borden KLB, Boddy MN, Freemont PS. Does this have a familiar RING? Trends Biochem Sci. 1996;21:208–214. [PubMed] [Google Scholar]
- 32.Borden K, Freemont PS. The RING finger domain: a recent example of a sequence-structure family. Curr Opin Struct Biol. 1996;6:395–401. doi: 10.1016/s0959-440x(96)80060-1. [DOI] [PubMed] [Google Scholar]
- 33.Zheng N, Wang P, Jeffrey PD, Pavletich NP. Structure of a c-Cbl-UbcH7 complex: RING domain function in ubiquitin-protein ligases. Cell. 2000;102:533–539. doi: 10.1016/s0092-8674(00)00057-x. [DOI] [PubMed] [Google Scholar]
- 34.Joazeiro CA, Weissman AM. RING finger proteins: mediators of ubiquitin ligase activity. Cell. 2000;102:549–552. doi: 10.1016/s0092-8674(00)00077-5. [DOI] [PubMed] [Google Scholar]
- 35.Conaway RC, Brower CS, Conaway JW. Emerging roles of ubiquitin in transcription regulation. Science. 2002;296:1254–1258. doi: 10.1126/science.1067466. [DOI] [PubMed] [Google Scholar]
- 36.Weissman AM. Themes and variations on ubiquitylation. Nat Rev Mol Cell Biol. 2001;2:169–178. doi: 10.1038/35056563. [DOI] [PubMed] [Google Scholar]
- 37.Layfield R, Alban A, Mayer JR, Lowe J. The ubiquitin protein catabolic disorders. Neuropathol Appl Neurobiol. 2001;27:171–179. doi: 10.1046/j.1365-2990.2001.00335.x. [DOI] [PubMed] [Google Scholar]
- 38.Kwon YT, Xia Z, Davydov IV, Lecker SH, Varshavsky A. Construction and analysis of mouse strains lacking the ubiquiting ligase UBR1 (E3α) of the N-end rule pathway. Mol Cell Biol. 2001;21:8007–8021. doi: 10.1128/MCB.21.23.8007-8021.2001. [DOI] [PMC free article] [PubMed] [Google Scholar]
- 39.Francke S, et al. A genome-wide scan for coronary heart disease suggests in Indo-Mauritians a susceptibility locus on chromosome 16p13 and replicates linkage with the metabolic syndrome on 3q27. Hum Mol Genet. 2001;10:2751–2765. doi: 10.1093/hmg/10.24.2751. [DOI] [PubMed] [Google Scholar]


