Abstract
Apart from its role in the synthesis of protein and nitric oxide (NO), and in ammonia detoxification, the amino acid arginine exerts an immunosupportive function. We have studied the role of arginine in immune defense mechanisms in the developing postnatal immune system. In suckling mice, arginine is produced in the small intestine. In F/A-2+/+ transgenic mice, which overexpress arginase in their enterocytes, circulating and tissue arginine concentrations are reduced to 30–35% of controls. In these mice, the development and composition of the T cell compartment did not reveal abnormalities. However, in peripheral lymphoid organs and the small intestine, B cell cellularity and the number and size of Peyer’s patches were drastically reduced, and serum IgM levels were significantly decreased. These phenotypes could be traced to an impaired transition from the pro– to pre–B cell stage in the bone marrow. Cytokine receptor levels in the bone marrow were normal. The development of the few peripheral B cells and their proliferative response after in vitro stimulation was normal. The disturbance in B cell maturation was dependent on decreased arginine levels, as this phenotype disappeared upon arginine supplementation and was not seen in NO synthase– or ornithine transcarbamoylase–deficient mice. We conclude that arginine deficiency impairs early B cell maturation.
Introduction
Arginine is a precursor for the synthesis of protein, nitric oxide (NO), creatine, agmatine, and polyamines, and is an intermediate in the detoxification of ammonia via the ornithine cycle. Judged by nitrogen balance, arginine is not an essential amino acid. In adults, it is produced in the kidney (1, 2) from circulating citrulline (3) synthesized by enterocytes in the small intestine (4). In adult humans, the endogenous biosynthetic capacity for arginine, amounting to approximately 20% of daily expenditure, is relatively small compared with its daily requirement (5). Hence, a dietary supply may become indispensable under conditions of increased demand such as growth (5) and tissue repair (6), or decreased dietary supply (7). For this reason, arginine is now considered a conditionally essential amino acid.
Arginine has been reported to have an immunosupportive effect, especially under catabolic conditions (8). In conjunction with this, arginine has been shown to accelerate wound healing (9). On this basis, it is added to postoperative supplemental formulas at doses as high as 100 g per kg formula (10). However, the molecular mechanism underlying the beneficial effect of arginine on lymphocyte biology has remained unclear. Since it may be difficult to assess the role of arginine in immune defense mechanisms in individuals under various forms of catabolic stress, we decided to study the role of arginine in the postnatal development of the lymphoid system in a transgenic model that suffers from a selective arginine deficiency.
In rapidly growing suckling rodents, endogenous arginine biosynthesis compensates for the insufficient supply of arginine via the milk (11). In this period, the intestine rather than the kidney plays a major role in arginine biosynthesis (12, 13). The selective decrease in circulating arginine in neonatal patients who suffer from necrotizing enterocolitis suggests a similar role for the enterocytes in arginine metabolism in man (14). On this basis, we developed a transgenic mouse model in which arginase I (A-I, EC 3.5.3.1) is overexpressed in the enterocytes of the small intestine only by coupling the A-I gene to the intestinal fatty acid binding protein promoter/enhancer (15). Hence, the enterocytes in these mice are no longer net producers of arginine and may even break down dietary and circulating arginine more avidly, so that circulating arginine levels decline to 30% of control levels. In the current study, we used this model to dissect the immunomodulatory effect of arginine.
Here, we demonstrate that arginine deficiency affects early B cell maturation in the bone marrow, but not T cell development in the thymus. In secondary lymphoid organs, like spleen and Peyer’s patches (PPs), the number of B cells is decreased, though resident B cells proliferate normally upon in vitro stimulation. In addition, the plasma level of IgM is reduced in F/A-2 transgenic animals. These findings suggest a direct involvement of arginine in B cell maturation.
Methods
Transgenics.
A chimeric construct of the intestinal fatty acid binding protein promoter/enhancer element and the hepatic arginase minigene was used to generate transgenic mice on the FVB strain background (16). The line with the highest expression level of arginase, designated F/A-2 (16), was used in the current investigation. Spf-ash (sparse-fur and abnormal skin and hair) mice and mice deficient in nitric oxide synthase-1 (NOS1), NOS2, and NOS3 had a C57/BL6 background and were purchased from The Jackson Laboratory (Bar Harbor, Maine, USA). Litters discovered in the morning were assigned neonatal day 0 (ND 0). Animal experiments were done in accordance with the guidelines of the local Animal Research Committee of the American Medical Center of the University of Amsterdam.
Tissue and blood sampling.
Pups were separated from their mothers and kept at 37°C for 1 hour prior to sacrifice. Blood was collected after decapitation and centrifuged for 2 minutes at 4°C. Tissue samples were collected, flushed in ice-cold PBS, and rapidly frozen in liquid nitrogen. Serum and tissue samples were kept at –70°C until analysis.
Cell preparation and culture.
Intraepithelial lymphocytes (IELs) and lamina-propria lymphocytes (LPLs) were isolated as described (17). Briefly, the small intestine was removed, trimmed free of mesentery, flushed with ice-cold PBS to remove luminal content, cut into 1-cm fragments, and incubated for 30 minutes at 37°C in calcium-free medium containing 1 mM EDTA and 1 mM DTT. This was followed by a 30-minute incubation in RPMI culture medium supplemented with 20 U/ml DNase to remove enterocytes and IELs. For isolation of LPLs, PPs were also removed. From the remaining intestinal tissue, a cellular suspension was obtained with an automated mechanical tissue disintegration device (Medimachine System; DAKO Corp., Carpinteria, California, USA). For preparing spleen, thymus, and mesenteric lymph node cell suspensions, 40-μm filter cell strainers were used. Bone marrow cell suspensions were obtained by flushing femurs and tibias with DMEM. Cells were suspended in DMEM containing 10% FBS and counted. Spleen and intestinal cell suspensions were centrifuged in sterile Ficoll-Hypaque (Pharmacia Biotech AB, Uppsala, Sweden). Mononuclear cells were transferred to cold PBS containing 0.5% BSA, 0.3 mM EDTA, and 0.01% sodium azide for flow cytometry, or to DMEM supplemented with 10% FBS for culture.
In vitro stimulation and proliferation.
Triplicate cultures of splenic cells containing 105 B cells were started with LPS (E. coli EH100: 15 μg/ml culture medium, a gift from C. Galanos, Max Planck Institute for Immunobiology), goat F(ab′)2 anti-mouse μ chain (20 μg/ml; Jackson ImmunoResearch Laboratories Inc., West Grove, Pennsylvania, USA), anti-CD40 antibody (clone HM40-3; 4 μg/ml; PharMingen, San Diego, California, USA), or IL-4 (500 U/ml; PharMingen), either alone or in combination for the indicated times. [3H]methylthymidine was added 6 hours before cells were harvested.
Flow cytometry.
Monoclonal antibodies to mouse CD3ε, CD4, CD8, CD19, CD21, CD23, CD24 (clone M1/69), CD25, CD43 (clone S7), CD45 (clone 6B2), BP-1, integrin αIEL, and IgD were either from our collection or were purchased from PharMingen or Southern Biotechnology Associates (Birmingham, Alabama, USA). They were used unlabeled or biotin-labeled, followed by staining with appropriately labeled secondary antibodies or streptavidin, or were covalently labeled with an appropriate fluorochrome. Goat F(ab′)2 anti-mouse IgM and goat F(ab′)2 anti-rat IgG were from Caltag Laboratories Inc. (Burlingame, California, USA). Fluorochromes used were FITC, phycoerythrin (PE), Cy-5, and a tandem dye of Cy-5 and PE. Nonspecific binding of antibodies was blocked by incubation with 5% normal mouse serum. Cells were analyzed by flow cytometry using a FACScan or FACSCalibur flow cytometer in conjunction with CellQuest software (Becton, Dickinson and Co., San Diego, California, USA).
Histology and immunohistochemistry.
For analyses of spleen and PPs, tissues were quick-frozen, sectioned at 6 μm, and fixed in dehydrated acetone for 10 minutes at room temperature. Sections were incubated with the following rat anti-mouse monoclonal antibodies: anti-CD3ε (KT-3), anti-CD45R (B220), anti–MAdCAM-1 (MECA-367), and anti-sialoadhesin (SER-4) (18). After washing in PBS, sections were incubated with the appropriate dilution of the peroxidase-conjugated second-step reagent (Jackson ImmunoResearch Laboratories Inc.) in 5% newborn calf serum and 5% normal mouse serum in PBS. Double labeling was performed as described (18). Peroxidase activity was visualized with 3,3′-diaminobenzidine and 0.01% H2O2. Alkaline phosphatase activity was visualized with nitroblue tetrazolium chloride and 5-bromo-4-chloro-3-indolylphosphate toluidine salt according to the manufacturer’s instructions (Boehringer Mannheim GmbH, Mannheim, Germany).
RT-PCR.
Bone marrow and thymus of ND 18 mice were used for mRNA isolation using Trizol (Life Technologies Inc., Gaithersburg, Maryland, USA). For RT-PCR the following primer sets were used (nt indicates nucleotides): IL-7: 5′-CAAGGCACACAAACACTGGT-3′ (gene identification [GI]: 6680432; nt 869–888) and 5′-TATGCTGACGGCAGCAGTCA-3′ (nt 1,188–1,169); IL-7αR R: 5′-CAGGATGGAGACCTAGAAGA-3′ (GI: 11362611; nt 123–142) and 5′-TCTCTGTGGGATTGTTGTTCT-3′ (nt 626–606); IL-7γR: 5′-GCAGTACCGGAGCAACAGA-3′ (GI: 404067; nt 588–606) and 5′-GGCTGCAGACTCTCAGTCA-3′ (nt 992–974); SDF-1α: 5′-ATCAGTGACGGTAAACCAGT-3′ (GI: 393179; nt 133–152) and 5′-GACCCCAGTCAGTGCTGT-3′ (nt 484–467); SDF-1β: 5′-ATCAGTGAC-GGTAAACCAGT-3′ (GI: 393181; nt 128–147) and 5′-GGCGTCTGACTCACACCT-3′ (nt 377–360); CXCR4: 5′-GGACCTGTGGCCAAGTTCTTAGT-3′ (GI: 1772445; nt 1,418–1,440) and 5′-CCAAACAAACCATCACACAGCAT-3′ (nt 1,641–1,619); Cyclophilin: 5′-CCATCGTGTCATCAAGGACTTCAT-3′ (GI: 192864; nt 295–318) and 5′-TTGCCATCCAGCCAGCCAGGAGGTCT-3′ (nt 510–489). PCR was performed twice on every cDNA sample and the mean was calculated. The OD of each specific band was corrected for that of cyclophilin. Wild-type bone marrow levels were normalized to 100%.
Quantification of serum Ig levels.
Serum was collected from 1- to 6-week-old wild-type and homozygous F/A-2 transgenic littermates. IgG1, IgG2A, IgG2B, IgG3, IgM, and IgA levels were each quantified in 96-well plates using ELISA-based assays according to the manufacturer’s instructions (Southern Biotechnology Associates).
Results
Impaired development of PPs in arginine-deficient transgenic mice.
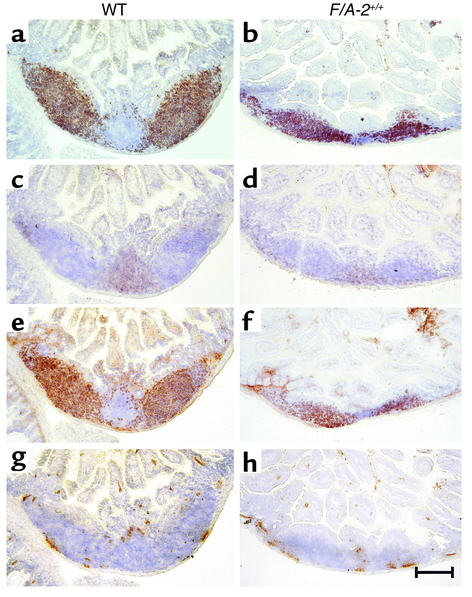
The gross phenotype of homozygous F/A-2 transgenic (F/A-2+/+) mice has been described elsewhere (16). In suckling mice, the transgenic intestinal arginase activity caused a decrease in circulating plasma arginine concentration to 80 μM, compared with approximately 250 μM in wild-type controls. A striking abnormality in the F/A-2+/+ mice was the macroscopic absence of PP’s, even though whole-mount immunohistochemical staining for VCAM-1 revealed that F/A-2+/+ mice had developed a normal number of PP anlagen after the first postnatal week. The impaired development of PPs appeared to be critically dependent on arginine availability, as arginine injections restored the development of PPs to normal. Figure 1 shows a PP anlage in the small intestine of an F/A-2+/+ mouse at 3 weeks. The PPs hardly protrude from the serosa and show hypoplasia of the B cell and T cell areas (Figure 1, b and d), though B cell follicles remain identifiable. In contrast, PPs in normal mice consist of large B cell follicles (Figure 1a) and smaller T cell–rich areas surrounding the follicles (Figure 1c). Both control and F/A-2+/+ B cells were positive for membrane-bound IgM (mIgM) (Figure 1, e and f). Interaction between integrin α4β7 and the mucosal vascular addressin MAdCAM-1 is essential for lymphocyte homing to the PPs (19). MAdCAM-1 appeared normally expressed on high-endothelial venules within the PPs in both control and F/A-2+/+ mice (Figure 1, g and h). In untreated F/A-2+/+ mice, PPs became macroscopically identifiable at 6–7 weeks of age, demonstrating that their development in F/A-2+/+ mice was temporarily suspended but not abolished.
Figure 1.
Expression of CD45R (B220), IgM, CD3ε, and MAdCAM in wild-type (WT) and F/A-2+/+ PPs. Histological examination of small intestine occasionally reveals a small PP in ND 21 F/A-2+/+ animals. These PPs are reduced in size and do not protrude from the serosal surface (right column), compared with PPs from wild-type littermates (left column). Nevertheless, immunohistochemical staining for B220-positive B cells (a and b), CD3+ T cells (c and d), and IgM-positive B cells (e and f) revealed the presence of segregated T cell and B cell areas in F/A-2+/+ PPs. Endothelial cells in sinuses lining the PPs normally express MAdCAM-1 (g and h). Sections were counterstained with hematoxylin. Bar, 200 μM.
T cell populations in central and peripheral lymphoid organs.
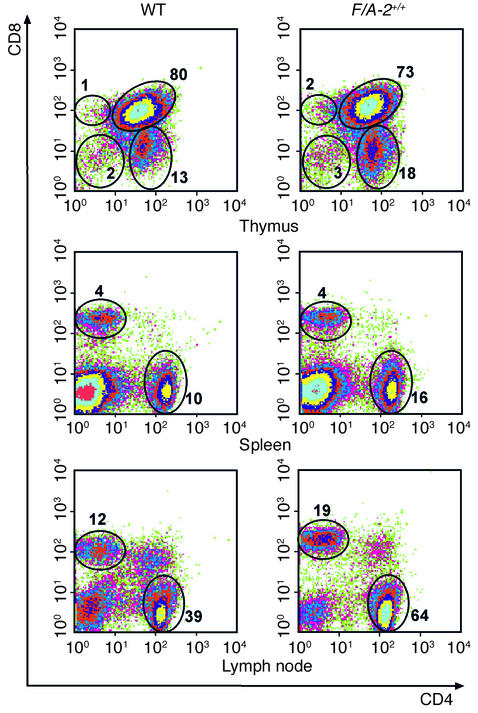
T cells were isolated from thymus, spleen, cervical lymph nodes, mesenteric lymph nodes, and intestine. In the thymus, absolute cell numbers were lower in F/A-2+/+ mice, but not if corrected for the lower body mass of these mice (16). At ND 21, the fraction of CD3ε-positive cells and the cellular distribution of the CD4 and CD8 markers showed no major differences between wild-type and F/A-2+/+ mice (Figure 2, upper panels), indicating that maturation and selection of thymocytes is not hampered by arginine deficiency. Also, analysis of the immature, CD4–, CD8– population with the CD25 and CD44 markers did not reveal an unbalanced development (data not shown).
Figure 2.
Flow cytometric analysis of T lymphocytes from thymus, spleen, and lymph nodes of 3-week-old wild-type and F/A-2+/+ mice. Cells were stained with antibodies to CD4 and CD8, and the percentage of CD4–, CD8–; CD4+, CD8–; CD4–, CD8+; and CD4+, CD8+ cells is indicated. Data shown are representative of the analysis of six mice of either genotype.
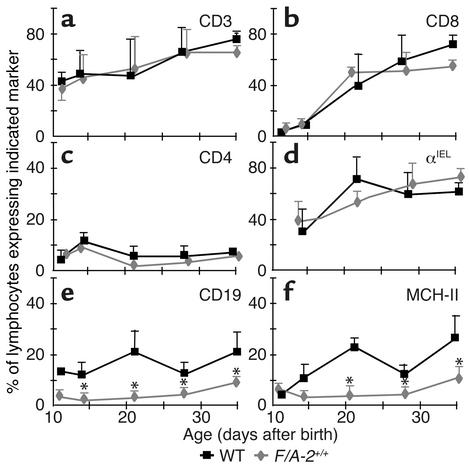
In the spleen (Figure 2, middle panels) and lymph nodes (Figure 2, lower panels) of F/A-2+/+ mice, CD4+ and CD8+ T cells were readily found at 3 weeks of age and had normal distribution. Both peripheral and mesenteric lymph nodes were normally present in F/A-2+/+ mice. Similarly, the relative number of intestinal CD3+, CD4+, and CD8+ T cells did not differ significantly between transgenic and wild-type mice (Figure 3, a–c). Also, the relative number of intestinal IELs expressing the gut-homing integrin αIEL was not affected (Figure 3d).
Figure 3.
Prevalence of T and B lymphocytes in the small intestine of wild-type and F/A-2+/+ mice. The relative percentage of intestinal lymphocytes, including those from PPs, that express the T cell markers CD3 (a), CD8 (b),CD4 (c), integrin αIEL (d), the B cell markers CD19 (e), and MHC-II (f), was determined in wild-type (squares) and F/A-2+/+ small intestine (diamonds) by flow cytometry. The percentage of cells that expresses T cell markers is similar in both groups, but the percentage that expresses B cell markers is significantly reduced in F/A-2+/+ small intestine. Data shown are mean ± SEM of six mice of each genotype. Significant differences (P < 0.05), determined by one-way ANOVA followed by Dunnett’s multiple comparison test, are indicated by asterisks.
Reduced number of B cells in the intestine of arginine-deficient mice.
Due to their small size in the transgenic gut, the normally B cell–rich PPs were not excised but were included in the analysis of the intestinal LPL populations of both wild-type and F/A-2+/+ mice. Figure 3, e and f, shows an almost complete lack of lymphocytes expressing the pan–B cell marker CD19 and the MHC II antigen I-A in the small intestine of F/A-2+/+ mice during the first four postnatal weeks. At ND 21, the small intestine of F/A-2+/+ mice contained fivefold fewer CD19+ and I-A+ B cells than did that of wild-type mice (Table 1). The B cells in the LPL fraction were all located in PPs, as CD19+ or I-A+ cells could not be recovered after excision of PPs from wild-type small intestine prior to tissue disintegration (not shown). In order to establish whether the effect of arginine on PP development is the result of diminished production of the NO from arginine, we investigated mice carrying null mutations of any of the three isoforms of the NOS gene (20–22). At three weeks of age, normal PP development was observed in NOS1-, NOS2-, and NOS3-deficient mice compared with their appropriate controls (16). Furthermore, B cell numbers were not decreased in intestinal lymphocyte populations isolated from NOS-deficient mice (Table 1). In addition, ornithine transcarbamoylase–deficient Spf-ash mice, which suffer from a reduction in all free amino acid plasma levels, displayed normal PPs and intestinal B cell numbers (Table 1).
Table 1.
Expression of B cell surface markers on intestinal lymphocytes of various mouse strains at 3 weeks of age
Selective defects of B cell subpopulations in other peripheral lymphoid organs.
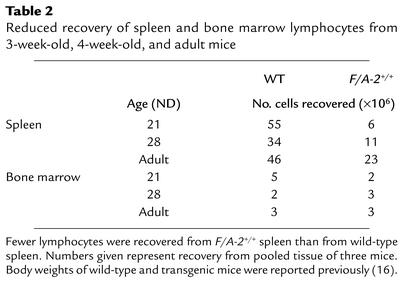
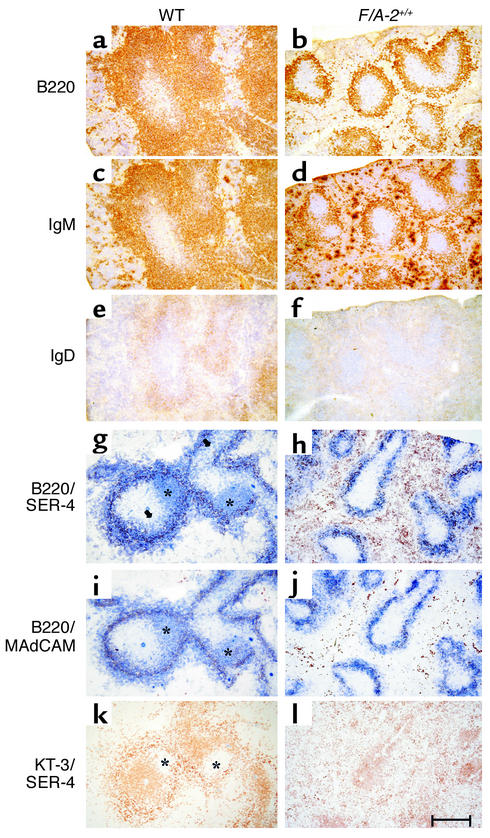
Relative to wild-type mice, the fraction of B lymphocytes in lymph nodes was reduced approximately 40% in 3- and 4-week-old F/A-2+/+ mice (from 9% to 5% at 3 weeks and from 13% to 8% at 4 weeks of age). The tenfold lower number of splenic cells in F/A-2+/+ mice compared with controls (Table 2) reflected the severe reduction in spleen size in suckling F/A-2+/+ mice (16). In the white pulp of the spleen of 3-week-old wild-type mice, a wide cuff of B cells expressing B220 (Figure 4a), IgM (Figure 4c), and, to a lesser extent, IgD (Figure 4e) surrounded the T cells in the periarteriolar lymphatic sheath (Figure 4k). In the transgenic spleen, the area of B220+ or IgM+ B cells surrounding the periarteriolar lymphatic sheath was reduced approximately threefold in thickness (Figure 4, b and d). We next analyzed the presence of B cell follicles within the marginal zone. To this end, splenic sections of 3-week-old mice were simultaneously stained for the presence of B cells (indicated by B220) and marginal zone macrophages (SER-4) (Figure 4, g and h); B cells (B220) and the sinus-lining cells of the marginal zone (MECA-367) (Figure 4, i and j); or T cells (KT-3) and marginal zone macrophages (SER-4) (Figure 4, k and l). B cell follicles are visualized in wild-type mice as B220+ (Figure 4, g and i) and CD3– (Figure 4k) areas within the SER-4+ and MAdCAM-1+ marginal zone. In F/A-2+/+ mice, B cell follicles were virtually absent (Figure 4, h, j, and l). These data indicate that the splenic architecture is not disturbed in F/A-2+/+ mice, even though the reduced number of B cells impairs the formation of normal B cell follicles.
Table 2.
Reduced recovery of spleen and bone marrow lymphocytes from 3-week-old, 4-week-old, and adult mice
Figure 4.
Immunohistochemical analysis of expression of B220, IgM, and IgD in the spleen of 3-week-old wild-type and F/A-2+/+ mice. Serial sections of wild-type (left column) and F/A-2+/+ (right column) spleen were stained for the expression of CD45R (B220; a and b), IgM (c and d), or IgD (e and f). The B220+ and IgM+ B cell layer surrounding the periarteriolar lymphatic sheath is reduced to a small rim of cells. Splenic marginal zones were visualized by staining marginal zone macrophages for the presence of sialoadhesin (SER-4, red in g and h) and staining sinus-lining cells in the marginal zone for the presence of MAdCAM-1 (MECA-367). In the same sections, B220-positive cells are stained blue. Follicles of blue B220-positive B cells within the borders of the marginal zones (*) are easily distinguishable in wild-type (g and i), but are virtually absent in F/A-2+/+ spleen (h and j). Serial sections were also stained for CD3 (KT-3; k) and sialoadhesin (SER-4; l). CD3-negative areas within the SER-4–positive marginal zone (*) mark B cell follicles. Micrographs shown are representative of six mice examined. Bar, 100 μM.
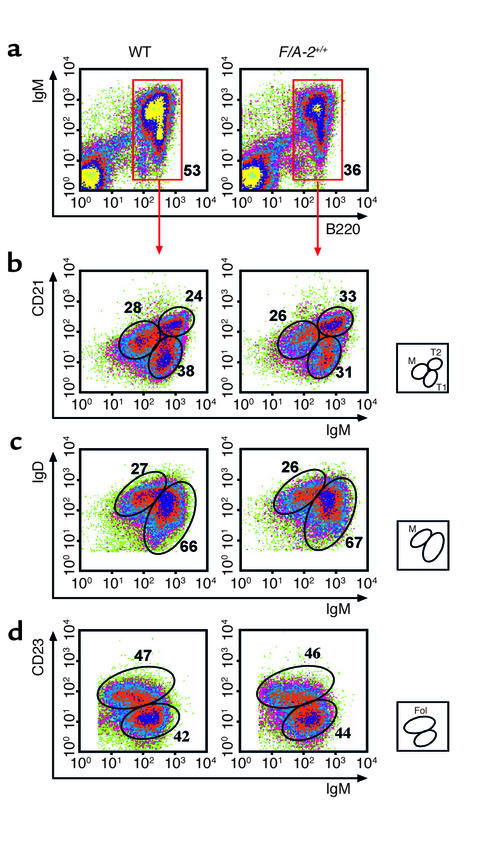
The differentiation and maturation stage of F/A-2+/+ splenic B cells was further assessed by flow cytometry (Figure 5). In agreement with the immunohistochemical data, the fraction of B cells in transgenic spleen was reduced to 65% of that in wild-type controls at 3 weeks (Figure 5a) and 4 weeks (not shown) of age. The B cells expressing very low levels of CD21, high levels of mIgM, and no IgD are recent immigrants from the bone marrow and are designated type I transitional B cells (23). In transgenics, this fraction is modestly decreased to 31% of the total B cell population in the spleen, compared with 38% in the wild-type (Figure 5b). The fraction of B cells that expresses high levels of both IgM and CD21 and is positive for IgD (type II transitional B cells; ref. 23), and the fraction of mature, resting B cells, which express low levels of IgM, high levels of IgD, and intermediate levels of CD21, was similar in F/A-2+/+ and wild-type spleen (Figure 5, b and c). Figure 5d further shows that the fraction of IgM+ and CD23+ cells, denoting follicular B cells, was not different in the spleen of F/A-2+/+ mice from that in wild-type mice at 3 weeks of age. At 4 weeks, this maturation profile was similar (not shown). Together, these results suggest a reduced output of B cells from the marrow of F/A-2+/+ mice, which in turn results in a slow fill of peripheral lymphoid organs, in particular the spleen. However, the B cells that do arrive in the spleen undergo a normal maturation program.
Figure 5.
Flow cytometric analysis of splenic B cells of 3-week-old wild-type and F/A-2+/+ mice. Spleen cells were incubated with combinations of antibodies to IgM, IgD, CD45R (B220), CD21, and CD23. The relative size of the indicated subpopulations is shown as a fraction of the total number of cells (a) or as a fraction of IgM-positive, B220-positive cells (b–d). The small squares schematically show the analyzed subpopulations. M, mature; T1, transitional type I; T2, transitional type II; Fol, follicular B cells.
Decreased serum IgM production in F/A-2+/+ transgenic mice.
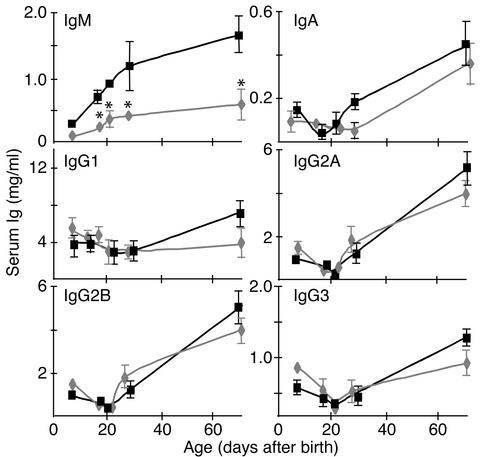
The reduced number of B cells in the spleen and gut of F/A-2+/+ mice could affect Ig production. Figure 6 shows serum Ig levels in wild-type and transgenic mice from birth through adulthood. Before weaning, IgG isotypes, but not IgM, are actively taken up by the intestinal epithelium from the mother’s milk (24). Since serum IgG concentrations in suckling transgenic mice were not different from those in controls, the intestinal uptake mechanism was not affected in the transgenics. In contrast, the IgM level was significantly lower (P < 0.01) in suckling transgenic mice, whereas IgA was not yet detectable. After weaning, IgG2a and IgG2b levels increased toward a similar adult level in both wild-type and F/A-2+/+ mice. The concentration of IgM also increased, but remained significantly lower in transgenics than in wild-type mice (P < 0.05). The levels of IgA and IgG1 tended to increase at a slower pace in transgenic mice, but the differences were not significant.
Figure 6.
Serum Ig levels in wild-type and F/A-2+/+ mice. Serum Ig levels in wild-type (squares) and F/A-2+/+ (diamonds) mice increase with a similar time course after weaning, but IgM levels remain depressed to 30% of that of control in F/A-2+/+ serum (P < 0.01). Furthermore, IgG1 levels do not increase after weaning in the F/A transgenics. For each measurement, serum of three mice was pooled. Values are mean ± SEM and are based on triplicates in two independent analyses.
B cell development in F/A+/+ mice is hampered at the pro– to pre–B cell transition.
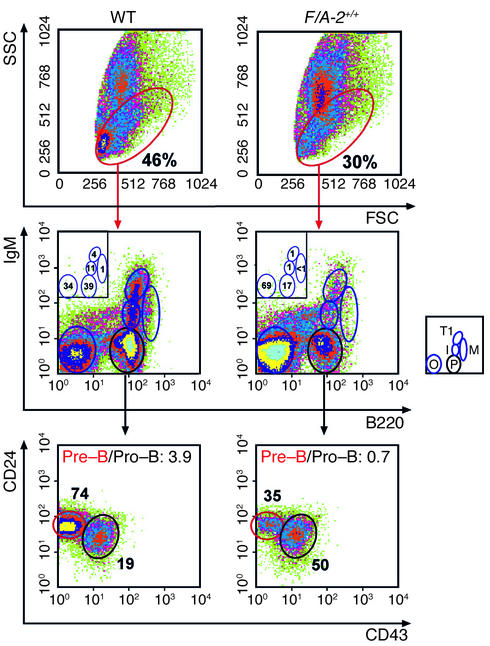
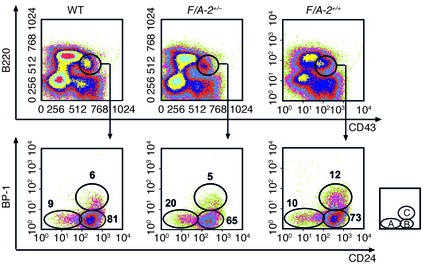
The hypothesis that the output of B cells from the marrow was reduced in F/A-2+/+ mice prompted us to examine early B cell development in more detail. The total number of cells recovered from bone marrow was reduced in 3-week-old transgenic mice (Table 2), reflecting the reduced size of their bones. Relative to controls, the fraction of lymphoid cells in bone marrow of 3- and 4-week-old F/A-2+/+ mice was reduced by one-third (Figure 7, top panels). The differentiation profile of the B lymphocyte fraction was analyzed using established markers to distinguish the pro–B cell, pre–B cell, and immature B cell stages (25). Cells of the B lineage were identified with antibodies to B220. B220-positive, mIgM-negative cells were further characterized by assessing expression of the CD43 and CD24 membrane proteins (Figure 7, middle and lower panels). Figure 7, middle panels, clearly shows that the pool of pre– and pro–B cells was reduced more than 50% in 3-week-old F/A-2+/+ mice compared with controls. This reduction was mainly due to a severe reduction in the fraction of pre–B cells (Figure 7, lower panels): the ratio of pre– to pro–B cells had decreased from 3.9 in age-matched wild-type littermates to 0.7 in F/A-2+/+ animals. At 4 weeks of age, these same ratios were 2.5 and 0.8, respectively (not shown). Figure 7 also shows that the prevalence of pre-B cells (mIgM-negative, B220-positive), and that of immature B cells (low levels of mIgM), type I transitional B cells (high levels of mIgM), and mature, recirculating B cells (lower levels of mIgM, mIgD-positive and high levels of B220) declined in a coordinate fashion, indicating that maturation beyond the pro-to-pre–B cell transition was not affected or was much less affected in the transgenic animals. To further delineate the location of the developmental block, the CD43+, B220+ B cell population was analyzed for expression of the ectopeptidase BP-1 and the heat-stable antigen CD24. Figure 8 shows that the BP-1+, CD24+ fraction, representing cells at the transition from the pro– to pre–B cell stage, was twice as large in 3-week-old F/A-2+/+ mice as in wild-type and hemizygous controls (Figure 8), suggesting that B cell maturation in arginine-deficient pups is hampered in the early pre–B cell stage.
Figure 7.
Flow cytometric analysis of bone marrow B-lineage cells of 3-week-old wild-type and F/A-2+/+ mice. B-lineage lymphocytes contained within the red ovals of the upper panels were analyzed for the expression of IgM and CD45R (B220) (middle panels), and the B220-positive, IgM-negative cells were analyzed for the expression of CD24 and CD43 (S7) (lower panels). The relative size of the indicated subpopulations is shown as a fraction of the total number of cells (upper panels), as a fraction of cells in the B-lineage cell window (middle panels), and as a fraction of the B220-positive, IgM-negative cells in the lower panels. The ratio of pre– to pro–B cells is also given in the lower panels. The small squares schematically show the analyzed subpopulations: M, mature B cells; T1, transitional type I B cells; I, immature B cells; P, pre– and pro–B cells; O, other cell types.
Figure 8.
Flow cytometric analysis of bone marrow B-lineage cells of 3-week-old wild-type, F/A-2+/– and F/A-2+/+ mice. B220-positive, CD43-positive lymphocytes contained within the black windows of the upper panels were analyzed for the expression of BP-1 and CD24 (lower panels). The relative size of the indicated subpopulations in the lower panels is shown as a fraction of cells in the B-lineage cell window that is shown in the upper panels. The small square schematically shows the analyzed subpopulations: A, pre-pro-B cells; B, early pro–B cells; C, late pro–B cells.
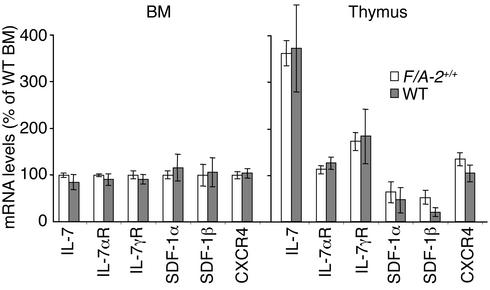
The stromal cells in the bone marrow provide an essential microenvironment for B cell maturation. The chemokine stromal cell–derived factor-1 (SDF-1) is an essential factor for pro–B cell development, while IL-7 is particularly important at the transition from pro– to pre–B cell (26, 27). As expected, mRNA levels for SDF-1α and SDF-1β and their receptor CXCR4 in 3-week-old F/A-2+/+ bone marrow did not differ from levels in age-matched wild-type controls (Figure 9). However, the mRNA levels of IL-7 and the corresponding receptor (IL-7R α chain and γc chain) were also not different between F/A-2+/+ and control mice. Similarly, we found no differences with respect to these parameters in the thymus of F/A-2+/+ mice and controls. To exclude that hampered B cell maturation was associated with and perhaps due to higher bone-marrow arginase levels in the transgenes, we tested ND 18 animals for the presence of arginase I in their bone marrow. Arginase was readily detectable by Western blot analysis in both wild-type and F/A-2+/+ bone marrow homogenates. In fact, arginase expression appeared to be higher in wild-type mice than in F/A-2+/+ mice (not shown). This finding rules out ectopic expression of the transgene as a cause for the observed phenotype.
Figure 9.
Messenger RNA transcript levels of IL-7, IL-7R α chain (IL-7αR), IL-7R γ chain (IL-7γR), SDF-1α, SDF-1β, and CXCR4 in 3-week-old wild-type and F/A-2+/+ bone marrow (BM) or thymus. Cyclophilin was used as an internal control. mRNA levels are expressed as a percentage of the levels measured in wild-type bone marrow in both panels. Values are mean ± SEM of six independent analyses for each genotype.
Peripheral B cells of F/A-2+/+ mice show normal proliferative responses.
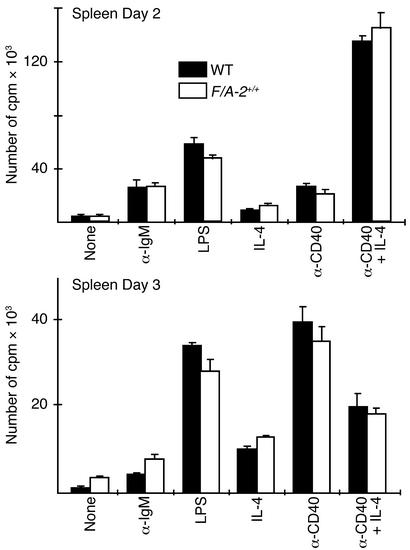
To assess the functional capability of B cells, lymphocytes isolated from the spleen of 3-week-old wild-type and F/A-2+/+ mice were stimulated with a goat F(ab′)2 anti-μ antibody or with the polyclonal B cell activator LPS. A comparable proliferative response was seen in cells from F/A-2+/+ mice and controls after either 2 days or 3 days of stimulation (Figure 10). Culture of B cells in the presence of anti-CD40 antibodies and IL-4 normally results in a strong proliferative response and isotype switching (28). Figure 10 shows that the response to these challenges was also similar in F/A-2+/+ and wild-type cells. Furthermore, culture medium supernatants contained similar concentrations of IgG1 and IgE antibodies (data not shown). These data demonstrate that transgenic B cells, once they have passed the developmental block in the early pre–B cell stage, are fully capable of mounting appropriate responses both to T cell–independent (LPS, anti-μ) and T cell–dependent (anti-CD40/IL-4) stimuli.
Figure 10.
In vitro stimulation of proliferation of splenic B cells from wild-type and F/A-2+/+ mice. Splenic lymphocytes (105 cells per well) of 4-week-old mice were stimulated with LPS, goat F(ab′)2 anti-mouse μ chain, anti-CD40 antibody, or IL-4, either alone or in combination for 2 days (upper graph) or 3 days (lower graph). Cells of wild-type and F/A-2+/+ spleens displayed similar proliferative responses. Data are presented as mean of triplicate cultures.
Discussion
At present, limited information is available on how nutrients influence the development of lymphoid organs or immune function. Arginine was surmised to be beneficial for immune system responses (29), but the reported effects are assorted, ranging from an increased production of polyamines (30) via effects on tumor growth (31, 32) and wound healing (9, 33), to a direct effect on T cell proliferation and gene expression (34–36). Here we show that an arginase-mediated selective arginine deficiency results in an impairment of pre–B cell maturation in the bone marrow. Hence, a reduced number of B cells leaves the bone marrow and enters the periphery, resulting in a pronounced reduction in the number of B cells in the spleen and lymph nodes, the virtual absence of visually identifiable PPs, and significantly reduced serum IgM levels. The size of the thymus is reduced in proportion to growth retardation (16), and development of T cells in the thymus appears normal; both of these observations indicate that arginine deficiency does not materially affect T cell development.
The impaired maturation of pre–B cells in F/A-2+/+ mice appears to be critically and specifically dependent on the concentration of circulating arginine. F/A-2+/– and F/A-1+/+ mice, which both suffer from a milder arginine deficiency than F/A-2+/+ mice (plasma arginine levels of F/A-2+/– and F/A-1+/+ mice are decreased to 45–50% of that in wild-type controls, compared with a decrease to 30–35% of wild type in F/A-2+/+ mice), do not suffer from the severe deficiency of peripheral B cells and impaired growth of peripheral lymphoid organs seen in F/A-2+/+ mice (16). Moreover, daily arginine injections reversed the lymphocyte phenotype of F/A-2+/+ mice, even though this treatment did not completely restore circulating arginine concentrations (16, 37). F/A-2+/+ mice suffer, in addition to hypoargininemia, only from hyperglycinemia, glycine and arginine both being substrates for creatine biosynthesis, which is strongly reduced in F/A-2+/+ mice (37). Furthermore, ornithine transcarbamoylase–deficient Spf-ash mice have normal B cell cellularity in their peripheral lymphoid organs, even though they suffer not only from an arginine deficiency that is comparable to that of F/A-1+/+ and F/A-2+/– animals, but also from hyperammonemia and reduced levels of nearly all other amino acids (38, 39). For these reasons, we believe that the F/A-2+/+ phenotype results from the selective arginine deficiency that develops upon effectively blocking intestinal arginine biosynthesis. The syndrome begins to mitigate after weaning, that is, when intestinal synthesis of arginine ceases (40) and body growth resumes (16).
How can we explain the phenotype? Strikingly, only precursor B lymphocytes appear to be affected. Later steps in development, i.e., immature, transitional, and mature B cells in the bone marrow and the spleen were all reduced in number, but were not disproportional. This suggests an unaltered capacity of pre–B cells to develop once they escape the early maturation block. In agreement with this, B cells isolated from peripheral lymphoid organs were able to mount a normal proliferative response upon B cell–specific stimulation. The observed lack of PP development can be a result of to B cell deficiency (41, 42). We found no gross defect in T cell maturation in the thymus or aberrant T cell populations in peripheral lymphoid organs. Moreover, T cell–deficient mice develop normal PPs (43, 44). It therefore does not seem far-fetched to assume that the effect of arginine deficiency on B cell development is restricted to the bone marrow compartment and that defective proliferation of precursor B lymphocytes forms the basis of the phenotype.
B cells develop in the marrow from hemopoietic precursor cells and can be divided into several differentiation stages that are characterized by surface phenotype (25, 45). Using the staining protocols of Hardy et al. (25), we found that the number of pro–B cells and late pro–B cells was strongly increased relative to the number of pre–B cells in suckling F/A-2+/+ mice and that the population of pre–B cells was severely reduced, suggesting defective proliferation of early pre–B cells. What can be the reason for this developmental block? Early B cell progenitors require cell-to-cell contact and growth factors such as IL-7 and c-kit ligand for further development into pre–B cells (46). The transition from pro– to pre–B cell requires the formation of a premature B cell receptor (BCR) complex with the heavy chain and two surrogate light chains. The constitutive signal generated by this receptor, and an IL-7–dependent signal collaborate in the induction of a rapid expansion of the pre–B cell pool (47). Limited or no expansion of the pre–B cell pool is seen in mice lacking (a) components of the BCR complex (e.g., the cytoplasmic domain of the Ig-α chain or the Ig-β chain, which are signal transduction effectors of the BCR) or λ5 (a component of the surrogate light chain of the premature BCR); (b) components of the signal transduction pathway of the BCR (e.g., Syk, BLNK, Vav, and PI 3-kinase, which are all signaling intermediates of the BCR); (c) IL-7 or components of IL-7R (e.g. IL-7αR and IL-7γR) or Jak3, or (d) transcriptional activators of components of the BCR or IL-7/IL-7R system (e.g., E2A, Pax-5, EBF, Sox-4, Mel-18, or C/EBP-β) (for a recent review see ref. 48). However, mice with deletions of transcriptional activators often display a broader phenotype than that seen in our transgenic mice.
The finding that mRNA levels of IL-7 and its receptor chains were undisturbed in F/A-2+/+ primary lymphatic tissue suggests that the IL-7–dependent pathway is intact. In addition, IL-7 deficiency (49, 50) or deletions of components of IL-7R (47, 49, 51) cause a strong reduction in the cellularity of the thymus, with disturbances in the early precursor populations (50). Furthermore, a severe deficiency of thymic and peripheral γδ T cells is present (52). F/A-2+/+ mice, however, developed normal T cell populations in primary and peripheral lymphoid organs. Similarly, mRNA levels of SDF-1 and its receptor CXCR4, a signal transduction pathway that stimulates pro–B cell development, possibly in concert with the IL7/IL7R pathway (53), were undisturbed.
Because we assume that an arginine-dependent metabolic or signal-transduction mechanism is responsible for the hampered transition of pro– to pre–B cells, we do not expect a fully penetrant phenotype. Therefore, factors that are known to cause a complete block if fully inactive can be candidate targets as well. Since the few pre–B cells that escape the block develop normally, and since peripheral B cells can be readily induced to proliferate or differentiate by a variety of stimulants mimicking T cell–dependent and –independent activation, a B cell autologous defect (i.e., a defect in the signaling pathway originating from the premature and mature BCR) is unlikely. Even though the current study demonstrated an unambiguous effect of arginine deficiency on early B cell development, we have yet to define the molecular and cellular mechanism through which arginine modulates lymphocyte biology and exerts its beneficial effect on mucosal defense. However, it is known that murine lymphocytes have a very limited capacity to synthesize arginine and depend on exogenous arginine for proliferation and antibody production (35, 54, 55). Most likely, therefore, a signal-transduction molecule derived from arginine (such as NO or agmatine) or a metabolic process that becomes disturbed by altered arginine levels (37) is involved. The present findings should allow us to identify the site of action of arginine and to assess the prospects of arginine to become a bona fide immunonutrient.
Acknowledgments
This work was supported by grant no. 902-23-028 from the Dutch Foundation for Scientific Research (W.J. de Jonge and K.L. Kwikkers).
Footnotes
See the related Commentary beginning on page 1411.
Conflict of interest: The authors have declared that no conflict of interest exists.
Nonstandard abbreviations used: nitric oxide (NO); arginase I (A-I); Peyer’s patch (PP); sparse-fur and abnormal skin and hair (Spf-ash); nitric oxide synthase (NOS); neonatal day (ND); intraepithelial lymphocyte (IEL); lamina-propria lymphocyte (LPL); phycoerythrin (PE); membrane-bound Ig (mIg); stromal cell–derived factor-1 (SDF-1); B cell receptor (BCR).
References
- 1.Featherston WR, Rogers QR, Freedland RA. Relative importance of kidney and liver in synthesis of arginine by the rat. Am J Physiol. 1973;224:127–129. doi: 10.1152/ajplegacy.1973.224.1.127. [DOI] [PubMed] [Google Scholar]
- 2.Morel F, Hus-Citharel A, Levillain O. Biochemical heterogeneity of arginine metabolism along kidney proximal tubules. Kidney Int. 1996;49:1608–1610. doi: 10.1038/ki.1996.233. [DOI] [PubMed] [Google Scholar]
- 3.Dhanakoti SN, Brosnan JT, Herzberg GR, Brosnan ME. Renal arginine synthesis: studies in vitro and in vivo. Am J Physiol. 1990;259:E437–E442. doi: 10.1152/ajpendo.1990.259.3.E437. [DOI] [PubMed] [Google Scholar]
- 4.Windmueller HG, Spaeth AE. Uptake and metabolism of plasma glutamine by the small intestine. J Biol Chem. 1974;249:5070–5079. [PubMed] [Google Scholar]
- 5.Visek WJ. Arginine needs, physiological state and usual diets. A reevaluation. J Nutr. 1986;116:36–46. doi: 10.1093/jn/116.1.36. [DOI] [PubMed] [Google Scholar]
- 6.Thornton FJ, Schaffer MR, Barbul A. Wound healing in sepsis and trauma. Shock. 1997;8:391–401. [PubMed] [Google Scholar]
- 7.de Lorgeril M. Dietary arginine and the prevention of cardiovascular diseases. Cardiovasc Res. 1998;37:560–563. doi: 10.1016/s0008-6363(97)00294-0. [DOI] [PubMed] [Google Scholar]
- 8.Bernstein LH. The impact of immunonutrition. Gastroenterology. 1996;110:1677–1678. doi: 10.1053/gast.1996.v110.agast961677. [DOI] [PubMed] [Google Scholar]
- 9.Barbul A, Rettura G, Levenson SM, Seifter E. Wound healing and thymotropic effects of arginine: a pituitary mechanism of action. Am J Clin Nutr. 1983;37:786–794. doi: 10.1093/ajcn/37.5.786. [DOI] [PubMed] [Google Scholar]
- 10.Alexander JW, Ogle CK, Nelson JL. Diets and infection: composition and consequences. World J Surg. 1998;22:209–212. doi: 10.1007/s002689900371. [DOI] [PubMed] [Google Scholar]
- 11.Davis TA, Fiorotto ML, Reeds PJ. Amino acid compositions of body and milk protein change during the suckling period in rats. J Nutr. 1993;123:947–956. doi: 10.1093/jn/123.5.947. [DOI] [PubMed] [Google Scholar]
- 12.Wu G. Synthesis of citrulline and arginine from proline in enterocytes of postnatal pigs. Am J Physiol. 1997;272:G1382–G1390. doi: 10.1152/ajpgi.1997.272.6.G1382. [DOI] [PubMed] [Google Scholar]
- 13.Herzfeld A, Raper SM. Enzymes of ornithine metabolism in adult and developing rat intestine. Biochim Biophys Acta. 1976;428:600–610. doi: 10.1016/0304-4165(76)90188-4. [DOI] [PubMed] [Google Scholar]
- 14.Zamora SA, et al. Plasma L-arginine concentrations in premature infants with necrotizing enterocolitis. J Pediatr. 1997;131:226–232. doi: 10.1016/s0022-3476(97)70158-6. [DOI] [PubMed] [Google Scholar]
- 15.Sweetser DA, Lowe JB, Gordon JI. The nucleotide sequence of the rat liver fatty acid-binding protein gene. Evidence that exon 1 encodes an oligopeptide domain shared by a family of proteins which bind hydrophobic ligands. J Biol Chem. 1986;261:5553–5561. [PubMed] [Google Scholar]
- 16.de Jonge WJ, et al. Overexpression of arginase I in enterocytes of transgenic mice elicits a selective arginine deficiency and affects skin, muscle, and lymphoid development. Am J Clin Nutr. 2002;76:128–140. doi: 10.1093/ajcn/76.1.128. [DOI] [PubMed] [Google Scholar]
- 17.ter Steege JC, Buurman WA, Forget PP. Spermine induces maturation of the immature intestinal immune system in neonatal mice. J Pediatr Gastroenterol Nutr. 1997;25:332–340. doi: 10.1097/00005176-199709000-00017. [DOI] [PubMed] [Google Scholar]
- 18.Mebius RE, van Tuijl S, Weissman IL, Randall TD. Transfer of primitive stem/progenitor bone marrow cells from LT alpha–/– donors to wild-type hosts: implications for the generation of architectural events in lymphoid B cell domains. J Immunol. 1998;161:3836–3843. [PubMed] [Google Scholar]
- 19.Berlin C, et al. Alpha 4 beta 7 integrin mediates lymphocyte binding to the mucosal vascular addressin MAdCAM-1. Cell. 1993;74:185. doi: 10.1016/0092-8674(93)90305-a. [DOI] [PubMed] [Google Scholar]
- 20.Huang PL, Dawson TM, Bredt DS, Snyder SH, Fishman MC. Targeted disruption of the neuronal nitric oxide synthase gene. Cell. 1993;75:1273–1286. doi: 10.1016/0092-8674(93)90615-w. [DOI] [PubMed] [Google Scholar]
- 21.Shesely EG, et al. Elevated blood pressures in mice lacking endothelial nitric oxide synthase. Proc Natl Acad Sci USA. 1996;93:13176–13181. doi: 10.1073/pnas.93.23.13176. [DOI] [PMC free article] [PubMed] [Google Scholar]
- 22.Laubach VE, Shesely EG, Smithies O, Sherman PA. Mice lacking inducible nitric oxide synthase are not resistant to lipopolysaccharide-induced death. Proc Natl Acad Sci USA. 1995;92:10688–10692. doi: 10.1073/pnas.92.23.10688. [DOI] [PMC free article] [PubMed] [Google Scholar]
- 23.Loder F, et al. B cell development in the spleen takes place in discrete steps and is determined by the quality of B cell receptor-derived signals. J Exp Med. 1999;190:75–89. doi: 10.1084/jem.190.1.75. [DOI] [PMC free article] [PubMed] [Google Scholar]
- 24.Simister N, Rees AR. Properties of immunoglobulin G-Fc receptors from neonatal rat intestinal brush borders. Ciba Found Symp. 1983;95:273–286. doi: 10.1002/9780470720769.ch16. [DOI] [PubMed] [Google Scholar]
- 25.Hardy RR, Carmack CE, Shinton SA, Kemp JD, Hayakawa K. Resolution and characterization of pro-B and pre-pro-B cell stages in normal mouse bone marrow. J Exp Med. 1991;173:1213–1225. doi: 10.1084/jem.173.5.1213. [DOI] [PMC free article] [PubMed] [Google Scholar]
- 26.Egawa T, et al. The earliest stages of B cell development require a chemokine stromal cell-derived factor/pre-B cell growth-stimulating factor. Immunity. 2001;15:323–334. doi: 10.1016/s1074-7613(01)00185-6. [DOI] [PubMed] [Google Scholar]
- 27.Carsetti R. The development of B cells in the bone marrow is controlled by the balance between cell-autonomous mechanisms and signals from the microenvironment. J Exp Med. 2000;191:5–8. doi: 10.1084/jem.191.1.5. [DOI] [PMC free article] [PubMed] [Google Scholar]
- 28.Banchereau J, et al. The CD40 antigen and its ligand. Annu Rev Immunol. 1994;12:881–922. doi: 10.1146/annurev.iy.12.040194.004313. [DOI] [PubMed] [Google Scholar]
- 29.Barbul A. Arginine and immune function. Nutrition. 1990;6:53–58. [PubMed] [Google Scholar]
- 30.Kay JE, Lindsay VJ. Polyamine synthesis during lymphocyte activation. Induction of ornithine decarboxylase and S-adenosyl methionine decarboxylase. Exp Cell Res. 1973;77:428–436. doi: 10.1016/0014-4827(73)90597-1. [DOI] [PubMed] [Google Scholar]
- 31.Braga M, Gianotti L, Vignali A, Di Carlo V. Immunonutrition in gastric cancer surgical patients. Nutrition. 1998;14:831–835. doi: 10.1016/s0899-9007(98)00103-8. [DOI] [PubMed] [Google Scholar]
- 32.Evoy D, Lieberman MD, Fahey TJ, III, Daly JM. Immunonutrition: the role of arginine. Nutrition. 1998;14:611–617. doi: 10.1016/s0899-9007(98)00005-7. [DOI] [PubMed] [Google Scholar]
- 33.Barbul A, Rettura G, Prior E, Levenson SM, Seifter E. Supplemental arginine, wound healing, and thymus: arginine-pituitary interaction. Surg Forum. 1978;29:93–95. [PubMed] [Google Scholar]
- 34.Kobayashi T, et al. Arginine enhances induction of T helper 1 and T helper 2 cytokine synthesis by Peyer’s patch alpha beta T cells and antigen-specific mucosal immune response. Biosci Biotechnol Biochem. 1998;62:2334–2340. doi: 10.1271/bbb.62.2334. [DOI] [PubMed] [Google Scholar]
- 35.Ochoa JB, et al. Effects of L-arginine on the proliferation of T lymphocyte subpopulations. JPEN J Parenter Enteral Nutr. 2001;25:23–29. doi: 10.1177/014860710102500123. [DOI] [PubMed] [Google Scholar]
- 36.Rodriguez PC, et al. Regulation of T cell receptor CD3zeta chain expression by L-arginine. J Biol Chem. 2002;277:21123–21129. doi: 10.1074/jbc.M110675200. [DOI] [PubMed] [Google Scholar]
- 37.de Jonge WJ, et al. Overexpression of arginase alters circulating and tissue amino acids and guanidino compounds and affects neuromotor behavior in mice. J Nutr. 2001;131:2732–2740. doi: 10.1093/jn/131.10.2732. [DOI] [PubMed] [Google Scholar]
- 38.Malo C. Free amino acid levels in serum and small intestine during the post-natal development of normal and sparse-fur mutant mice. Comp Biochem Physiol A Physiol. 1994;109:1049–1057. doi: 10.1016/0300-9629(94)90254-2. [DOI] [PubMed] [Google Scholar]
- 39.Qureshi IA, Rao KV. Sparse-fur (spf) mouse as a model of hyperammonemia: alterations in the neurotransmitter systems. Adv Exp Med Biol. 1997;420:143–158. doi: 10.1007/978-1-4615-5945-0_9. [DOI] [PubMed] [Google Scholar]
- 40.De Jonge WJ, Dingemanse MA, de Boer PA, Lamers WH, Moorman AF. Arginine-metabolizing enzymes in the developing rat small intestine. Pediatr Res. 1998;43:442–451. doi: 10.1203/00006450-199804000-00002. [DOI] [PubMed] [Google Scholar]
- 41.Golovkina TV, Shlomchik M, Hannum L, Chervonsky A. Organogenic role of B lymphocytes in mucosal immunity. Science. 1999;286:1965–1968. doi: 10.1126/science.286.5446.1965. [DOI] [PubMed] [Google Scholar]
- 42.Kitamura D, Roes J, Kuhn R, Rajewsky K. A B cell-deficient mouse by targeted disruption of the membrane exon of the immunoglobulin mu chain gene. Nature. 1991;350:423–426. doi: 10.1038/350423a0. [DOI] [PubMed] [Google Scholar]
- 43.Mombaerts P, et al. Mutations in T-cell antigen receptor genes alpha and beta block thymocyte development at different stages [erratum 1992, 360:491] Nature. 1992;360:225–231. doi: 10.1038/360225a0. [DOI] [PubMed] [Google Scholar]
- 44.Itohara S, et al. T cell receptor delta gene mutant mice: independent generation of alpha beta T cells and programmed rearrangements of gamma delta TCR genes. Cell. 1993;72:337–348. doi: 10.1016/0092-8674(93)90112-4. [DOI] [PubMed] [Google Scholar]
- 45.Tudor KS, Payne KJ, Yamashita Y, Kincade PW. Functional assessment of precursors from murine bone marrow suggests a sequence of early B lineage differentiation events. Immunity. 2000;12:335–345. doi: 10.1016/s1074-7613(00)80186-7. [DOI] [PubMed] [Google Scholar]
- 46.Loffert D, et al. Early B-cell development in the mouse: insights from mutations introduced by gene targeting. Immunol Rev. 1994;137:135–153. doi: 10.1111/j.1600-065x.1994.tb00662.x. [DOI] [PubMed] [Google Scholar]
- 47.Peschon JJ, et al. Early lymphocyte expansion is severely impaired in interleukin 7 receptor-deficient mice. J Exp Med. 1994;180:1955–1960. doi: 10.1084/jem.180.5.1955. [DOI] [PMC free article] [PubMed] [Google Scholar]
- 48.Hardy RR, Hayakawa K. B cell development pathways. Annu Rev Immunol. 2001;19:595–621. doi: 10.1146/annurev.immunol.19.1.595. [DOI] [PubMed] [Google Scholar]
- 49.von Freeden-Jeffry U, et al. Lymphopenia in interleukin (IL)-7 gene-deleted mice identifies IL-7 as a nonredundant cytokine. J Exp Med. 1995;181:1519–1526. doi: 10.1084/jem.181.4.1519. [DOI] [PMC free article] [PubMed] [Google Scholar]
- 50.Maeurer MJ, Lotze MT. Interleukin-7 (IL-7) knockout mice. Implications for lymphopoiesis and organ-specific immunity. Int Rev Immunol. 1998;16:309–322. doi: 10.3109/08830189809042999. [DOI] [PubMed] [Google Scholar]
- 51.Thomis DC, Gurniak CB, Tivol E, Sharpe AH, Berg LJ. Defects in B lymphocyte maturation and T lymphocyte activation in mice lacking Jak3. Science. 1995;270:794–797. doi: 10.1126/science.270.5237.794. [DOI] [PubMed] [Google Scholar]
- 52.Moore TA, von Freeden-Jeffry U, Murray R, Zlotnik A. Inhibition of gamma delta T cell development and early thymocyte maturation in IL-7 –/– mice. J Immunol. 1996;157:2366–2373. [PubMed] [Google Scholar]
- 53.Baird AM, Gerstein RM, Berg LJ. The role of cytokine receptor signaling in lymphocyte development. Curr Opin Immunol. 1999;11:157–166. doi: 10.1016/s0952-7915(99)80027-2. [DOI] [PubMed] [Google Scholar]
- 54.Sugimura K, et al. Inherited hyperactivation of L-arginine synthesis in gamma + B lymphocytes of systemic autoimmune MRL mice. Int Immunol. 1990;2:1033–1038. doi: 10.1093/intimm/2.11.1033. [DOI] [PubMed] [Google Scholar]
- 55.Prete PE. Effects of L-canavanine on immune function in normal and autoimmune mice: disordered B-cell function by a dietary amino acid in the immunoregulation of autoimmune disease. Can J Physiol Pharmacol. 1985;63:843–854. doi: 10.1139/y85-139. [DOI] [PubMed] [Google Scholar]


