Abstract
AMP-activated protein kinase (AMPK) is viewed as a fuel sensor for glucose and lipid metabolism. To better understand the physiological role of AMPK, we generated a knockout mouse model in which the AMPKα2 catalytic subunit gene was inactivated. AMPKα2–/– mice presented high glucose levels in the fed period and during an oral glucose challenge associated with low insulin plasma levels. However, in isolated AMPKα2–/– pancreatic islets, glucose- and L-arginine–stimulated insulin secretion were not affected. AMPKα2–/– mice have reduced insulin-stimulated whole-body glucose utilization and muscle glycogen synthesis rates assessed in vivo by the hyperinsulinemic euglycemic clamp technique. Surprisingly, both parameters were not altered in mice expressing a dominant-negative mutant of AMPK in skeletal muscle. Furthermore, glucose transport was normal in incubated isolated AMPKα2–/– muscles. These data indicate that AMPKα2 in tissues other than skeletal muscles regulates insulin action. Concordantly, we found an increased daily urinary catecholamine excretion in AMPKα2–/– mice, suggesting altered function of the autonomic nervous system that could explain both the impaired insulin secretion and insulin sensitivity observed in vivo. Therefore, extramuscular AMPKα2 catalytic subunit is important for whole-body insulin action in vivo, probably through modulation of sympathetic nervous activity.
Introduction
The AMP-activated protein kinase (AMPK) has been proposed to act as a fuel sensor capable of mediating the cellular adaptation to nutritional and environmental variations (1). AMPK is a ubiquitous serine/threonine protein kinase activated in response to environmental or nutritional stress factors that deplete intracellular ATP levels. AMPK is a heterotrimeric enzyme consisting of an α catalytic subunit and noncatalytic regulatory β and γ subunits. Two isoforms have been identified for both the α subunit (α1 and α2) and β subunit (β1 and β2), and three isoforms have been reported for the γ subunit (γ1, γ2, and γ3). Regulation of AMPK activity is complex, involving allosteric activation by AMP and covalent modification by phosphorylation via an upstream AMPK kinase (2). Phosphorylation of threonine 172 in the α subunit of AMPK is essential for its activation (2).
Metabolic actions of AMPK have been extensively studied in skeletal muscle. Activation of AMPK by 5-aminoimidazole-4-carboxamide-1-β-D-ribofuranoside (AICAR) has been demonstrated to increase muscle glucose uptake in vivo and in vitro via an acute insulin-independent mechanism (3, 4) and to decrease the glycogen synthase activity ratio (5). Implication of AMPK in the physiology of tissues other than skeletal muscle has also been suggested by findings in liver (6–8), pancreas (9, 10), and adipose tissue (4, 7, 11, 12). Lastly, AMPK is also expressed in the CNS (13), but the role of AMPK in this tissue remains to be determined.
In skeletal muscle, the actions of AMPK are thought to be mediated mainly through the AMPKα2 isoform (5, 14, 15). In other tissues, the physiological role of this isoform in vivo is less clear. To get more insights into this issue, we knocked out the AMPKα2 gene. In the present study, we show that AMPKα2–/– mice exhibit glucose intolerance that is associated with low plasma insulin levels and reduced muscle glycogen synthesis during hyperinsulinemic clamp conditions. Reduction of insulin sensitivity was not dependent on muscle AMPK activity, since mice expressing a dominant-negative mutant of AMPK in skeletal muscle are not insulin resistant. Finally, AMPKα2–/– mice have increased catecholamine urinary excretion, suggesting increased sympathetic tone. Consequently, our data suggest that the α2 catalytic subunit of AMPK plays a major role in vivo as a fuel metabolic sensor by modulating the activity of the autonomous nervous system.
Methods
Gene targeting and generation of AMPKα2 gene knockout mice.
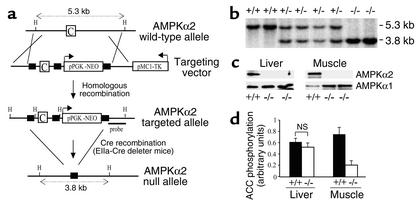
AMPKα2 genomic clones were isolated after screening a mouse 129 strain genomic library (Stratagene, Loyola, California, USA). The targeting construct was generated by flanking exon C, which encodes the AMPKα2 catalytic domain (corresponding to amino acids 189–260), with loxP sites for the Cre recombinase and inserting a PGK promoter–driven neomycin selection cassette flanked by an additional loxP site. The targeting construct was linearized and electroporated into 129/Sv MPI-I embryonic stem cells. Targeted clones were identified by Southern blot analysis of HindIII-digested DNA using a flanking 5′ DNA fragment as a hybridization probe and PCR analysis. Cells expanded from targeted clones were injected into C57BL6 blastocysts, and germline-transmitting chimeric animals were mated with C57BL/6 mice. The resulting heterozygous offspring were bred with “deleter” EIIa-Cre transgenic mice, in which Cre is expressed in the germ cells, to produce AMPKα2+/– mice (16). These mice were crossed to generate control and mutant mice. Southern blot analysis of HindIII-digested DNA with an internal probe (Figure 1a) and PCR analysis were used to genotype mice.
Figure 1.
Generation of mice lacking AMPKα2. (a) Schematic representation (not to scale) of genomic structure of AMPKα2 wild-type allele, AMPKα2 gene-targeting construct, AMPKα2 targeted allele, and AMPKα2 null allele. Squares indicate loxP sites and H’s indicate HindIII restriction sites. C corresponds to the exon encoding the AMPKα2 catalytic domain (amino acids 189–260) (b) Southern blot analysis after HindIII digestion of tail DNA from offspring derived from heterozygous intercrosses. Expected fragment sizes of the AMPKα2 wild-type (+/+; 5.3 kb) and null (–/–; 3.8 kb) alleles after HindIII digestion and hybridization with the indicated probe (solid bar in a) are shown. (c) Western blot analysis of AMPKα1 and AMPKα2 proteins in liver and gastrocnemius muscle from control (+/+) and AMPKα2–/– mice. (d) Phosphorylation level of ACC in liver and gastrocnemius muscle from control and AMPKα2–/– mice.
Animals.
Control, AMPKα2–/–, and kinase-dead AMPKα2 transgenic (Tg-KD-AMPKα2) male mice were studied at 12 weeks of age. The establishment and characterization of Tg-KD-AMPKα2 mice were previously reported (17). Animals were housed under controlled temperature (21°C) and lighting, with 12 hours of light (7:00 am to 7:00 pm) and 12 hours of dark (7:00 pm to 7:00 am), and had free access to water and a standard mouse chow diet. All procedures were performed in accordance with the principles and guidelines established by the European Convention for the Protection of Laboratory Animals.
Body weight, food intake, and body composition.
Mice were weighed weekly after 3 weeks of age. Food intake was measured daily for a period of 3 days using metabolic cages (Marty Technologie, Paris, France) that allow free access to tap water and food. Body composition analysis was performed on anesthetized living mice by a dual-energy x-ray absorptiometry method using a small animal densitometer (PIXImus Lunar; GE Medical Systems, Madison, Wisconsin, USA). Careful dissection and weighing of individual organs was also performed. Tissue triglycerides were extracted with acetone, and triglyceride content was measured with a commercial kit (Sigma-Aldrich, St. Louis, Missouri, USA).
Blood and urinary parameters.
Blood was withdrawn from the tail using EDTA-aprotinin as the anticoagulant. In the fed state, blood was collected at 9:00 pm. For fasting experiments, food was removed at 5:00 pm, and the mice were kept in a clean new cage for 5 hours before blood collection. During the oral glucose tolerance test (OGTT) and AICAR tolerance test, blood glucose levels were assessed using a glucometer (Glucotrend II; Roche Diagnostics, Meylan, France). Serum insulin concentrations were assessed using a rat insulin ELISA kit with a mouse insulin standard (Crystal Chem Inc., Chicago, Illinois, USA). Serum leptin concentrations were assessed with a mouse leptin ELISA kit (Crystal Chem Inc.). Serum concentrations of potassium, sodium, triglycerides, FFAs, glycerol, total and HDL cholesterol, creatinine, and urea were determined using an automated Monarch device (Instrumentation Laboratory Co., Lexington, Massachusetts, USA). For determination of urinary levels of catecholamines, animals were housed in individual metabolic cages, and daily urinary catecholamine excretion during 3 consecutive days was determined by reverse-phase HPLC (performed at Cochin Hospital, Paris, France).
Glucose and AICAR tolerance tests.
During OGTT and AICAR tolerance testing, blood was collected from the tail vein at 0, 20, 40, 60, 80, 100, and 120 minutes for determination of glucose levels. OGTTs were performed in the morning after an overnight fast by oral administration of 3 g glucose per kg body weight. Blood was also collected at time 20 minutes in chilled heparinized tubes for determination of plasma insulin levels. To study the effect of α-adrenergic antagonist on glucose tolerance, mice were injected intraperitoneally with 10 mg/kg phentolamine 30 minutes before glucose challenge. To study the effect of β-adrenergic antagonist on glucose tolerance, mice were injected intraperitoneally with 10 mg/kg propranolol 30 minutes before glucose challenge. AICAR tolerance tests were performed in the morning by intraperitoneal injection of 0.25 g AICAR per kg body weight into overnight-fasted mice (17).
Hyperinsulinemic euglycemic clamp procedures.
To determine the rate of glucose utilization, an indwelling catheter was inserted into the femoral vein under anesthesia, sealed under the back skin, and glued on top of the skull (18). The mice were then housed individually. After 2 days, they showed normal feeding behavior and motor activity. The mice were allowed to recover for 4–6 days. On the day of the experiment, the mice were fasted for 6 hours. The whole-body glucose utilization rate was determined under basal and hyperinsulinemic euglycemic conditions. In the basal state, HPLC-purified D-(3–3H)-glucose (NEN Life Science Products Inc., Boston, Massachusetts, USA) was continuously infused through the femoral vein at a rate of 10 μCi/kg.min for 3 hours. In the hyperinsulinemic condition, insulin was infused at a rate of 6 mU/kg.min for 3 hours; D-(3–3H)-glucose was infused at rate of 30 μCi/kg.min — a higher rate than for the basal condition, to ensure a detectable plasma D-(3–3H)-glucose enrichment. Throughout the infusion, blood glucose was assessed from blood samples and euglycemia was maintained by periodically adjusting a variable infusion of 16.5% (wt/vol) glucose. Plasma glucose concentrations, D-(3–3H)-glucose specific activity, and 3H2O and D-(3–3H)-glucose enrichments were determined as previously described (18). Glucose turnover and whole-body glycolysis rate were calculated as described (18). Whole-body glycogen synthesis was calculated by subtracting the whole-body glycolytic rate from the glucose turnover rate. The mean was calculated for each timepoint for this period. The mean value of mice from the same group was reported. Mice showing variations in specific activity larger than 15% were excluded from the study.
Determination of total glycogen content and glycogen synthesis rate in skeletal muscle and liver.
At completion of the infusion, the hind limb and the main lobe of the liver were removed and ground into liquid nitrogen for determination of total glycogen content and glycogen synthesis rate. Total glycogen was extracted from 20 mg of liver or 100 mg of muscle by digesting tissue samples in KOH. An aliquot was neutralized with HCl and the glycogen content was assessed using amyloglucosidase (19). Muscle glycogen synthesis rate was determined by extracting glycogen with perchloric acid (6% wt/vol) and precipitating glycogen with ethanol as described previously (20). The radioactive glycogen was counted and divided by the D-(3–3H)-glucose specific activity to determine the rate of synthesis.
Deoxyglucose uptake in isolated muscles.
Mice were anesthetized with pentobarbital and soleus and extensor digitorum longus muscles were exposed. Ligatures were placed around the tendon at each end of the muscle. Muscles were suspended at resting tension (4–5 m Newtons) and incubated at 30°C for 10 minutes at basal conditions in incubation chambers (Multi myograph system organ bath 700MO; Danish Myo Technology A/S, Aarhus, Denmark) oxygenated with 95% O2 and 5% CO2 gas. Basal medium consisted of 0.01% BSA, 8 mM mannitol, and 2 mM pyruvate in Krebs-Henseleit buffer (118.5 mM NaCl, 24.7 mM NaHCO3, 4.74 mM KCl, 1.18 mM MgSO3, 1.18 KH2PO4, and 2.5 CaCl2, pH 7.4). After basal incubation the medium was aspirated and exchanged with medium containing 600 μU insulin/ml (100 IU/ml Actrapid; Novo Nordisk A/S, Bagsvær, Denmark) for 30 minutes. 2-deoxy-D-glucose uptake measurements were initiated by incubation in a medium containing 600 μU insulin/ml, 1 mM 2-[2,6-3H]deoxy-D-glucose with a specific activity in the medium of 0.128 mCi/ml, and 8 mM [1-14C]mannitol with a specific activity in the medium of 0.083 mCi/ml (Amersham Biosciences Europe, Freiburg, Germany). Uptake was measured for 10 minutes before the muscle was washed in ice-cold Krebs-Henseleit buffer and quickly frozen with aluminum tongs precooled in liquid nitrogen. Frozen muscles were digested in 250 μl 1 M NaOH at 80°C for 10 minutes. The solution was neutralized with 250 μl 1 M NaCl and spun at 13,000 g for 2 minutes. Radioactivity in the supernatant was measured using liquid scintillation (Tri-Carb 2000; Packard Instruments, Greve, Denmark).
Insulin release from isolated islets of Langerhans.
The insulin-secretory response of AMPKα2–/– β cells was studied in collagenase-isolated islets of Langerhans. After isolation, islets were cultured for 16 hours in Ham’s F10 medium containing 10 mM glucose. Insulin release was measured by perifusion experiments in a multiple microchamber module (Endotronics Inc., Coon Rapids, Minnesota, USA) as previously described (21). Approximately 200 islets were loaded onto Biogel P2 (Biorads Labs, Richmond, California, USA) in a column and preperifused for 20 minutes in Ham’s F10 medium supplemented with 0.5% (wt/vol) BSA, 2 mM glutamine, 2 mM CaCl2, and 3 mM glucose, equilibrated with 95% O2 and 5% CO2. At a flow rate of 0.5 ml/min, 15-minute pulses of 3 mM glucose were alternated with 10-minute pulses of 7.5 mM glucose, 10 mM glucose, 20 mM glucose, and 10 mM glucose with 20 mM L-arginine (Sigma-Aldrich). Samples were collected every minute and assayed for immunoreactive insulin with guinea pig anti-insulin serum (Linco Research Inc., St. Charles, Missouri, USA). Results were expressed as percentages of the insulin content measured in each individual batch of islets after finishing the experiment by sonicating the Biogel P2 containing the islets in 5 ml of 2 mM acetic acid and 0.25% (wt/vol) BSA.
Western blot analysis.
Liver AMPK was obtained by polyethylene glycol precipitation (2), and muscle AMPK was prepared as previously described (5). AMPK catalytic subunits were detected using specific anti-AMPKα1 and anti-AMPKα2 antibodies (kindly provided by G. Hardie, Dundee University, Dundee, Scotland, United Kingdom). The phosphorylation status of acetyl-CoA carboxylase (ACC) was visualized using an anti–phospho-ACC (serine 79) antibody (Upstate Biotechnology Inc., Lake Placid, New York, USA).
Statistical analysis.
Data are expressed as mean ± SEM. Statistical analyses were carried out using an unpaired, two-tailed Student t test, and the null hypothesis was rejected at 0.05.
Results
Animal model: AMPKα2–/– mice.
AMPKα2 gene knockout was obtained using a targeting vector inserting loxP sites flanking the sequence containing the enzymatic catalytic site (Figure 1a). Deletion of the targeted allele was carried out by mating to EIIa-Cre transgenic mice to cause germline excision (16). Mice harboring the deleted allele were identified by Southern blot analysis (Figure 1b). Using RT-PCR analysis, no amplification of the region corresponding to the catalytic domain of AMPKα2 was observed in the liver, skeletal muscle, or pancreas of AMPKα2–/– mice (data not shown). Western blot analysis of protein extracts prepared from AMPKα2–/– liver and skeletal muscle showed undetectable AMPKα2 protein (Figure 1c). The AMPKα1 protein level was similar in the liver of AMPKα2–/– and control mice (Figure 1c). In contrast, in AMPKα2–/– mice, AMPKα1 protein was increased 1.8-fold in gastrocnemius muscle (Figure 1c). Phosphorylation of ACC was decreased in gastrocnemius muscle 3.5-fold, while it was unchanged in the liver compared with controls (Figure 1d).
Physical appearance, body weight, body composition, and triglyceride content in tissues of AMPKα2–/– mice.
AMPKα2–/– mice from heterozygous mating were born with the expected mendelian ratio. AMPKα2–/– mice are fertile, appear indistinguishable from their wild-type littermates, and have a normal life span. No significant difference in body weight or food intake was observed between the two groups (Table 1). Body composition was similar for both groups as assessed both by biphotonic absorptiometry (Table 1) and careful dissection and weighing of individual organs (data not shown). Triglyceride content in liver, gastrocnemius muscle, and pancreas was similar in AMPKα2–/– mice and controls (Table 1).
Table 1.
Body composition, food intake, and triglyceride content of liver, gastrocnemius muscle, and pancreas of AMPKα2–/– mice
Metabolic parameters.
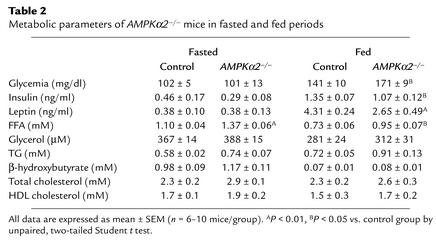
In fasted conditions, plasma glucose and insulin levels were similar in AMPKα2–/– mice and controls, while plasma FFA concentrations were increased in AMPKα2–/– mice (Table 2). Glycerol plasma levels have a tendency to be higher in AMPKα2–/– mice but do not reach statistical significance (Table 2). In the fed state, AMPKα2–/– mice were characterized by higher plasma glucose and plasma FFA concentrations than were found in control mice, while plasma insulin and leptin levels were lower (Table 2). No difference between plasma levels of total and HDL cholesterol, sodium, potassium, creatinine, or urea were noted between AMPKα2–/– and control mice (Table 2 and data not shown).
Table 2.
Metabolic parameters of AMPKα2–/– mice in fasted and fed periods
AMPKα2–/– mice are AICAR-resistant, glucose intolerant, and have reduced glucose-stimulated insulin secretion.
To investigate in vivo to what extent remaining AMPKα1 protein levels can substitute for AMPKα2, we performed an AICAR tolerance test. The relative insensitivity to hypoglycemia-mediated AICAR effects observed in AMPKα2–/– mice (Figure 2a) suggests that AMPKα1 cannot fully compensate for the lack of AMPKα2 in AMPKα2–/– mice. To investigate the dynamic response of AMPKα2–/– mice to increased glucose concentrations, an oral glucose challenge was performed. Following glucose absorption, AMPKα2–/– mice have a markedly increased blood glucose excursion, demonstrating glucose intolerance (Figure 2b). Insulinemia determined at time 20 minutes was significantly lower in AMPKα2–/– mice (Figure 2c).
Figure 2.
AMPKα2–/– mice are AICAR-resistant, glucose intolerant, and exhibit impaired glucose-stimulated insulin secretion. (a) AICAR tolerance test. (b) OGTT. (c) Plasma glucose and insulin levels at time 20 minutes during OGTT. All results are expressed as mean ± SEM (n = 6–10). *P < 0.05, **P < 0.001, ***P < 0.0001 vs. control group by unpaired, two-tailed Student t test. NS, not significant.
Glucose- and l-arginine–stimulated insulin secretion are normal in isolated pancreatic islets of AMPKα2–/– mice.
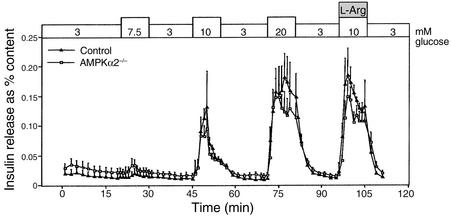
No significant difference in insulin release was observed between control and AMPKα2–/– pancreatic islets for basal (3 mM glucose) and stimulatory glucose concentrations (7.5 mM, 10 mM, and 20 mM glucose) or when challenged with 20 mM L-arginine (Figure 3). Furthermore, the insulin content of AMPKα2–/– and control islets was similar (67.2 ± 16.2 vs. 63.9 ± 16.5 ng/islet in controls; P not significant).
Figure 3.
Glucose- and L-arginine–stimulated (L-Arg) insulin secretion in isolated AMPKα2–/– islets. All results are expressed as mean ± SEM (n = 4). P not significant between groups by unpaired, two-tailed Student t test.
AMPKα2–/– mice are insulin resistant while Tg-KD-AMPKα2 mice are not.
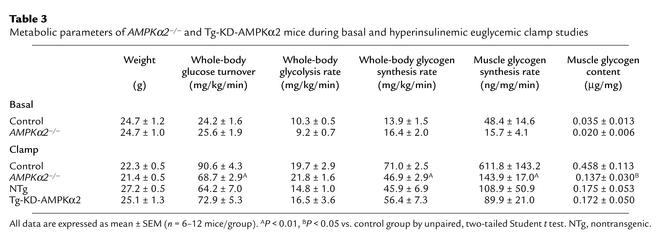
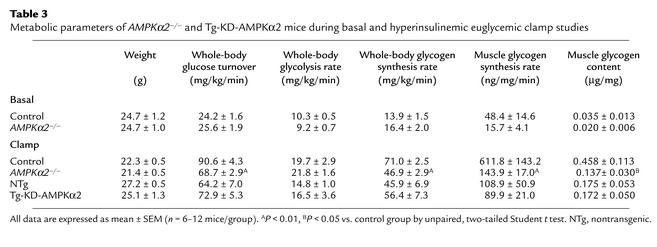
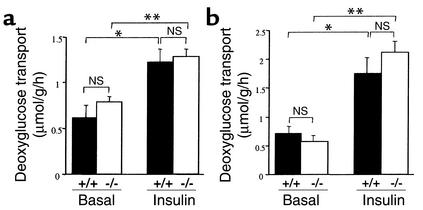
In the basal condition, endogenous glucose production, glycolysis rate, and whole-body glycogen synthesis rate were similar between AMPKα2–/– and control mice (Table 3). In vivo muscle glycogen synthesis rate and total glycogen content were similar in both groups (Table 3). During hyperinsulinemic euglycemic clamp, plasma glucose and insulinemia were comparable in AMPKα2–/– and control mice (plasma glucose: 109.8 ± 7.2 mg/dl in AMPKα2–/– mice vs. 97.2 ± 3.6 mg/dl in controls, P not significant; plasma insulin: 159.7 ± 22.6 mU/l in AMPKα2–/– mice vs. 146.9 ± 22.5 mU/l in controls, P not significant). Insulin-stimulated whole-body glucose turnover rate was decreased in AMPKα2–/– mice compared with controls (Table 3). Insulin-stimulated whole-body glycolysis was similar in both groups, while the insulin-stimulated whole-body glycogen synthesis rate was dramatically decreased in AMPKα2–/– mice (Table 3). Muscle glycogen synthesis rate and total muscle glycogen content were severely reduced in AMPKα2–/– mice compared with controls at the end of the clamp (Table 3). Because glucose uptake is largely rate limiting for glycogen synthesis in muscle during clamp study, we assayed uptake of deoxyglucose into isolated muscle in the presence of insulin. Basal and insulin-stimulated glucose uptake were similar in isolated extensor digitorum longus and soleus muscles from controls and AMPKα2–/– mice (Figure 4, a and b). In addition, total glycogen content in skeletal muscle of random-fed animals was similar between AMPKα2–/– and control mice (0.312 ± 0.106 vs. 0.358 ± 0.072 μg/mg in controls, respectively, P not significant). Lastly, endogenous hepatic glucose production was totally inhibited in both groups, suggesting no hepatic insulin resistance (data not shown). Furthermore, no defect was detected in glycogen synthesis or total glycogen content in the liver of AMPKα2–/– and control mice in either basal or clamp studies (data not shown).
Table 3.
Metabolic parameters of AMPKα2–/– and Tg-KD-AMPKα2 mice during basal and hyperinsulinemic euglycemic clamp studies
Figure 4.
Insulin-stimulated glucose transport in isolated muscles from AMPKα2–/– mice. Basal and insulin-stimulated glucose transport in (a) soleus and (b) extensor digitorum longus muscles from control and AMPKα2–/– mice. All results are expressed as mean ± SEM (n = 4–7). *P < 0.05, **P < 0.01 vs. basal conditions by unpaired, two-tailed Student t test; P not significant (NS) vs. control group.
To further investigate the role of muscle AMPK in the development of insulin resistance, we performed hyperinsulinemic euglycemic clamps in transgenic mice expressing a kinase-dead mutant of AMPK in skeletal muscle (Tg-KD-AMPKα2 mice) and their respective nontransgenic controls (17). Oral glucose tolerance was comparable between the two groups (data not shown). During the clamp, plasma glucose and insulinemia were comparable in Tg-KD-AMPKα2 and nontransgenic mice (plasma glucose: 93.6 ± 1.8 mg/dl in Tg-KD-AMPKα2 mice vs. 95.4 ± 9.0 mg/dl in nontransgenic controls, P not significant; plasma insulin: 113.7 ± 24.8 mU/l in Tg-KD-AMPKα2 mice vs. 145.7 ± 22.9 mU/l in nontransgenic controls, P not significant). Insulin-stimulated whole-body glucose turnover, whole-body glycogen synthesis rate, muscle glycogen synthesis rate, and total muscle glycogen content were similar in both groups (Table 3).
Increased daily urinary catecholamine excretion in AMPKα2–/– mice.
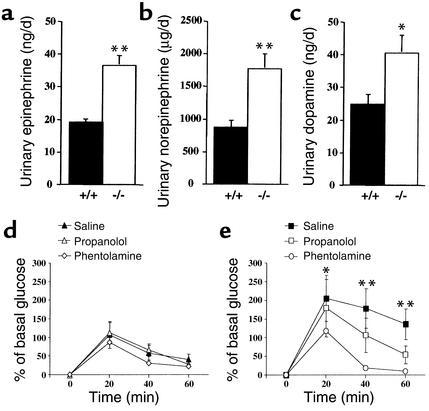
Daily epinephrine, norepinephrine, and dopamine excretion were significantly higher in AMPKα2–/– mice than in controls (Figure 5, a–c). The response to a glucose challenge was dramatically improved in AMPKα2–/– mice after treatment with α-adrenergic blockers, while no change was observed in control mice (Figure 5, d and e). In contrast, β-adrenergic blockers did not modify glucose tolerance of AMPKα2–/– mice (Figure 5, d and e).
Figure 5.
Increased daily urinary catecholamine excretion in AMPKα2–/– mice. Daily urinary (a) epinephrine, (b) norepinephrine, and (c) dopamine excretion in AMPKα2–/– mice. All results are expressed as mean ± SEM (n = 6). *P < 0.05, **P < 0.01 vs. control group by unpaired, two-tailed t test. Also shown are effect of phentolamine and propranolol, α- and β-adrenergic blockers, respectively, on the response of glucose challenge of control (d) and AMPKα2–/– (e) mice. All results are expressed as mean ± SEM (n = 5). *P < 0.05, **P < 0.01, saline- vs. phentolamine-treated group by unpaired, two-tailed Student t test; P not significant for saline- vs. propranolol-treated group.
Discussion
The primary goal of this study was to assess the role of the AMPKα2 isoform in controlling glucose metabolism in vivo. AMPKα2–/– mice appear indistinguishable from their control littermates. Importantly, there is no difference in body composition, adiposity, or food intake between mutant and control mice. The most striking observation is reduced glucose tolerance in AMPKα2–/– mice. We showed that this defect is linked with both reduced insulin release and decreased insulin sensitivity of peripheral tissues. Few data are available concerning regulation of insulin release by AMPK. Activation of AMPK has been shown to inhibit insulin secretion in vitro (9, 10). Here, we showed that while glucose-induced insulin secretion is clearly impaired in AMPKα2–/– mice in vivo, basal and glucose- and L-arginine–stimulated insulin secretion in isolated pancreatic islets are similar in AMPKα2–/– mice and controls. Furthermore, insulin content of islets and insulin gene transcription (data not shown) were not affected by AMPKα2 gene deletion. Taken together, these data indicate that the lack of insulin secretion observed in vivo in AMPKα2–/– mice is not due to a primary defect in β cell function. Hypokalemia or hyperleptinemia (22), known to modulate insulin secretion negatively in vivo, are not observed in AMPKα2–/– mice. In addition, lipid content in pancreas was similar in AMPKα2–/– mice and controls, excluding a deleterious effect on insulin release by chronic accumulation of lipids (23, 24). An important regulator of insulin secretion is the fine-tuning of the balance between sympathetic and parasympathetic activity. This is critical for the β cells, since epinephrine and norepinephrine directly and potently suppress β cell function (25). AMPKα2–/– mice exhibited higher catecholamine urinary excretion than did controls. Since catecholamines are known to inhibit insulin release, dysregulation in sympathetic tone observed in AMPKα2–/– mice could be implicated in the reduction of insulin secretion. More importantly, no defect in glucose and insulin plasma levels was observed in mutant mice in the fasted state, suggesting that dysregulation of sympathetic tone is predominant in the fed period.
Glucose intolerance is due to both impaired insulin secretion and reduced insulin-stimulated glucose utilization. Therefore, we examined insulin sensitivity in peripheral tissues of AMPKα2–/– mice using hyperinsulinemic euglycemic clamp studies. To our surprise, AMPKα2–/– mice displayed decreased whole-body insulin sensitivity, with a dramatic reduction in insulin-stimulated glycogen synthesis in skeletal muscle, while hepatic insulin sensitivity was preserved. Does α2 deletion in skeletal muscle directly alter insulin sensitivity? This does not seem to be the case since insulin sensitivity is unaltered in Tg-KD-AMPKα2 mice, which express a dominant-negative mutant of AMPK in skeletal muscle (17). This points out that lack of AMPK activity in skeletal muscle is unable by itself to alter insulin sensitivity or glycogen synthesis in this tissue. Likewise, comparable muscle glycogen contents of AMPKα2–/– and control mice during the random-fed period suggest that the balance between degradation and repletion of glycogen in muscle is intact in this model. In consequence, a defect in muscular glycogen synthesis was specifically observed in AMPKα2–/– mice when insulinemia reached supraphysiological levels. Glucose uptake is largely rate limiting for glycogen synthesis in muscle during clamp study. As insulin induced a similar increase in deoxyglucose uptake in incubated extensor digitorum longus and soleus muscles, it is unlikely that primary defective glucose transport in muscle contributes to AMPKα2–/– insulin resistance.
Another known important mechanism of insulin resistance in skeletal muscle is increased lipid availability or increased tissue uptake of FFA (26). AMPK regulates lipid oxidation in muscle by reducing ACC activity, which in turn decreases malonyl coenzyme A levels and increases mitochondrial uptake of FFAs. In AMPKα2–/– gastrocnemius muscle, we showed that α1 protein was increased by 1.8-fold (Figure 1c) but ACC phosphorylation was reduced by 3.5-fold (Figure 1d). These data suggest that in skeletal muscle, the increased α1 protein levels in AMPKα2–/– mice is not sufficient to ensure normal phosphorylation of ACC. However, the 24-hour respiratory quotient, monitored by indirect calorimetry, was similar in AMPKα2–/– and control mice (data not shown), suggesting that whole-body lipid oxidation is not altered by the lack of the AMPKα2 subunit. Furthermore, comparable skeletal muscle lipid content in both groups argues against any alteration of lipid oxidation rate in AMPKα2–/– mice. Finally, we know that adipose tissue operates as an endocrine organ that releases a large number of hormones in response to specific extracellular stimuli or changes in metabolic status. Alteration of secretion of these proteins (which include TNF-α, leptin, adipsin, resistin, and adiponectin) as a possible mechanism of AMPKα2–/– mouse insulin resistance needs further investigation.
So how can we explain insulin resistance in AMPKα2–/– mice? The observation that AMPKα2–/– mice exhibit altered glucose metabolism in vivo but not in isolated organs suggests that the defect is of central origin. It is known that integration of peripheral and central metabolic signals in the CNS during different metabolic situations such as fasting, fed state, and hyperinsulinemic clamp activates the autonomous nervous system, which in turn regulates glucose metabolism in peripheral tissues (27–30). As AMPKα2 is widely expressed in the brain (13), we hypothesized that lack of AMPKα2 in neurons could contribute to the metabolic defects observed in AMPKα2–/– mice. Supporting this hypothesis, AMPKα2–/– mice exhibited a significant increase in daily urinary catecholamine excretion, suggesting higher sympathetic activation in these mice. Furthermore, the glucose intolerance of AMPKα2–/– mice was dramatically improved after intraperitoneal injection of phentolamine (an α-adrenergic receptor antagonist), while no change was observed after treatment of AMPKα2–/– mice by propranolol (a β-adrenergic receptor antagonist). This suggested that the α-adrenergic but not the β-adrenergic pathway is involved in the glucose intolerance observed in AMPKα2–/– mice. It is well known that epinephrine overproduction inhibits insulin secretion, reduces insulin-stimulated glucose uptake in skeletal muscles, and alters muscle glycogen synthesis (31–35); all of these defects are present in AMPKα2–/– mice in vivo. Moreover, normality of some metabolic parameters (fasting glucose and insulin plasma levels or skeletal muscle glycogen content in random-fed animals) suggests that exaggerated sympathetic tone in AMPKα2–/– mice is not permanent but is restricted to particular nutritional situations such as glucose challenge and hyperinsulinemic euglycemic clamps.
The data presented here identify AMPKα2 as a major component in the control of insulin sensitivity and insulin secretion in vivo. We clearly demonstrated that the metabolic function of AMPKα2–/– isolated skeletal muscle and pancreatic islets is normal, suggesting that the origin of the defects observed in vivo is located outside these tissues. In addition, we showed significant increased catecholamine excretion in AMPKα2–/– mice. Thus, we hypothesize that lack of AMPKα2 in neurons reduces the ability to integrate peripheral metabolic signals into the brain and consequently alters the control of peripheral insulin sensitivity and insulin secretion by increasing sympathetic nervous activity.
Acknowledgments
We are grateful to A.K. Voss for the kind gift of embryonic stem cells. We thank D. Desmoulins (Cochin Hospital, Paris) for catecholamine measurement; M. Muffat-Joly and J. Bauchet (Centre d’Explorations Fonctionnelles Intégré, Faculté de Médecine Xavier Bichat, Paris) for metabolic cage studies and determination of blood parameters; and C. Silve (Bichat Hospital) and GE Medical Systems for access to dual-energy x-ray absorptiometry. We appreciate assistance from D. Beaumont, T. Busnel, C. Postic, and A. Wood. This work was supported by INSERM, CNRS, the French Ministry for Research, the Danish National Research Foundation (grant 504-12), and the European Commission (grant QLG1-CT-2001-01488). F. Andreelli and S.B. Jørgensen were supported by postdoctoral fellowships from the European Commission, J.F.P. Wojtaszewski was supported by a postdoctoral fellowship from the Danish Medical Research Council, and G. Nicolas was supported by a postdoctoral fellowship from Aventis Laboratories.
Footnotes
Benoit Viollet and Fabrizio Andreelli contributed equally to this work.
Conflict of interest: The authors have declared that no conflict of interest exists.
Nonstandard abbreviations used: AMP-activated protein kinase (AMPK); 5-aminoimidazole-4-carboxamide-1-β-d-ribofuranoside (AICAR); kinase-dead AMPKα2 transgenic (Tg-KD-AMPKα2); oral glucose tolerance test (OGTT); acetyl-CoA carboxylase (ACC).
References
- 1.Hardie DG, Hawley SA. AMP-activated protein kinase: the energy charge hypothesis revisited. Bioessays. 2001;23:1112–1119. doi: 10.1002/bies.10009. [DOI] [PubMed] [Google Scholar]
- 2.Hawley SA, et al. Characterization of the AMP-activated protein kinase kinase from rat liver and identification of threonine 172 as the major site at which it phosphorylates AMP-activated protein kinase. J. Biol. Chem. 1996;271:27879–27887. doi: 10.1074/jbc.271.44.27879. [DOI] [PubMed] [Google Scholar]
- 3.Hayashi T, Hirshman MF, Kurth EJ, Winder WW, Goodyear LJ. Evidence for 5′ AMP-activated protein kinase mediation of the effect of muscle contraction on glucose transport. Diabetes. 1998;47:1369–1373. doi: 10.2337/diab.47.8.1369. [DOI] [PubMed] [Google Scholar]
- 4.Bergeron R, et al. Effect of AMPK activation on muscle glucose metabolism in conscious rats. Am. J. Physiol. 1999;276:E938–E944. doi: 10.1152/ajpendo.1999.276.5.E938. [DOI] [PubMed] [Google Scholar]
- 5.Wojtaszewski JF, Jorgensen SB, Hellsten Y, Hardie DG, Richter EA. Glycogen-dependent effects of 5-aminoimidazole-4-carboxamide (AICA)-riboside on AMP-activated protein kinase and glycogen synthase activities in rat skeletal muscle. Diabetes. 2002;51:284–292. doi: 10.2337/diabetes.51.2.284. [DOI] [PubMed] [Google Scholar]
- 6.Vincent MF, Marangos PJ, Gruber HE, Van den Berghe G. Inhibition by AICA riboside of gluconeogenesis in isolated rat hepatocytes. Diabetes. 1991;40:1259–1266. doi: 10.2337/diab.40.10.1259. [DOI] [PubMed] [Google Scholar]
- 7.Bergeron R, et al. Effect of 5-aminoimidazole-4-carboxamide-1-beta-D-ribofuranoside infusion on in vivo glucose and lipid metabolism in lean and obese Zucker rats. Diabetes. 2001;50:1076–1082. doi: 10.2337/diabetes.50.5.1076. [DOI] [PubMed] [Google Scholar]
- 8.Zhou G, et al. Role of AMP-activated protein kinase in mechanism of metformin action. J. Clin. Invest. 2001;108:1167–1174. doi:10.1172/JCI200113505. doi: 10.1172/JCI13505. [DOI] [PMC free article] [PubMed] [Google Scholar]
- 9.Salt IP, Johnson G, Ashcroft SJ, Hardie DG. AMP-activated protein kinase is activated by low glucose in cell lines derived from pancreatic beta cells, and may regulate insulin release. Biochem. J. 1998;335:533–539. doi: 10.1042/bj3350533. [DOI] [PMC free article] [PubMed] [Google Scholar]
- 10.Kowluru A, Chen HQ, Modrick LM, Stefanelli C. Activation of acetyl-CoA carboxylase by a glutamate- and magnesium-sensitive protein phosphatase in the islet beta-cell. Diabetes. 2001;50:1580–1587. doi: 10.2337/diabetes.50.7.1580. [DOI] [PubMed] [Google Scholar]
- 11.Sullivan JE, et al. Inhibition of lipolysis and lipogenesis in isolated rat adipocytes with AICAR, a cell-permeable activator of AMP-activated protein kinase. FEBS Lett. 1994;353:33–36. doi: 10.1016/0014-5793(94)01006-4. [DOI] [PubMed] [Google Scholar]
- 12.Corton JM, Gillespie JG, Hawley SA, Hardie DG. 5-aminoimidazole-4-carboxamide ribonucleoside. A specific method for activating AMP-activated protein kinase in intact cells? Eur. J. Biochem. 1995;229:558–565. doi: 10.1111/j.1432-1033.1995.tb20498.x. [DOI] [PubMed] [Google Scholar]
- 13.Turnley AM, et al. Cellular distribution and developmental expression of AMP-activated protein kinase isoforms in mouse central nervous system. J. Neurochem. 1999;72:1707–1716. doi: 10.1046/j.1471-4159.1999.721707.x. [DOI] [PubMed] [Google Scholar]
- 14.Vavvas D, et al. Contraction-induced changes in acetyl-CoA carboxylase and 5′-AMP-activated kinase in skeletal muscle. J. Biol. Chem. 1997;272:13255–13261. doi: 10.1074/jbc.272.20.13255. [DOI] [PubMed] [Google Scholar]
- 15.Musi N, et al. AMP-activated protein kinase activity and glucose uptake in rat skeletal muscle. Am. J. Physiol. Endocrinol. Metab. 2001;280:E677–E684. doi: 10.1152/ajpendo.2001.280.5.E677. [DOI] [PubMed] [Google Scholar]
- 16.Holzenberger M, et al. Cre-mediated germline mosaicism: a method allowing rapid generation of several alleles of a target gene. Nucleic Acids Res. 2000;28:E92. doi: 10.1093/nar/28.21.e92. [DOI] [PMC free article] [PubMed] [Google Scholar]
- 17.Mu J, Brozinick JT, Jr, Valladares O, Bucan M, Birnbaum MJ. A role for AMP-activated protein kinase in contraction- and hypoxia-regulated glucose transport in skeletal muscle. Mol. Cell. 2001;7:1085–1094. doi: 10.1016/s1097-2765(01)00251-9. [DOI] [PubMed] [Google Scholar]
- 18.Burcelin R, Crivelli V, DaCosta A, Roy-Tirelli A, Thorens B. Heterogeneous metabolic adaptation of C57BL/6J mice to high-fat diet. Am. J. Physiol. 2002;282:E834–E842. doi: 10.1152/ajpendo.00332.2001. [DOI] [PubMed] [Google Scholar]
- 19.Burcelin R, et al. Excessive glucose production, rather than insulin resistance, accounts for hyperglycaemia in recent-onset streptozotocin-diabetic rats. Diabetologia. 1995;38:283–290. doi: 10.1007/BF00400632. [DOI] [PubMed] [Google Scholar]
- 20.Massillon D, et al. Quantitation of hepatic glucose fluxes and pathways of hepatic glycogen synthesis in conscious mice. Am. J. Physiol. 1995;269:E1037–E1043. doi: 10.1152/ajpendo.1995.269.6.E1037. [DOI] [PubMed] [Google Scholar]
- 21.Flamez D, et al. Mouse pancreatic beta-cells exhibit preserved glucose competence after disruption of the glucagon-like peptide-1 receptor gene. Diabetes. 1998;47:646–652. doi: 10.2337/diabetes.47.4.646. [DOI] [PubMed] [Google Scholar]
- 22.Koyama K, et al. Beta-cell function in normal rats made chronically hyperleptinemic by adenovirus-leptin gene therapy. Diabetes. 1997;46:1276–1280. doi: 10.2337/diab.46.8.1276. [DOI] [PubMed] [Google Scholar]
- 23.Zhou YP, Grill VE. Long-term exposure of rat pancreatic islets to fatty acids inhibits glucose-induced insulin secretion and biosynthesis through a glucose fatty acid cycle. J. Clin. Invest. 1994;93:870–876. doi: 10.1172/JCI117042. [DOI] [PMC free article] [PubMed] [Google Scholar]
- 24.Paolisso G, et al. Opposite effects of short- and long-term fatty acid infusion on insulin secretion in healthy subjects. Diabetologia. 1995;38:1295–1299. doi: 10.1007/BF00401761. [DOI] [PubMed] [Google Scholar]
- 25.Schuit FC, Pipeleers DG. Differences in adrenergic recognition by pancreatic A and B cells. Science. 1986;232:875–877. doi: 10.1126/science.2871625. [DOI] [PubMed] [Google Scholar]
- 26.McGarry JD. Banting lecture 2001: dysregulation of fatty acid metabolism in the etiology of type 2 diabetes. Diabetes. 2002;51:7–18. doi: 10.2337/diabetes.51.1.7. [DOI] [PubMed] [Google Scholar]
- 27.Kamohara S, Burcelin R, Halaas JL, Friedman JM, Charron MJ. Acute stimulation of glucose metabolism in mice by leptin treatment. Nature. 1997;389:374–377. doi: 10.1038/38717. [DOI] [PubMed] [Google Scholar]
- 28.Burcelin R, Dolci W, Thorens B. Portal glucose infusion in the mouse induces hypoglycemia. Evidence that the hepatoportal glucose sensor stimulates glucose utilization. Diabetes. 2000;49:1635–1642. doi: 10.2337/diabetes.49.10.1635. [DOI] [PubMed] [Google Scholar]
- 29.Obici S, et al. Central melanocortin receptors regulate insulin action. J. Clin. Invest. 2001;108:1079–1085. doi:10.1172/JCI200112954. doi: 10.1172/JCI12954. [DOI] [PMC free article] [PubMed] [Google Scholar]
- 30.Yoshimatsu H, Oomura Y, Katafuchi T, Niijima A, Sato A. Lesions of the ventromedial hypothalamic nucleus enhance sympatho-adrenal function. Brain Res. 1985;339:390–392. doi: 10.1016/0006-8993(85)90112-x. [DOI] [PubMed] [Google Scholar]
- 31.Exton JH. Mechanisms involved in alpha-adrenergic phenomena: role of calcium ions in actions of catecholamines in liver and other tissues. Am. J. Physiol. 1980;238:E3–E12. doi: 10.1152/ajpendo.1980.238.1.E3. [DOI] [PubMed] [Google Scholar]
- 32.Haynes WG, Morgan DA, Walsh SA, Mark AL, Sivitz WI. Receptor-mediated regional sympathetic nerve activation by leptin. J. Clin. Invest. 1997;100:270–278. doi: 10.1172/JCI119532. [DOI] [PMC free article] [PubMed] [Google Scholar]
- 33.Nonogaki K. New insights into sympathetic regulation of glucose and fat metabolism. Diabetologia. 2000;43:533–549. doi: 10.1007/s001250051341. [DOI] [PubMed] [Google Scholar]
- 34.Marfaing P, et al. Effects of counterregulatory hormones on insulin-induced glucose utilization by individual tissues in rats. Diabetes Metab. 1991;17:55–60. [PubMed] [Google Scholar]
- 35.Chiasson JL, Shikama H, Chu DT, Exton JH. Inhibitory effect of epinephrine on insulin-stimulated glucose uptake by rat skeletal muscle. J. Clin. Invest. 1981;68:706–713. doi: 10.1172/JCI110306. [DOI] [PMC free article] [PubMed] [Google Scholar]


