Abstract
Linkage mapping of quantitative trait loci requires analysis of a large number of animals. Although genetic markers isolated by representational difference analysis (RDA) and its modifications meet the needs, the number of these markers has been limited. In the present study, we established the arbitrarily primed (AP)–RDA method to isolate virtually an unlimited number of the high throughput genetic markers. A representation of the genome, an AP-amplicon, was prepared by AP-PCR with a single primer or with a combination of primers using genomic DNA of the ACI/N (ACI) or BUF/Nac (BUF) rat as a template. By subtracting the AP-amplicon of ACI from that of BUF, a total of 40 polymorphic and independent markers were isolated in seven series of AP-RDA using a single primer. Two series of AP-RDA with primer combination yielded seven additional independent markers. All of the markers gave clear positive/negative signals by hybridization of a filter where AP-amplicons from F2 rats of ACI and BUF were dot-blotted at a high density without any concentration or purification. All of the 47 independent markers were mapped to unique chromosomal positions by linkage analysis, even though some arbitrary primers had very similar sequences. The markers were also informative between other strains of rats. Simultaneous hybridization of multiple filters made it possible to genotype a large number of rats simultaneously for multiple genetic loci. The AP-RDA method promises isolation of a large number of high throughput genetic markers in any species and is expected to facilitate linkage mapping of subtle quantitative trait loci.
Keywords: arbitrarily primed–PCR, polymorphic markers, rat genome
Linkage mapping of quantitative traits, such as blood pressure, blood glucose level, and cancer susceptibility, is a growingly important issue. However, linkage analysis using human families is facing an increasing problem because less and less samples are available because of decreasing family sizes. In this sense, linkage analysis using laboratory animal models offers a great advantage for the mapping of genetic loci controlling a quantitative trait (quantitative trait loci) (1). We can use enough animals to obtain statistically significant results. However, genotyping of a large number of animals with microsatellite markers is labor-intensive and costly. It is necessary to perform PCR as many times as the product of the number of samples and the number of loci to be typed and to run gels at least as many times as the number of loci to be typed (2, 3).
From this point of view, we have been isolating genetic markers that are suitable for genotyping of a large number of animals by using a subtraction technique, representational difference analysis (RDA) (4, 5). In RDA, subtractive competitive hybridization is performed by using representations (“amplicons”) of the whole genome but not the whole genome itself. The amplicon is composed of various DNA fragments that were prepared by restriction digestion of the genomic DNA, ligation of a universal adapter to the total restriction fragments, and PCR using a primer based on the adapter sequence. The differential products obtained by the following subtractive competitive hybridization using two amplicons are derived from DNA fragments that were present in one amplicon but not in the other. Therefore, these differential products (RDA markers) give positive and negative signals on the two amplicons, meaning that the amplicons can be dot-blotted and genotypes can be determined by analyzing the presence or absence of hybridization signals. By increasing the density of dot blots, a greater number of animals can be genotyped by hybridizing a small piece of filter. One amplicon can be used for 10–30 RDA markers.
However, preparation and concentration of amplicons are still labor-intensive. Namely, we must purify DNA by phenolchloroform extraction after restriction digestion, and the PCR product must be concentrated by ethanol precipitation before being dot-blotted to a filter. This is why we developed CAAT-RDA (3), in which a primer based on the CAAT box sequence was used for PCR to prepare amplicons (CAAT-amplicons), and isolated 12 CAAT-RDA markers for the rat. Because the CAAT-amplicon was prepared by performing PCR directly with the genomic DNA, it was not necessary to purify DNA to prepare the amplicon. Because the DNA fragments present in the CAAT-amplicon were highly enriched, we did not need to concentrate the PCR solution before dot-blotting. We also applied interspersed repetitive sequence (IRS)–RDA, which originally was developed in the mouse (6), to the rat. We were able to isolate 48 rat IRS-RDA markers that were polymorphic between two rat laboratory strains, ACI/N (ACI) and BUF/Nac (BUF) (7), and all of these 48 markers shared the useful feature of CAAT-RDA markers. The major limitation of the CAAT-RDA and IRS-RDA method is that the number of markers that can be isolated is not sufficient (3, 6, 7). Because the genomic regions represented by CAAT-PCR and IRS-PCR are limited by the primer sequence, a limited number of polymorphic fragments exist in the represented genomic regions.
In this study, we used the arbitrarily primed (AP)–PCR method (8, 9) to prepare representations of the genome AP-amplicon. The advantage of the AP-amplicon is that various portions of the genome can be potentially represented by using different arbitrary primers and that, theoretically, an unlimited number of polymorphic markers can be isolated.
MATERIALS AND METHODS
DNA Samples.
ACI and BUF rats were purchased from Japan Clea (Tokyo); Donryu rats were from Charles River Japan (Yokohama, Japan); Brown Norwegian and Fischer 344 rats were from Charles River Italia (Calco, Italy); Lewis rats were from Harlan Olac (Bichester, U.K.); and Sprague–Dawley (SD) from Charles River Laboratories. F2 intercross rats were produced by sister-and-brother mating of (ACI × BUF)F1 rats (10). Genomic DNA was extracted from the liver of individual rats by the phenol and chloroform extraction method as described (11).
Preparation of AP-Amplicon.
Primers were purchased from Sawady Technology (Tokyo). Genomic DNA (100 ng) was used for amplification by PCR in a reaction mixture of 400 μl, consisting of 300 μM each dNTP, 67 mM Tris⋅Cl (pH 8.8), 4 mM MgCl2, 16 mM (NH4)2SO4, 10 mM 2-mercaptoethanol, 100 μg/ml of BSA, 1 μM primer, and 15 units of Taq polymerase (Amersham Pharmacia). PCR amplification was carried out in a Perkin–Elmer/Cetus thermal cycler under the following conditions: for initial denaturation, 3 min at 94°C followed by 35 cycles of denaturation for 1 min at 94°C, annealing for 1 min at 40°C, and extension for 2 min at 72°C. The PCR product (AP-amplicon) was purified by phenol extraction and ethanol precipitation for RDA analysis. For genotyping by dot-blot analysis, PCR was performed in a 40-μl reaction, and the solution was used without any further purification.
Competitive Hybridization and Selective Amplification.
Amplicons of both tester and driver were digested with BamHI endonuclease (New England Biolabs). Restricted terminals of the amplicon were removed by gel-filtration chromatography (cDNA spun column, Amersham Pharmacia). The solution after gel-filtration was quantified and used for the following procedures. Two series of primer sets described previously (4), J and NBam series, were used as adapters or primers for RDA in this study. To 1 μg of the tester amplicon, 500 pmol of J adapter was ligated with T4 DNA ligase. The tester DNA (200 ng) with the J adapter at both ends was mixed with 40 μg (200-fold in excess) of the driver DNA. After ethanol precipitation of the DNA mixture, the pellet was dissolved in 4 μl of 3× EE buffer (3 mM EDTA/3 mM N-[2-hydroxyethyl]piperazine-N′-[3-propanesulfonic acid], pH 8.0). The mixture was denatured at 96°C for 10 min and was reannealed at 67°C for 16–36 hours in the presence of 1M NaCl. One-tenth of the reannealed product was subjected to amplification by PCR with the JBam24 oligonucleotide as a primer for 10 cycles. DNA fragments that had been linearly amplified, existing as ssDNA, were digested with 100 units of Mung-Bean nuclease (New England Biolabs,), and 1/10 of the remaining dsDNA again was amplified by PCR for 20–30 cycles with JBam24 oligonucleotide.
The second cycle of competitive hybridization was performed by switching the adapter used in the first cycle of competitive hybridization to a new adapter (NBam). Tester DNA (40 ng) was mixed with 40 μg (1,000-fold in excess) of driver DNA. Denaturing, reannealing, and selective amplification of the self-annealed product were performed in the same manner as in the first cycle. The PCR products after first and second competitive hybridization (C1 and C2, respectively) were ligated into the BamHI site of pBluescript II KS(+) phagemid vector (Stratagene). After transformation of XL1Blue-competent cells, insert-positive phagemid clones were selected by PCR amplification of the inserts by using T3 and T7 primers and restriction digestion of the PCR product with BamHI.
Southern Blot Analysis and Dot-Blot Analysis.
For Southern blot analysis, designated amounts of DNA were run in 1.2% agarose gel (FMC). After denaturation in 0.4 M NaOH, the gel was blotted onto a nylon filter (HyBond-N, Amersham Pharmacia). For dot-blot analysis of the isolated clone and amplicon, 10 μl of PCR solution was mixed with an equal volume of denaturing solution (0.8 M NaOH/50 mM EDTA) and was arranged in a 96-well format. Approximately 1 μl aliquot of each solution was dot-blotted in two positions by using a Kriplanker device (J. Kreitler, Washington University, St. Louis).
Prehybridization and hybridization were performed as described (5). Approximately 10–50 ng of probe was labeled with [α-32P]dCTP by using a random labeling kit (MultiPrime, Amersham Pharmacia). After washing the filters four times in 2× standard saline citrate (SSC), the filters were exposed to Kodak XAR films for 10 min to 3 days at −80°C.
Linkage Mapping and Nomenclature.
A multipoint linkage analysis was performed with mapmaker/exp software (12). A total of 205 anchored loci, including microsatellite markers and RDA markers, were used for genotyping of the 105 F2 rats (5, 10).
RESULTS
Establishment of the AP-RDA Method.
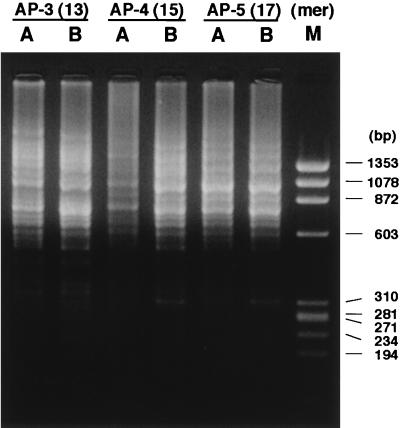
Sequences of the primers used are listed in Table 1. The primer AP-3 (13-mer) is an arbitrary primer containing a BamHI site that is necessary for the following RDA procedures. AP-4 (15-mer) and AP-5 (17-mer) were designed by adding randomly selected nucleotides to the 5′ of AP-3 sequentially. AP-PCRs with these primers were performed by using the genomic DNA of ACI and BUF rats as templates, and the gel-electrophoretic patterns of the AP-PCR products (the AP-amplicons) were visualized by ethidium bromide staining. All of the AP-amplicons prepared with the three different sizes of primers displayed patterns of multiple bands (Fig. 1).
Table 1.
Sequences of the primers used to prepare AP-amplicon
| Primer name | Length, mer | Sequence,* 5′ to 3′ |
|---|---|---|
| AP-3 | 13 | AGGATCCGTGAAC |
| AP-4 | 15 | ACAGGATCCGTGAAC |
| AP-5 | 17 | TGACAAGGATCCGTGAAC |
| AP-6 | 13 | AGGATCCAACGCC |
| AP-7 | 13 | CGGATCCTCAGTG |
| AP-8 | 13 | CGGATCCCTAAAG |
| AP-9 | 13 | AGGATCCGTGAGC |
| AP-10 | 13 | AGGATCCGCGAAC |
| AP-11 | 13 | AGGATCCAACCAT |
| AP-12 | 13 | AGGATCCGGCCAT |
| AP-13 | 13 | AGGATCCGAATGG |
BamHI site is in boldface type.
Figure 1.
Comparison of the pattern of amplicons produced by AP-PCR using the primers AP-3 (13-mer), AP-4 (15-mer), and AP-5 (17-mer). PCR products were analyzed on a 2% NuSieve gel. Lanes: A, ACI; B, BUF; M, HaeIII digest of φX174 DNA. Sizes (bp) are indicated to the right.
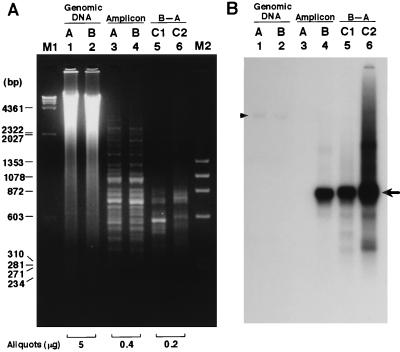
By using the AP-3 amplicon from BUF as the tester and that from ACI as the driver, two cycles of competitive hybridization and selective amplification were performed (Fig. 2A, lanes 3 and 4). The product of the first cycle of competitive hybridization and selective amplification (C1) presented a limited number (≈10) of bands. However, in the product of the second cycle (C2), an intensive band in C1 disappeared, and some selected bands were visualized. The product of C2 was cloned into a vector, and each clone was tested by cross hybridization for independence by dot-blot analysis. Of the 69 clones tested, 22 (32%) were found to be independent. Each independent clone was tested for polymorphism by examining positive or negative signals on the dot blot of amplicons from BUF and ACI rats. Of the 22 independent clones, 7 (32%) were polymorphic, meaning that 10% of the total clones analyzed were independent and polymorphic (Table 2).
Figure 2.
Actual course of AP-RDA using the AP-3 primer. (A) Ethidium bromide staining. Electrophoresis was performed at 100 V for 3 hours. (B) Probed with a polymorphic clone, AP3-G7. Lanes: 1 and 2, BamHI-digested genomic DNAs from ACI and BUF rats; 3 and 4, amplicons of ACI and BUF; 5 and 6, C1 and C2 products of AP-RDA using AP-amplicon from BUF as the tester and that from ACI as the driver. M1 and M2, λ/HindIII and φX174/HaeIII DNA size markers. The arrow on the right shows a polymorphic band detected by AP3-G7 clone. The arrowhead shows hybridization of the genomic DNAs of ACI and BUF with this probe.
Table 2.
Yield of AP-RDA markers (BUF–ACI)
| Primer name | No. of clones
|
No. of clones isolated in both C1 and C2 | No. of independent markers | |||||
|---|---|---|---|---|---|---|---|---|
| Total
|
Independent (% total clones)
|
Polymorphic (% independent clones)
|
||||||
| C1 | C2 | C1 | C2 | C1 | C2 | |||
| Single primer | ||||||||
| AP-3 | 34 | 69 | 22 (65) | 22 (32) | 5 (23) | 7 (32) | 4*† | 8 |
| AP-5 | 40 | 43 | 23 (58) | 5 (12) | 5* (22) | 4† (78) | 3 | 4 |
| AP-6 | 87 | 79 | 34 (39) | 26 (33) | 5 (15) | 6‡ (23) | 2 | 9 |
| AP-7 | 83 | 79 | 46 (55) | 16 (20) | 6 (13) | 5§ (32) | 3 | 8 |
| Subtotal | 241 | 270 | 125 (51) | 69 (26) | 21 (17) | 22 (32) | 12 | 29 |
| AP-9 | 39 | 15 (38) | 4 (27) | 4 | ||||
| AP-11 | 66 | 21 (32) | 1 (5) | 1 | ||||
| AP-12 | 73 | 37 (51) | 6 (16) | 6 | ||||
| Subtotal | 178 | 73 (41) | 11 (15) | 11 | ||||
| Combination | ||||||||
| AP-3 + AP-6 | 45 | 14 (31) | 6‡ (43) | 3 | ||||
| AP-7 + AP-8 | 107 | 17 (16) | 9§ (53) | 4 | ||||
| Subtotal | 152 | 31 (20) | 15 (48) | 7 | ||||
| Total | 241 | 600 | 125 (51) | 173 (29) | 21 (17) | 48 (28) | 12 | 47 |
One clone repeatedly was isolated from C1 and C2 of AP-3 amplicon and C1 of AP-5 amplicon.
Two clones repeatedly were isolated from C1 and C2 of AP-3 amplicon and C2 of AP-5 amplicon.
Three clones repeatedly were isolated from C2 of AP-6 amplicon and C2 of amplicon with AP-3 and AP-6.
Five clones repeatedly were isolated from C2 of AP-7 amplicon and C2 of amplicon with AP-7 and AP-8.
The course of concentration of a polymorphic clone, AP3-G7, is shown in Fig. 2B. When the signal intensities in Fig. 2B, lanes 4, 5, and 6 are compared, a stepwise enrichment of the clone after each cycle of competitive hybridization can be observed (note that a half amount of DNA was applied in Fig. 2B, lane 5, compared with lane 4). When hybridization signals in the amplicons were compared, only BUF but not ACI emitted a strong signal, indicating that this clone can detect the presence or absence of polymorphism between ACI and BUF by using AP-amplicons (Fig. 2B, lanes 3 and 4). In contrast, the probe detected a band of the same size and intensity in the genomic DNA of ACI and BUF (Fig. 2B, lanes 1 and 2).
Genotyping Using the AP-RDA Marker.
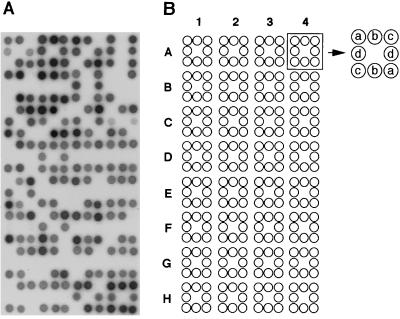
To see whether the polymorphic clones obtained by AP-RDA are really suitable markers for large-scale genotyping, AP-amplicons were prepared from 105 F2 intercross rats, inbred ACI and BUF rats, and the amplicons were dot-blotted onto a filter. By hybridizing the filter with an AP-RDA clone, AP3-G7, individual rats gave clear positive or negative signals (Fig. 3). In the case of F2 intercrosses, rats with genotypes AB and BB gave positive signals. Although BB homozygotes should give signals twice as dense as those of heterozygotes (AB), both were typed as a single group to avoid misreading. The reproducibility of the signal with all of the markers isolated in this study was verified by hybridizing different filters prepared from different amplicons using the same F2 intercross rats (data not shown).
Figure 3.
Dot-blot analysis of F2 intercross rats. (A) Hybridization signals obtained with AP3-G7 probe (D2Ncc32). A total of 128 amplicons were prepared from 105 ACI × BUF F2 rats and from 23 rats of seven inbred strains by AP-PCR. The amplicons were blotted onto a 36- × 72-mm filter in duplicate arrangement, as shown in B, by using a Kriplanker. Note that each amplicon gives a clear positive or negative signal. (B) Arrangement of AP-amplicons. The 36- × 72-mm filter was divided into four columns (1–4) and eight rows (A-H), which was the same arrangement with one-third of a 96-well plate. Each 9- × 9-mm square accommodated duplicate blots of four amplicons (a, b, c, and d).
Primer Length and Yield of Markers.
To clarify the effects of the primer length on the yield of markers, AP-RDA using AP-5 (17-mer) was carried out by using the amplicon from BUF as the tester and that from ACI as the driver. Among the 43 clones examined, which were obtained from C2, four clones (9.3%) were independent and polymorphic (Table 2). Two of these four clones were common to those obtained with the AP-3 primer, but the remaining two clones were different. There was no significant difference between the numbers of polymorphic clones yielded by AP-3 (13-mer) and AP-5 (17-mer). In this study, we adopted several other 13-mer primers for further characterization of the AP-RDA method besides AP-5.
Efficiency of C1 and C2 for Marker Isolation.
To know the efficacy of one- and two-cycle competitive hybridization, C1 and C2 products were cloned from four series of AP-RDA by using AP-3, AP-5, AP-6, and AP-7 (Table 2). Totals of 241 and 270 clones were picked up from the products of C1 and C2, respectively. As for C1, 125 clones (51%) were independent, and 21 of them were polymorphic. As for C2, 69 clones (26%) were independent, and 22 of them were polymorphic. Although there was no significant difference in the yield of polymorphic clones between C1 and C2, there was a significant difference when the fraction of polymorphic clones among independent clones was compared (17% in C1 and 32% in C2). We adopted two-cycle competitive hybridization for the subsequent series of AP-RDA because the fraction of polymorphic clones among independent clones greatly affected the amount of experimental work (see Discussion).
Effect of Primer Sequence.
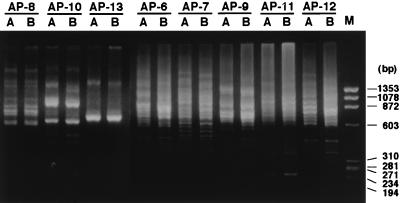
The effect of the primer sequence on the yield of polymorphic markers was tested. Eight new 13-mers (AP-6, -7, -8, -9, -10, -11, -12, and -13), which included the BamHI recognition sequence at the nucleotide position two to seven, were designed randomly by changing sequences at the remaining seven positions (Table 1), and the electrophoretic pattern of the PCR product of each primer was tested. Five amplicons prepared by using AP-6, -7, -9, -11, and -12 showed smear-like patterns (Fig. 4) and were used to isolate polymorphic clones. They yielded 6, 5, 4, 1, and 6 polymorphic markers in C2, respectively. All were suitable for dot-blot analysis of the amplicons. Although the primers AP-3 and AP-9 differed by a single base in the second position to the 3′ end, the markers isolated by AP-3 did not hybridize with any of those isolated by AP-9.
Figure 4.
Pattern of AP-amplicons with AP-primers 6 to 13. Amplicons with AP-6, AP-7, AP-9, AP-11, and AP-12 displayed a smear-like pattern. Lanes: A, ACI; B, BUF; M, HaeIII digest of φX174 DNA. Sizes (bp) are indicated to the right.
Combination of Primers.
It was expected that a combination of two primers would enhance the yield of polymorphic markers as a result of an increase in the kinds of DNA fragments amplified in the AP-amplicon. To clarify this possibility, AP-3 and AP-6 were used in combination to prepare an amplicon (Table 2). Of the 45 clones picked up from the C2 product, six were independent and polymorphic. Among these six clones, three turned out to have already been isolated by AP-RDA using AP-6 only, but the other three new clones were unique to the amplicon from the combined primers. Another combination, primers AP-7 and AP-8, yielded five polymorphic clones that were identical with those isolated by using AP-7 only and four new clones. Three of these four hybridized with an AP-7 amplicon, and the remaining one hybridized with that from the combination primer. Genotyping with all of these seven newly isolated markers also was reproducible in two independent experiments.
Chromosomal Mapping and Informativeness in Other Strains.
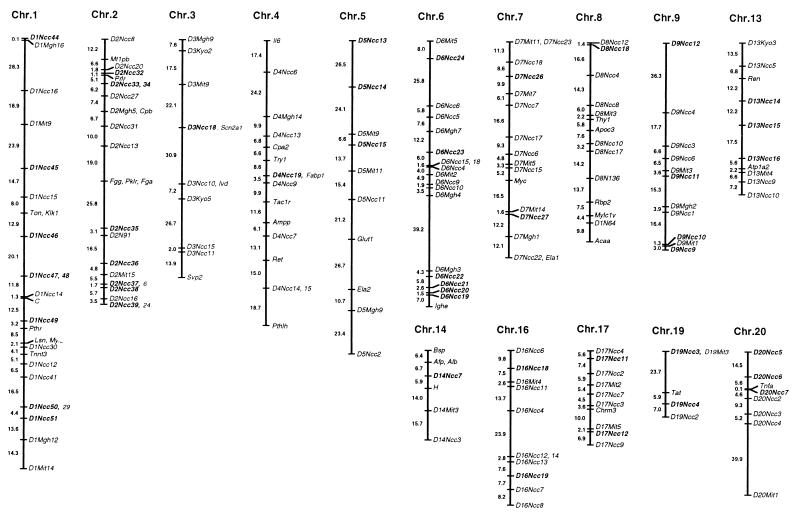
By linkage analysis using our F2 mapping panel, a total of 47 polymorphic markers isolated by AP-RDA in this study were mapped to a chromosomal position with logarithm of odds scores of >5.0 (Fig. 5). The markers isolated by different primers were mapped to different chromosomal positions. Informativeness in other strains of rats—Donryu, Brown Norwegian, Fischer 344, Lewis, and SD—also were tested. Between given two strains, 23–60% of the AP-RDA markers were informative. The newest information on the map positions, informativeness among rat strains and sequences of our RDA-related markers (RDA, IRS-RDA, CAAT-RDA, and AP-RDA markers), is available at http://www.ncc.go.jp/research/rat-genome.
Figure 5.
Result of chromosomal mapping of the AP-RDA markers. Three coat colors, 109 microsatellite markers reported previously, and 93 RDA-related markers were used as anchor loci. AP-RDA markers obtained in this study are indicated in boldface type.
DISCUSSION
We developed the AP-RDA method to isolate genetic markers, named AP-RDA markers, polymorphic between two inbred strains of rats. The AP-RDA markers we isolated gave clear positive/negative signals on dot blots of AP-amplicons as CAAT-RDA and IRS-RDA markers (3, 7). The AP-amplicons were prepared simply by performing AP-PCR using genomic DNA as a template. The PCR solution was blotted simply after denaturation, without any purification or concentration steps. By dot-blotting AP-amplicons at a high density, genotyping of hundreds of animals can be performed easily. The genotypes determined by AP-RDA markers were reproducible, and 47 markers isolated in this study were mapped by linkage analysis using our F2 mapping panel.
The major advantage of the AP-RDA method over CAAT-RDA and IRS-RDA methods is that we can isolate as many markers as necessary with this method. Two primers, AP-3 and AP-9, which differed only in one base, yielded totally different sets of genetic markers, which was in concordance with the findings in AP-PCR that even a single nucleotide substitution in primer sequences can change the pattern of PCR products (9). Other primers, AP-6, -7, -11, and -12, also yielded different sets of markers, respectively. Although we have to place a restriction site in a primer for technical purposes, the restriction sequence can be changed for other restriction enzymes. The length of the primers also can be changed because a 13-mer and a 17-mer showed a similar yield of markers. Therefore, by changing the sequence and size of the primers, as many high throughput genetic markers as necessary can be isolated.
The efficiencies of C1 and C2 to isolate polymorphic markers were compared by using AP-3, -5, -6, and -7. The actual numbers of polymorphic clones were similar in both C1 (21 clones) and C2 (22 clones), but the fraction of polymorphic clones among independent clones was much higher in C2 than in C1. Because the screening of polymorphic clones constitutes the major task in the course of AP-RDA, we chose C2 in this study to minimize the labor.
AP-RDA was performed by using the AP-amplicon from BUF as the tester and that from ACI as the driver to isolate markers that can be used for genotyping in ACI × (ACI × BUF)F1 backcross rats. This one-way subtraction yielded 33 polymorphic clones (an average of 4.7 clones per primer) in the C2 of the “single primer” experiments (Table 2, upper half). Therefore, we will be able to expect an average of 9.4 markers per primer by performing AP-RDA in the reverse direction (subtraction of ACI by BUF), which is a much better yield compared with the conventional AP-PCR method (10). The C2 obtained by one-way subtraction in the two “combination” experiments yielded 15 polymorphic clones (an average of 7.5 clones per combination; Table 2, lower half). AP-RDA using combination primers demonstrated that some markers isolated were present only in the amplicon from the combination. However, 11 of 15 were present in the amplicons from sole primers. Thus, combination primers will yield some markers that are unique to the combination, but the efficacy was low. It is necessary to obtain more markers from single AP-amplicons for efficient use of the markers, and the yield of markers depends on the primer sequence.
AP-RDA markers obtained by subtraction of A strain by B distinguish only animals with BB genotype from those with AB or AA genotype. This leads to a loss of genotype information in an F2 population of animals. However, this loss can be compensated by increasing the number of markers used for genotyping, which is easy with AP-RDA markers. The genomic information of the AP-RDA markers was obtained by Southern blot analysis of genomic DNA and sequencing of the markers. Southern blot analysis (Fig. 2B, lanes 1 and 2) showed that the marker sequence (AP3-G7: D2Ncc32) was present in the same manner in the genomic DNA of ACI and BUF and indicated that the presence/absence of the marker in the AP-amplicons was attributable to base substitution(s) or deletions in the priming sites. Sequences of six markers were determined (data not shown), and the GenBank database was searched with the sequences. However, no homology was found with any registered sequences.
To facilitate mapping of quantitative trait loci in the rat, we are making a genetic map, consisting of AP-RDA and other RDA-related markers, that covers the entire genome of the rat. The relationship between the RDA-related markers and microsatellite markers also is included in the map, and the newest version of our map is provided at http://www.ncc.go.jp/research/rat-genome. The application of this technology to the mouse and human genome should also make it possible to genotype thousands of individuals, and we hope this will open up a new field of genotype-phenotype relationship.
Acknowledgments
The authors thank Dr. Barry W. Glickman for his critical discussions. This work was supported by the Program for Promotion of Fundamental Studies in Health Sciences of the Organization for Drug ADR Relief, Research and Development Promotion and Product Review of Japan, and Public Trust Haraguchi Memorial Cancer Research Fund. S.Y. is a recipient of a Research Resident Fellowship from the Foundation for Promotion of Cancer Research, Japan.
ABBREVIATIONS
- RDA
representational difference analysis
- AP
arbitrarily primed
- IRS
interspersed repetitive sequence
- ACI
ACI/N rat
- BUF
BUF/Nac rat
References
- 1.Paterson A H. Genome Res. 1995;5:321–333. doi: 10.1101/gr.5.4.321. [DOI] [PubMed] [Google Scholar]
- 2.Jacob H J, Brown D M, Bunker R K, Daly M J, Dzau V J, Goodman A, Koike G, Kren V, Kurtz T, Lernmark A, et al. Nat Genet. 1995;9:63–69. doi: 10.1038/ng0195-63. [DOI] [PubMed] [Google Scholar]
- 3.Ushijima T, Nagao M. In: Human Polygenic Diseases: Animal Models. Dragani T, editor. London: Harwood; 1998. pp. 231–246. [Google Scholar]
- 4.Lisitsyn N, Lisitsyn N, Wigler M. Science. 1993;259:946–951. doi: 10.1126/science.8438152. [DOI] [PubMed] [Google Scholar]
- 5.Toyota M, Canzian F, Ushijima T, Hosokawa Y, Kuramoto T, Serikawa T, Imai K, Sugimura T, Nagao M. Proc Natl Acad Sci USA. 1996;93:3914–3919. doi: 10.1073/pnas.93.9.3914. [DOI] [PMC free article] [PubMed] [Google Scholar]
- 6.McCarthy L, Hunter K, Schalwyk L, Riba L, Anson S, Mott R, Newell W, Bruley C, Bar I, Ramu E, et al. Proc Natl Acad Sci USA. 1995;92:5302–5306. doi: 10.1073/pnas.92.12.5302. [DOI] [PMC free article] [PubMed] [Google Scholar]
- 7.Ushijima, T., Nomoto, T., Sugimura, T., Housman, D. & Nagao, M. Mamm. Genome, in press. [DOI] [PubMed]
- 8.Welsh J, McClelland M. Nucleic Acids Res. 1990;18:7213–7218. doi: 10.1093/nar/18.24.7213. [DOI] [PMC free article] [PubMed] [Google Scholar]
- 9.Williams J G K, Kubelik A R, Livak K J, Rafalski J A, Tingey S V. Nucleic Acids Res. 1990;18:6531–6535. doi: 10.1093/nar/18.22.6531. [DOI] [PMC free article] [PubMed] [Google Scholar]
- 10.Canzian F, Ushijima T, Toyota M, Hosoya Y, Sugimura T, Nagao M. Jpn J Cancer Res. 1996;87:669–675. doi: 10.1111/j.1349-7006.1996.tb00275.x. [DOI] [PMC free article] [PubMed] [Google Scholar]
- 11.Sambrook J, Fritsch E F, Maniatis T. Molecular Cloning. Vol. 2. Plainview, NY: Cold Spring Harbor Lab. Press; 1989. pp. 9.14–9.23. [Google Scholar]
- 12.Lander E S, Green P, Abrahamson J, Barlow A, Daly M J, Lincoln S E, Newburg L. Genomics. 1987;1:174–181. doi: 10.1016/0888-7543(87)90010-3. [DOI] [PubMed] [Google Scholar]


