Abstract
Substrate-supported planar lipid bilayers are generated most commonly by the adsorption and transformation of phospholipid vesicles (vesicle fusion). We have recently demonstrated that simultaneous measurements of surface plasmon resonance (SPR) and surface plasmon fluorescence spectroscopy (SPFS) are highly informative for monitoring lipid membranes on solid substrates. SPR and SPFS provide information on the amount and topography of adsorbed lipid membranes, respectively. In this study, the vesicle fusion process was studied in detail by measuring SPR-SPFS at a higher rate and plotting the obtained fluorescence intensity versus film thickness. We could track the initial adsorption of vesicles, the onset of vesicle rupture occurring at certain vesicle coverage of the surface, and the autocatalytic transformation into planar bilayers. We also monitored vesicle fusion of the same vesicle suspensions by quartz crystal microbalance with dissipation monitoring (QCM-D). We compared the results obtained from SPR-SPFS and QCM-D to highlight the unique information provided by SPR-SPFS.
INTRODUCTION
Spherical phospholipid vesicles adsorb and transform into a planar bilayer on some hydrophilic surfaces such as silica and mica (1,2). This process (vesicle fusion) results in the formation of a continuous lipid bilayer membrane in which lipids and membrane-associated proteins can diffuse freely within the two-dimensional fluid. This type of substrate-supported planar bilayers (termed simply planar bilayers in the following) is being studied extensively as a model cellular membranes for biophysical studies and biomedical applications (3). However, successful preparation of planar bilayers via vesicle fusion still poses significant technological challenges for many types of substrate (such as hydrophilic polymers and self-assembled thiol monolayers) and lipid (such as negatively charged phospholipids) (4). To achieve reliable formation of planar bilayers with this technique, a deep understanding of the self-assembly process is indispensable. Through theoretical (5,6) and experimental studies (7–13) during the last 20 years, a general agreement has emerged that adsorbed vesicles transform into planar discs either individually or collectively, depending on the size and physicochemical nature of the lipid vesicles. In the former scenario, the vesicles must have a relatively strong interaction with the substrate surface and a low bending elasticity of the membrane so that a deformed vesicle can rupture. In the latter scenario, spherical vesicles must first accumulate on the surface before they start to rupture, presumably due to the destabilization of adsorbed vesicles by the interaction with neighbor vesicles. Studies using quartz crystal microbalance with dissipation monitoring (QCM-D) (9,12,14–16) and atomic force microscopy (AFM) (12,13,16) have demonstrated that adsorbed vesicles remained intact on the surface until the amount of vesicles reached a certain threshold value (critical vesicle coverage: CVC) for many biologically relevant phospholipid vesicles (e.g., phosphatidylcholine). Therefore, an understanding of the vesicle fusion pathway in which vesicles first accumulate on the surface and then start to rupture collectively (the second scenario) is important for the generation of planar bilayers that are meaningful as model cellular membranes. Although QCM-D and AFM are very powerful tools to analyze the vesicle fusion process, certain key mechanistic factors remain elusive. For example, unambiguous determination of the CVC at which vesicles start to rupture is not possible with QCM-D. Estimating the amount of vesicles and planar bilayers in the course of vesicle fusion is also very difficult, although there have been attempts to resolve these two populations (17).
Recently, we demonstrated that simultaneous measurement of surface plasmon resonance (SPR) and surface plasmon fluorescence spectroscopy (SPFS) is a highly informative technique for monitoring the lipid assembly process on solid substrates (18). SPFS is a fluorescence spectroscopy that uses the excitation by an evanescent field amplified at the metal/dielectric interface, i.e., a surface plasmon field (19,20). The fluorescence intensity of SPFS depends very sensitively on the distance between the gold substrate and the fluorophore because of the excitation energy transfer to a thin gold layer (21). By utilizing this distance dependency, we could obtain information on the topography of the adsorbed membranes: Adsorbed vesicles could be clearly distinguished from planar bilayers due to the high fluorescence intensity. Together with the information on the thickness of adsorbed lipid materials determined to subnanometer precision by SPR, SPR-SPFS offers new possibilities to analyze the vesicle fusion process in depth.
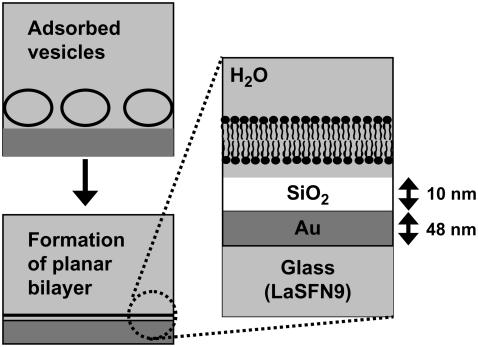
Herein we present a systematic SPR-SPFS investigation of the transformation of phospholipid vesicles into planar bilayers. Gold substrates with a silica layer of defined thickness were used, where the silica layer acted as a spacer that modulated the energy transfer from excited fluorophores in the adsorbed bilayer to the gold substrate (Fig. 1). We analyzed the vesicle fusion process more thoroughly than in the previous study by measuring SPR-SPFS spectra with a higher rate and plotting the fluorescence intensity versus film thickness. In this way, we could assign the onset of vesicle rupture and also estimate the amount of adsorbed vesicles and planar bilayers in the course of vesicle fusion. These results demonstrate that SPR-SPFS can provide unique information on the vesicle fusion pathway. We compare SPR-SPFS with QCM-D to highlight the differences in the information they each obtain.
FIGURE 1.
Schematic illustration of vesicle fusion on silica substrates. Left: Adsorbed vesicles transform into a planar bilayer. Right: Silica-coated substrate used in this study.
MATERIALS AND METHODS
Materials
1-Palmitoyl-2-oleoyl-sn-glycero-3-phosphocholine (POPC), 1-palmitoyl-2-oleoyl-sn-glycero-3-phospho-L-serine (POPS), and 1,2-dioleoyl-3-trimethylammonium-propane (DOTAP) were purchased from Avanti Polar Lipids (Alabaster, AL). 1,1′-dioctadecyl-3,3,3′,3′-tetramethylindodicarbocyanine perchlorate (DiD; excitation/emission: 644 nm/665 nm, extinction coefficient: 260,000) was purchased from Molecular Probes (Eugene, OR). All other chemicals were reagent grade and used without further purification. Glass substrates (25 × 25 × 1.5 mm) with a high refractive index (LaSFN9: ɛ′ = 3.4069 at λ of 632.8 nm) were obtained from Hellma Optik (Jena, Germany). Gold (Au), chromium (Cr), and silica (SiO2) sputtering targets were obtained from Furuuchi Chemical Corporation (Tokyo, Japan).
Substrates preparation
LaSFN9 glass substrates were cleaned by sonicating in a 1% Hellmanex (Hellma, Müllheim, Germany) solution for 20 min and rinsing extensively with fresh Milli-Q water. They were dried under airflow.
The Au, Cr, and SiO2 coatings were prepared by sputtering. Au thin film was deposited onto LaSFN9 glass substrates by direct current-magnetron sputtering (100 W) in Ar gas at 8 Pa (SINKO SEIKI SCV-430, Nagano, Japan). The sputtering time was ∼1 min so that the gold layer thickness would be 48 ± 5 nm. The SiO2 substrates were prepared in two steps using a different sputtering machine (Rikensya RSP-4-RF5/DC5, Osaka, Japan). At first, a Cr layer of less than 1-nm thick was deposited by direct current sputtering (5 W) at room temperature onto the Au surface in Ar gas at 0.3 Pa. Subsequently, a 10-nm-thick SiO2 layer was deposited onto the Cr layer by radio frequency-magnetron sputtering (100 W) at room temperature in Ar gas at 0.1 Pa.
Vesicle preparation
Vesicle suspensions (0.01 M phosphate buffer with 0.15 M NaCl (pH 6.6)) were prepared according to the following protocol. Lipids and DiD fluorescence marker were mixed in a chloroform solution, the solvent was evaporated using a stream of nitrogen and in vacuum, and the lipids were allowed to hydrate in the buffer. The resulting multilamellar vesicles were put through five freeze/thaw cycles and then extruded through a polycarbonate filter with pores of 50 nm in diameter (LiposoFast: Avestin, Ottawa, Canada). The total lipid concentration used for the measurements was 0.1 mM, and the vesicles contained 10 nM of DiD (10−4 mol/mol with respect to the lipids).
SPR-SPFS measurements
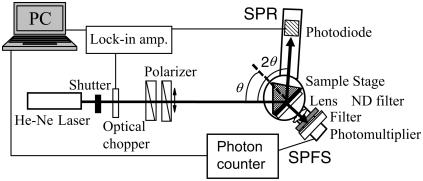
The details of the SPFS setup are described in previous articles (20,22). Briefly, the setup is based on the essential modules of a 'normal' surface plasmon spectrometer as shown in Fig. 2. The beam of a He-Ne laser operating at 632.8 nm was passed through an optical chopper (also used as the reference for the lock-in amplifier) and two polarizers for intensity and polarization control. By using a θ-2θ goniometer, the light reflected at the substrate covered with the thin gold layer was monitored by a photodiode. The diameter of the laser spot on the substrate was ∼1 mm. Any change in the interfacial architecture induced by adsorption or desorption processes can be quantified by evaluating the resulting shift in the SPR spectra. As discussed in the previous work (22), the optical field, which is strongly enhanced at the SPR angle, can be used to excite fluorescence molecules attached to the surface-bound analyte. The angular characteristic of the fluorescence intensity thus follows the angular dependence of the optical field at the interface. Compared with the intensity enhancement for total internal reflection (∼4 times the incident light) at the critical angle, the enhancement for SPR can be up to 20–30 times higher. Fluorescent molecules that are within the evanescent field, which decays normal to the interface with a penetration depth of Lz = 150 nm, can be excited by this surface plasmon mode. The emission was monitored by a photomultiplier (after passing through an appropriate lens, a 10%-neutral density filter, and a narrow band interference filter, λ = 670 ± 5 nm) mounted on the goniometer part that rotates with θ, together with the coupling prism (Fig. 2). The time-dependent fluorescence spectra were also observed by SPFS.
FIGURE 2.
Schematic diagram of the SPR-SPFS setup.
The sample cell was made of Teflon and contained in- and outlets for the solution exchanges. Two sides of the cell were sealed via a Viton O-ring against a quartz plate and an Au-coated high refractive glass slide (LaSFN9) which was index matched to the prism, respectively. The diameter of a substrate applicable to the formation of a planar lipid bilayer was 6.0 mm, which is large enough compared with the observation area (the size of the laser spot). All solutions used in this study were prepared using a phosphate buffer (0.01 M) with additional NaCl (0.15 M) at pH = 6.6. All measurements were performed at room temperature (22°–23°C).
QCM-D measurements
The QCM-D measurements were performed with a Q-Sense D300 system with a QAFC 302 axial flow chamber (Q-Sense, Göteborg, Sweden). The QCM sensor crystal was oscillated at its resonance frequency of 5, 15, 25, and 35 MHz, and the frequency shift (Δf) and dissipation (ΔD) were monitored at three harmonics (15, 25, and 35 MHz). The interval for data acquisition was 0.4 s. The mounted QCM sensor crystal was equilibrated with a degassed buffer solution at 21.8°C. The buffer solution was subsequently replaced with the vesicle suspension (lipid concentration 0.1 mM).
RESULTS AND DISCUSSION
Adsorption and transformation of phospholipid vesicles observed by SPR-SPFS
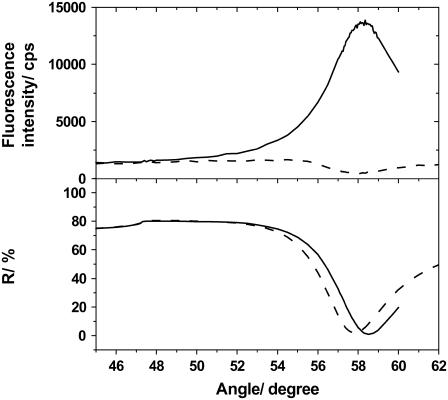
We first describe typical SPR-SPFS results obtained for the transformation of phospholipid vesicles on silica-coated gold substrate. Fig. 3 shows SPR-SPFS spectra obtained for POPC vesicle suspensions containing POPS (20% mol/mol) and DiD (10−4 mol/mol) (POPC/POPS (4:1)). The SPR dip shifted to a larger angle after the addition of vesicles, and an SPFS peak appeared in the same angle region due to the adsorption of lipid membranes containing DiD. The adsorbed film thickness could be determined by fitting the SPR curve to the theoretical model based on the Fresnel's equation and using a program called WINSPALL (http://www.mpip-mainz.mpg.de/documents/akkn/index.html). The refractive index of phospholipid bilayers was assumed to be 1.49 (23,24). It should be noted here that the thickness determined by SPR depends on the distance between the adsorbed material and the substrate surface, because material farther away from the surface contributes less to the optical effect. Therefore, the obtained thickness is an “exponentially weighed average thickness” for vesicles, which slightly underestimates the amount of adsorbed lipid material. However, we use the term “thickness” both for adsorbed vesicles and planar bilayers to indicate the amount of adsorbed lipid materials. This approximation generally does not change the course of the present discussion, except for the exact values of CVCs (vide infra). On the other hand, the observed fluorescence intensity depends on the distance of membrane from gold substrate due to the following two factors. The first is the exponential decay of the evanescent field (surface plasmon). The second is the energy transfer from excited fluorophore molecules to the gold substrate (quenching). A detailed description of the distance-dependent fluorescence intensity for a planar bilayer on silica-coated gold substrate is given in the Supplementary Material. For a small distance (up to ∼50 nm), the quenching dominates the obtained fluorescence intensity, whereas the exponential decay of the evanescent wave becomes determinant for a large distance. In this study, we applied extruded vesicles with the size of ∼50 nm and utilized the distance dependency only within the quenching regime.
FIGURE 3.
SPR (lower frame) and SPFS (upper frame) spectra measured in buffer solution before (dashed lines) and after (solid lines) the incubation with the vesicle suspension of POPC/POPS (4:1). The total lipid concentration of vesicle suspensions was 0.1 mM.
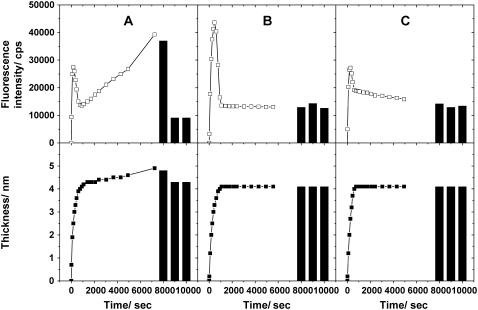
For kinetic studies, we measured SPR-SPFS spectra every 90 s in the initial stage of vesicle fusion. This rate was chosen to ensure satisfactorily precise evaluation of the membrane thickness using the present experimental setup: Near the minimum of SPR spectra (56°–60°), reflected light was collected at the interval of 0.5° for 56°–57° and 59°–60°, and 0.1° for 57°–59°, respectively. The time courses of the film thickness and fluorescence intensity are plotted in Fig. 4 for vesicle suspensions of three different lipid compositions, POPC, POPC/POPS (4:1), and POPC/DOTAP (4:1). (A trace amount of DiD (10−4 mol/mol) was added to all samples.) POPS is a negatively charged lipid, and DOTAP is a positively charged synthetic lipid. The three samples showed some common features. First, after the introduction of vesicle suspensions, the film thickness monotonically increased and reached the final value of ∼4 nm in 1000 s. Second, the fluorescence intensity reached a maximum 200–500 s after the vesicle introduction and decreased rapidly again, indicating the transformation from adsorbed vesicles to planar bilayers as discussed below. There were some notable differences between the samples as well. The fluorescence intensity became constant after ∼1000 s in the case of POPC/POPS vesicles (Fig. 4 b), whereas it increased for POPC vesicles, indicating further adsorption of lipid material on the surface (Fig. 4 a). (The film thickness slightly increased at the same time.) For POPC/DOTAP vesicles, the fluorescence intensity decreased gradually, indicating a slow reorganization of adsorbed lipid films (Fig. 4 c). After incubating for ∼6000 s, the samples were rinsed successively with the buffer solution, Milli-Q water, and the buffer solution again. The film thickness and fluorescence intensity did not change during the rinsing procedures for POPC/POPS and POPC/DOTAP, whereas a large decrease of the fluorescence intensity was observed for POPC upon rinsing with Milli-Q water (the film thickness decreased slightly at the same time), suggesting the removal of lipid materials (vesicles).
FIGURE 4.
Kinetic observation of vesicle fusion by SPR-SPFS. The lipid layer thickness observed by SPR (lower frame) and the fluorescence intensity observed by SPFS (upper frame) were plotted versus incubation time for vesicles of (a) POPC, (b) POPC/POPS (4:1), and (c) POPC/DOTAP (4:1). A trace amount of DiD (10−4 mol/mol) was added to all samples. The total concentration of vesicle suspensions was 0.1 mM. The solid columns indicate values after successive rinsings with the buffer solution, Milli-Q water, and the buffer solution, respectively (from left to right). Milli-Q water and buffer solution have different refractive indices. This difference was incorporated in the SPR curve fitting to evaluate the adsorbed layer thickness.
Plotting fluorescence intensity versus film thickness during vesicle fusion
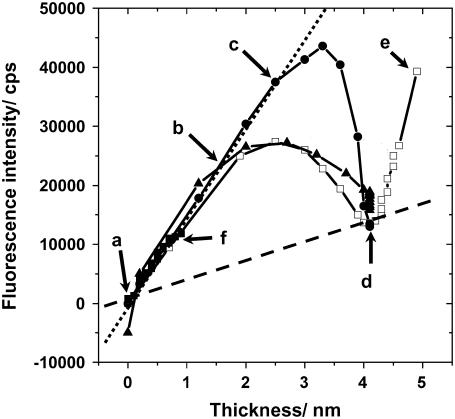
To attain information on the geometries of adsorbed lipid membranes, we plotted the fluorescence intensity obtained by SPFS versus film thickness determined by SPR during vesicle fusion. Fig. 5 shows the fluorescence-thickness trajectories obtained for vesicles of various lipid compositions. In addition to the vesicle samples shown in Fig. 4, the result from vesicle suspensions composed of equal amounts of POPC and POPS (POPC/POPS (1:1)) was plotted. The trajectories showed the following characteristic features. 1), The fluorescence intensity increased linearly with the thickness after the introduction of vesicles (a and b). 2), The trajectories deflected from linearity at a certain point, as indicated with the arrow (c) for the case of POPC/POPS (4:1). The thickness continued to increase, but the fluorescence intensity reached a maximum value and started to decrease. The location of the deflection from linearity and the subsequent parabolic trajectories varied depending on the lipid compositions. 3), The trajectories converged at point (d). Both the film thickness (∼4 nm) and the fluorescence intensity (∼10,000 cps: see the Supplementary Material) indicate that the substrate surfaces were covered by a planar bilayer at this point. 4), Only in the case of POPC vesicles did the thickness and fluorescence intensity resume to increase steeply (e). The slope of fluorescence intensity versus film thickness indicated that intact vesicles adsorbed further on the substrate surface. This portion of adsorbed lipid material could be removed by rinsing with Milli-Q water, and both the thickness and fluorescence intensity returned to point (d) (see Fig. 4). Additional adsorption of vesicles after the formation of planar bilayers was observed only in the case of POPC vesicles and depended on samples (for many cases no adsorption of vesicles was observed also for POPC vesicles). In previous SPR-SPFS measurements, we observed a linear increase of fluorescence intensity versus film thickness on silica surfaces (18). However, this result was most likely due to the low rate of measurement in the previous study, which did not detect the initial accumulation of vesicles on the surface. Therefore, the present results should be a more accurate representation of the vesicle fusion process.
FIGURE 5.
Plot of fluorescence intensity versus adsorbed lipid film thickness measured by SPR-SPFS during the vesicle fusion process. Four types of vesicles were compared: POPC (open squares); POPC/POPS (4:1) (solid circles); POPC/POPS (1:1) (solid squares); POPC/DOTAP (4:1) (solid triangles). The arrows indicate (a) before the addition of vesicles, (b) initial linear phase (adsorption of vesicles), (c) onset of vesicle rupture (for POPC/POPS (4:1)), (d) complete coverage with planar bilayer, and (e) additional adsorption of vesicles (for POPC), respectively. The sign (f) indicates the profile of POPC/POPS (1:1). The dotted and dashed lines were given to indicate the linearity of fluorescence intensity versus film thickness for adsorbed vesicles and planar bilayers, respectively.
Vesicle adsorption at the initial stage
Plotting the fluorescence intensity versus film thickness measured by SPR-SPFS can provide mechanistic information of the vesicle fusion process. The fluorescence intensity increased linearly with film thickness in the initial stage. This feature was observed for all tested vesicles with varied lipid compositions. The fact that the most negatively charged vesicle sample tested (POPC/POPS (1:1)) also showed the same linear phase strongly suggests that the adsorbed lipid membranes existed predominantly in the form of vesicles. The trajectory of POPC/POPS (1:1) ended in the initial linear phase, indicating that vesicles did not transform into planar bilayers (f). For the same lipid composition, we observed a more massive adsorption of vesicles onto silica substrate by QCM-D (data not shown), in agreement with previous studies (12). The different behaviors may stem from the difference in the surface properties of silica-coating layers, because these substrates were fabricated by different methods. The slopes of fluorescence versus film thickness were nearly the same for different vesicle samples. From these slopes, one could possibly estimate the mean distance between the membrane and the gold substrate. The dotted line in Fig. 5 has the slope of 15,000 (cps/nm). By using the previously determined dependency of fluorescence intensity on the distance between adsorbed planar bilayer and gold substrate (see the Supplementary Material), we estimated the mean distance of the lipid membranes from the silica substrate surface to be 18 nm. (As an approximation, we integrated the fluorescence intensity of a spherical vesicle of unknown radius and determined the radius that fitted most to the experimental data. This radius was used as the mean separation between the substrate and the lipid membrane.) Since vesicles were prepared by extrusion through 50-nm pores, this value corresponds to slightly deformed vesicles (spherical vesicles should have the average separation of 25 nm). In addition to the above approximation, this estimation has uncertainties due to the following reasons. First, the film thickness determined by SPR is slightly different for vesicles and planar bilayers (the thickness of vesicles measured by SPR is slightly underestimated). Second, dye molecules in vesicles have various orientations with respect to the substrate, in contrast with planar bilayers where we could assume a single orientation, influencing the efficiency of energy transfer. Third, the dielectric constant of the aqueous medium between the membrane and the substrate has to be incorporated. Fourth, positively charged fluorophore (DiD) may not be distributed homogeneously within the membrane. (It has been reported that the asymmetric distribution of charged lipids between two monolayers is rather small in the case of planar bilayers on silica (2); however, local accumulation of DiD within vesicles by lateral migration cannot be excluded.) Despite these limitations, the fluorescence intensities determined by SPFS should be directly correlated with the mean displacement of the adsorbed membrane from the substrate (the shape of adsorbed vesicles). The result that slopes were nearly the same for vesicles with different lipid compositions indicates that the shapes of adsorbed vesicles did not differ significantly. Since positively charged vesicles are supposed to adsorb more strongly onto the silica surface by electrostatic interactions, it is generally expected that they are more flattened on the surface. There may be small differences in the shape of adsorbed vesicles that are within the uncertainty limits of the present SPR-SPFS measurements. A more precise determination of slopes for different types of vesicles and comparison with AFM studies should provide more detailed information on the effect of lipid compositions (especially charges) on the shapes of adsorbed vesicles.
CVC
The initial linear increase and subsequent deflection of fluorescence-thickness trajectories suggest that vesicles started to transform into planar bilayer disks only after a certain amount of vesicles accumulated on the surface (CVC). The location of deflection varied depending on the lipid compositions. The positively charged vesicle sample (POPC/DOTAP (4:1)) deflected from the linearity at the earliest stage. The deflection was observed at a later stage for POPC/POPS (4:1). Vesicles of POPC/POPS (4:1) also adsorbed onto the surface considerably more slowly compared with other lipid compositions, presumably because of the electrostatic repulsion with the substrate surface. However, it is important to note that the trajectories that we discuss here provide information on the pathway of adsorption and transformation. The rate is given in the separate time courses of SPR-SPFS (Fig. 4). The amount of adsorbed lipid materials (in terms of thickness) at CVC could be estimated to be 1.9 nm, 2.5 nm, and 1.2 nm for POPC, POPC/POPS (4:1), and POPC/DOTAP (4:1), respectively. (Since these are the thickness determined by SPR, they are slightly lower than the true amount of adsorbed lipid material in the form of spherical vesicles.) The CVC values were clearly affected by the lipid compositions (especially charges). The observations that vesicle rupture started at CVCs, together with the finding that the shapes of adsorbed vesicles did not significantly change for different lipid compositions, suggest that interactions between vesicles are critical for triggering the initial vesicle rupture in these conditions (isolated vesicles do not rupture individually). At the same time, the difference in CVCs for different lipid compositions indicates the importance of electrostatic interactions between vesicles and the substrate surface. The microscopic mechanisms that determine the location of CVC is currently not fully understood. The initial formation of planar bilayer disks may be triggered by stochastic destabilization and rupture of single vesicles or by the interaction of neighboring vesicles (possibly fusion of vesicles and generation of larger vesicles). However, the gross behavior on the macroscopic surface is a statistically determined process, and we observed the onset of planar bilayer formation at a constant point. Accumulation of CVC data for various lipid compositions and surfaces should shed light on the mechanism underlying the onset of vesicle rupture.
Amounts of adsorbed vesicles and planar bilayers during vesicle fusion
Within the parabolic region between the points (c) and (d), both vesicles and planar bilayers should be coexisting on the surface. One can estimate the amount of vesicles and planar bilayers in this regime separately, assuming that both thickness and fluorescence can be divided into two populations with defined values of fluorescence intensity per unit film thickness. The total fluorescence intensity (measured by SPFS) and film thickness (determined by SPR) can be expressed as follows.
 |
(1) |
 |
(2) |
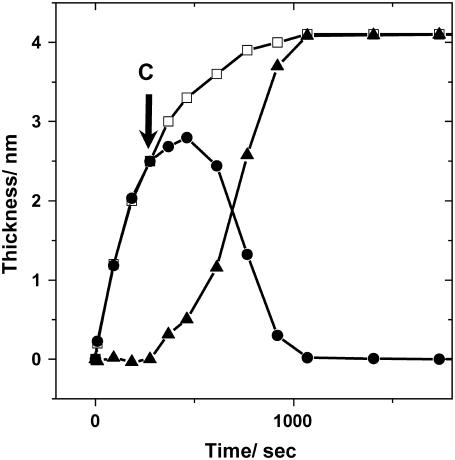
Here, F, f, and d are observed fluorescence intensity, fluorescence intensity per unit thickness, and film thickness, respectively. Subscripts m, v, and p represent measured values, the contribution from vesicles, and the contribution from planar bilayers, respectively. From the slopes in Fig. 5, fluorescence intensity per unit thickness for vesicles and planar bilayers can be estimated: i.e., fv = 15,000 cps/nm, fp = 3,500 cps/nm. Eq. 1 represents the fluorescence intensity measured by SPFS as the sum of contributions from vesicles and planar bilayers with the thickness of dv and dp, respectively. Eq. 2 is the total thickness measured by SPR. By applying these simple arithmetical equations to the experimental data, we could separate the measured total thickness into vesicle and planar bilayer fractions. Fig. 6 shows the result obtained for POPC/POPS (4:1). Initially, the film thickness was composed solely of adsorbed vesicles. Shortly after planar bilayers started to form, the vesicle fraction reached the maximum and started to decrease, resulting in a bell-shaped time course. The planar bilayer fraction started to form at the CVC (indicated with the sign C in Fig. 6). The increase was slow at the beginning but was accelerated progressively afterwards. It has been previously reported that adsorbed bilayer disks can enhance the rupture of neighboring vesicles, because they expose energetically unfavorable edges (6,10,12,13). Our recent investigations also demonstrated that the edges of prepatterned polymeric lipid bilayers can promote the vesicle fusion process (25). As a result of enhanced rupture of vesicles by bilayer edges, formation of planar bilayers on the substrate should proceed in an autocatalytic manner once some planar bilayer disks have started to form. The profile in Fig. 6 also supports this premise.
FIGURE 6.
The amount of adsorbed vesicle and planar bilayer during the vesicle fusion of POPC/POPS (4:1) estimated from the plot in Fig. 5. The open squares are the total film thickness determined by SPR. The solid circles and triangles are the estimated film thickness for vesicles and planar bilayers, respectively. (The film thickness determined by SPR is slightly underestimated for vesicles.)
Comparison with the QCM-D measurements
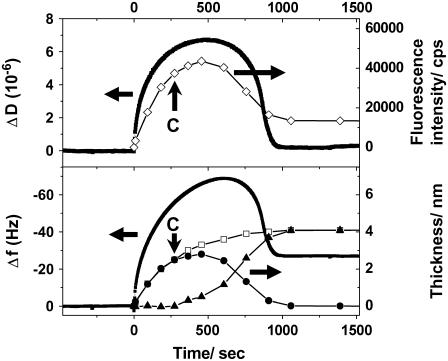
We monitored the vesicle fusion process also by QCM-D to compare the kinetic results with SPR-SPFS. Silica-coated sensors were used for the QCM-D measurements. The QCM-D profiles (the resonance frequency shift (Δf) and the dissipation (ΔD)) obtained for vesicle fusion of POPC/POPS (4:1) are shown in Fig. 7, together with the data from SPR-SPFS. A temporal minimum in Δf and a temporal maximum in ΔD were observed, indicating that intact vesicles accumulated on the substrate surface before undergoing the transition into planar bilayers (9). The final values for Δf (∼−25 Hz) and ΔD (near zero) corroborated the planar bilayer formation. Δf is correlated with the mass of adsorbed material and comparable to the film thickness determined by SPR. On the other hand, ΔD and the fluorescence intensity measured by SPFS should be comparable, because both are indications of adsorbed vesicles. As shown in Fig. 7, the time courses of QCM-D and SPR-SPFS for the same vesicle sample correlated well, although the experiments were conducted using independent flow cells with different geometries: The maximum values in fluorescence and dissipation were attained at the same time after the introduction of vesicle suspensions. The vesicle fusion process also finished at the same time. On the other hand, there are also some significantly different features between the two measurements. First, the film thickness determined by SPR increased monotonically and reached the final value, whereas the frequency shift had a minimum. Second, the fluorescence intensity settled at a finite value after the formation of the planar bilayer, whereas the dissipation returned to zero. Comparison with QCM-D highlights some important features of SPR-SPFS. SPR-SPFS is based on the optical properties of adsorbed material and observes only lipid membranes, whereas the QCM-D responses during vesicle fusion are largely affected by the amount of membrane-bound water molecules (trapped either within vesicles or between the membranes). Fig. 7 shows that the profiles for ΔD and the amount of adsorbed vesicles estimated by SPR-SPFS are similar. This result agrees well with the fact that ΔD arises primarily from the energy dissipation by adsorbed vesicles. On the other hand, both ΔD and Δf continued to increase after the CVC determined by SPR-SPFS. This result suggests that additional vesicles adsorbed onto the surface, which was also observed by SPR-SPFS. The Δf profile differed significantly compared with ΔD and the amount of adsorbed vesicles estimated by SPR-SPFS, especially in the later stage of vesicle fusion. Since Δf senses not only lipid membranes but also trapped water molecules at the surface, the difference in profiles clearly indicates that there was a significant number of bound water molecules on the surface even after the rupture of vesicles.
FIGURE 7.
Kinetic measurements by SPR-SPFS and QCM-D for the vesicle fusion of POPC/POPS (4:1): The dissipation (ΔD) and frequency shift (Δf) measured by QCM-D were plotted versus vesicle incubation time, together with the fluorescence intensity (SPFS: upper frame) and the lipid bilayer thickness (SPR: lower frame), respectively. The estimated amounts of adsorbed vesicle and planar bilayer (same as in Fig. 6) are also given for comparison with the QCM-D data. The arrows with a sign “C” indicate the critical point at which rupture of vesicles started (determined from the plot in Fig. 5).
CONCLUSIONS AND PERSPECTIVES
We demonstrated that simultaneous SPR-SPFS measurements can provide uniquely detailed information on the vesicle fusion process. By plotting the fluorescence intensity measured by SPFS versus the film thickness determined by SPR, we could track the initial adsorption of vesicles, the onset of vesicle rupture occurring at certain vesicle coverage of the surface, and the autocatalytic transformation into planar bilayers. Rather surprisingly, vesicles of varied charges showed very similar initial slopes of fluorescence intensity versus film thickness, indicating that their mean distances from the substrate were not significantly different. On the other hand, the CVC for the onset of vesicle rupture was affected significantly by the lipid charges. These findings suggest that both vesicle-vesicle and vesicle-substrate interactions are playing critical roles for the transformation of vesicles into planar bilayers. The trajectories should represent the course of adsorption and transformation for given lipid composition and substrate material. Further accumulation of data for various lipid compositions and substrate materials should improve our understanding of the mechanism behind the self-assembly process. Some additional experimental conditions such as solution pH and ionic strength should affect the trajectories but others such as lipid concentrations should not. Furthermore, charged lipids (including DiD) may not be distributed symmetrically on some substrates. In such cases we will have to assess the effect of asymmetric distribution on the SPR-SPFS results. These are important points to be verified in the future. SPR-SPFS is based on the optical properties of adsorbed material and observes only lipid membranes, whereas the QCM-D responses during vesicle fusion are largely affected by the amount of membrane-bound water molecules. Therefore, combined application of these mutually complementary techniques should vastly improve our understanding of the self-assembly processes at the interfaces and facilitate the development of membrane-based biochips and sensors.
SUPPLEMENTARY MATERIAL
An online supplement to this article can be found by visiting BJ Online at http://www.biophysj.org.
Acknowledgments
K.T. thanks Prof. Dr. W. Knoll and Mr. A. Scheller of Max Planck Institute for Polymer Research for their help constructing the SPFS setup. We thank Ms. M. Koike of National Institute of Advanced Industrial Science and Technology (AIST) for her assistance in the experiments. We also thank Dr. J. Nishii, Dr. G. Choi, and Dr. T. Mihara of AIST for allowing us to use their sputter machines.
This work was supported in part by Promotion Budget for Science and Technology (AIST Upbringing of Talent in Nanobiotechnology Course), by the Ministry of Education, Science, Culture and Sports, and by Grant-in-Aid for Scientific research from Japan Society for the Promotion of Science.
References
- 1.Brian, A. A., and H. M. McConnell. 1984. Allogeneic stimulation of cytotoxic T cells by supported planar membranes. Proc. Natl. Acad. Sci. USA. 81:6159–6163. [DOI] [PMC free article] [PubMed] [Google Scholar]
- 2.Richter, R. P., R. Berat, and A. R. Brisson. 2006. Formation of solid-supported lipid bilayers: an integrated view. Langmuir. 22:3497–3505. [DOI] [PubMed] [Google Scholar]
- 3.Sackmann, E. 1996. Supported membranes: scientific and practical applications. Science. 271:43–48. [DOI] [PubMed] [Google Scholar]
- 4.Nollert, P., H. Kiefer, and F. Jähnig. 1995. Lipid vesicle adsorption versus formation of planar bilayers on solid surfaces. Biophys. J. 69:1447–1455. [DOI] [PMC free article] [PubMed] [Google Scholar]
- 5.Seifert, U., and R. Lipowsky. 1990. Adhesion of vesicles. Phys. Rev. A. 42:4768–4771. [DOI] [PubMed] [Google Scholar]
- 6.Zhdanov, V. P., C. A. Keller, K. Glasmastar, and B. Kasemo. 2000. Simulation of adsorption kinetics of lipid vesicles. J. Chem. Phys. 112:900–909. [Google Scholar]
- 7.Kalb, E., S. Frey, and L. K. Tamm. 1992. Formation of supported planar bilayers by fusion of vesicles to supported phospholipid monolayers. Biochim. Biophys. Acta. 1103:307–316. [DOI] [PubMed] [Google Scholar]
- 8.Steinem, C., A. Janshoff, W.-P. Ulrich, M. Sieber, and H.-J. Galla. 1996. Impedance analysis of supported lipid bilayer membranes: a scrutiny of different preparation techniques. Biochim. Biophys. Acta. 1279:169–180. [DOI] [PubMed] [Google Scholar]
- 9.Keller, C. A., and B. Kasemo. 1998. Surface specific kinetics of lipid vesicle adsorption measured with a quartz crystal microbalance. Biophys. J. 75:1397–1402. [DOI] [PMC free article] [PubMed] [Google Scholar]
- 10.Reviakine, I., and A. Brisson. 2000. Formation of supported phospholipid bilayers from unilamellar vesicles investigated by atomic force microscopy. Langmuir. 16:1806–1815. [Google Scholar]
- 11.Johnson, J. M., T. Ha, S. Chu, and S. G. Boxer. 2002. Early steps of supported bilayer formation probed by single vesicle fluorescence assays. Biophys. J. 83:3371–3379. [DOI] [PMC free article] [PubMed] [Google Scholar]
- 12.Richter, R., A. Mukhopadhyay, and A. Brisson. 2003. Pathways of lipid vesicle deposition on solid surfaces: a combined QCM-D and AFM study. Biophys. J. 85:3035–3047. [DOI] [PMC free article] [PubMed] [Google Scholar]
- 13.Schönherr, H., J. M. Johnson, P. Lenz, C. W. Frank, and S. G. Boxer. 2004. Vesicle adsorption and lipid bilayer formation on glass studied by atomic force microscopy. Langmuir. 20:11600–11606. [DOI] [PubMed] [Google Scholar]
- 14.Keller, C. A., K. Glasmästar, V. P. Zhdanov, and B. Kasemo. 2000. Formation of supported membranes from vesicles. Phys. Rev. Lett. 84:5443–5446. [DOI] [PubMed] [Google Scholar]
- 15.Reimhult, E., F. Hook, and B. Kasemo. 2002. Vesicle adsorption on SiO2 and TiO2: dependence on vesicle size. J. Chem. Phys. 117:7401–7404. [Google Scholar]
- 16.Richter, R. P., and A. R. Brisson. 2005. Following the formation of supported lipid bilayers on mica: a study combining AFM, QCM-D, and ellipsometry. Biophys. J. 88:3422–3433. [DOI] [PMC free article] [PubMed] [Google Scholar]
- 17.Reimhult, E., C. Larsson, B. Kasemo, and F. Hook. 2004. Simultaneous surface plasmon resonance and quartz crystal microbalance with dissipation monitoring measurements of biomolecular adsorption events involving structural transformations and variations in coupled water. Anal. Chem. 76:7211–7220. [DOI] [PubMed] [Google Scholar]
- 18.Tawa, K., and K. Morigaki. 2005. Substrate-supported phospholipid membranes studied by surface plasmon resonance and surface plasmon fluorescence spectroscopy. Biophys. J. 89:2750–2758. [DOI] [PMC free article] [PubMed] [Google Scholar]
- 19.Liebermann, T., and W. Knoll. 2000. Surface-plasmon field-enhanced fluorescence spectroscopy. Colloids Surf. A. 177:115–130. [Google Scholar]
- 20.Tawa, K., and W. Knoll. 2004. Mismatching base-pair dependence of the kinetics of DNA-DNA hybridization studied by surface plasmon fluorescence spectroscopy. Nucleic Acids Res. 32:2372–2377. [DOI] [PMC free article] [PubMed] [Google Scholar]
- 21.Chance, R. R., A. Prock, and R. Silbey. 1978. Molecular fluorescence and energy transfer near interfaces. Adv. Chem. Phys. 37:1–65. [Google Scholar]
- 22.Liebermann, T., W. Knoll, P. Sluka, and R. Herrmann. 2000. Complement hybridization from solution to surface-attached probe-oligonucleotides observed by surface-plasmon-field-enhanced fluorescence spectroscopy. Colloids Surf. A. 169:337–350. [Google Scholar]
- 23.Huang, C., and T. E. Thompson. 1965. Properties of lipid bilayer membranes separating two aqueous phases: determination of membrane thickness. J. Mol. Biol. 13:183–193. [DOI] [PubMed] [Google Scholar]
- 24.Ma, C., M. P. Srinivasan, A. J. Waring, R. I. Lehrer, M. L. Longo, and P. Stroeve. 2003. Supported lipid bilayers lifted from the substrate by layer-by-layer polyion cushions on self-assembled monolayers. Colloids Surf. B. 28:319–329. [Google Scholar]
- 25.Okazaki, T., K. Morigaki, and T. Taguchi. 2006. Phospholipid vesicle fusion on micropatterned bilayer substrates. Biophys. J. In press. [DOI] [PMC free article] [PubMed]


