Abstract
The mixing behavior of exchangeable, disulfide-based mimics of 1,2-dipalmitoyl-sn-glycero-3-phosphocholine (DPPC) and cholesterol has been examined as a function of temperature in host membranes made from DPPC and cholesterol in the liquid-disordered phase (ld), in the liquid-ordered phase (lo), and in the liquid-disordered/liquid-ordered coexistence region (ld/lo). In the ld region, lipid mixing was found to be temperature insensitive, reflecting close to ideal behavior. In contrast, a significant temperature dependence was observed in the lo phase from 45 to 60°C, when 35 or 40 mol % sterol was present. In this region, sterol-phospholipid association was characterized by ΔHo = −2.06 ± 0.14 kcal/mol of phospholipid and ΔS° = −4.48 ± 0.44 cal/K mol of phospholipid. From 60 to 65°C, the mixing of these lipids was found to be insensitive to temperature, and sterol-phospholipid association was now entropy driven; that is, ΔHo = −0.23 ± 0.38 kcal/mol of phospholipid and ΔS° = +1.68 ± 1.12 cal/K mol of phospholipid. In the liquid-disordered/liquid-ordered coexistence region, changes in lipid mixing reflect changes in the phase composition of the membrane.
INTRODUCTION
The hypothesis that cholesterol associates with high-melting lipids to form liquid-ordered regions in cell membranes and that some of these regions (commonly referred to as “lipid rafts”) have important biological function (as in signal transduction and membrane trafficking) has generated considerable interest in recent years (1,2). This hypothesis has also stimulated efforts aimed at understanding the fundamental nature of cholesterol-phospholipid interactions in model systems (3–6).
A unique approach for studying cholesterol-phospholipid interactions that has recently evolved is based on the use of the nearest-neighbor recognition (NNR) method (7–11). In essence, this method takes molecular-level snapshots of bilayer organization by detecting and quantifying the thermodynamic tendency of exchangeable monomers to become nearest neighbors of one another. Typically, two lipids of interest (A and B) are converted into exchangeable dimers (AA, AB, and BB), which are then allowed to undergo monomer interchange via thiolate-disulfide interchange. These equilibria are then defined by a constant, K, which governs the monomer interchange among AA, BB, and AB (Eqs. 1 and 2). When monomers A and B mix ideally, this is reflected by an equilibrium constant that equals 4.0. When homoassociations are favored, the equilibrium constant is <4.0; favored heteroassociations are indicated by a value that is >4.0.
 |
 |
(1) |
 |
(2) |
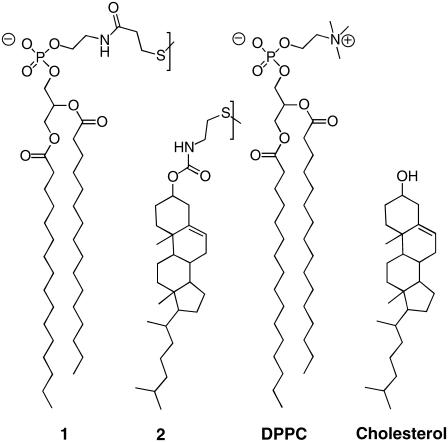
Using the NNR method, we have previously shown that the mixing of 1 with 2 (Scheme 1) in host bilayers derived from 1,2-dipalmitoyl-sn-glycero-3-phosphocholine (DPPC) and cholesterol is controlled by the cholesterol content in the membrane (11). Thus, at low sterol concentrations (<14 mol %), the mixing of these lipids is close to ideal at 60°C. When the sterol concentration is increased from 14 to ∼30 mol %, a strong preference of sterol-phospholipid association emerges. Beyond ∼30 mol %, this preference levels off. We have also noted that this behavior closely matches the transition from the liquid-disordered state (ld, ∼0–14 mol % sterol) where the phospholipids are “coiled” to the liquid-disordered/liquid-ordered coexistence region (ld/lo, ∼14–30 mol % sterol) and finally to the liquid-ordered phase (lo, ∼>30 mol % sterol) where the phospholipids become stretched, according to the phase diagram that has been reported for DPPC/cholesterol mixtures (12).
SCHEME 1.
In the work reported herein, our primary aim was to gain a deeper understanding of sterol-phospholipid interactions by quantifying the underlying thermodynamics. Our motivation for this study was twofold. First, although it has been postulated that cholesterol-phospholipid association is a strongly exothermic process, the thermodynamics of these interactions remains poorly defined (3). For example, monolayer measurements of mixtures of cholesterol and 1,2-dimyristoyl-sn-glycero-3-phosphocholine (DMPC) suggest a heat of association of 9 kcal/mol of phospholipid (13). In contrast, thermodynamic modeling studies suggest that the heat of association for this same pair of lipids lies closer to 2 kcal/mol of phospholipid (14). To our knowledge, no estimates have yet appeared that define ΔSo for cholesterol-phospholipid interactions. Second, we wanted to examine, in a more rigorous way, whether our NNR measurements are in agreement with the phase diagram that has been proposed for DPPC/cholesterol mixtures by varying both the temperature and the sterol content.
MATERIALS AND METHODS
Exchangeable lipids
Procedures that were used to synthesize homodimers {1,1} and {2,2} and the heterodimer {1,2} were similar to those previously described (11).
Nearest-neighbor recognition measurements
In a typical liposome preparation, thin films of DPPC, cholesterol and {1,2} heterodimer or DPPC, cholesterol, {1,1} and {2,2} homodimers were prepared using 17.4 μmol of DPPC, 5.4 μmol of cholesterol, and 0.6 μmol {1,2} heterodimer or 17.4 μmol of DPPC, 5.4 μmol of cholesterol, 0.3 μmol of {1,1}, and 0.3 μmol of {2,2} in chloroform. After drying overnight under reduced pressure, 2.0 ml of 10 mM Tris-HCl buffer (10 mM Tris-HCl, 150 mM NaCl, 2 mM NaN3, 1 mM EDTA, pH = 7.4) were added to the dried film. The mixture was then vortex mixed for 1 min and incubated for 5 min at 60°C, followed by another 1 min of vortex mixing and another 20 min of incubation. The dispersion was then subjected to five freeze/thaw cycles (liquid nitrogen/60°C water bath), followed by sequential extrusion through 400- and 200-nm membranes (10 times for each membrane and a total extrusion time of 10 min). The extrusion pressures that were used for the 400-and 200-nm Nuclepore membranes were <50 and 200 psi, respectively. After extrusion, the dispersion was incubated for ∼30 min at the desired temperature before initiating the thiolate disulfide exchange reaction. Large unilamellar vesicles formed under these conditions were typically 200 nm in diameter (dynamic light scattering). Thiolate-disulfide interchange reactions were initiated after the dispersions were equilibrated at 60°C by injecting 25.5 μL of a Tris-buffer solution of 37.65 mM threo-dithiothreitol (0.96 μmol) and 24 μL of a Tris-buffer solution that was 8.4 μM in monensin (0.204 μmol), with brief vortex mixing, and finally increasing the pH to 8.5 via addition of ∼10 μL of 1.0 M NaOH. All dispersions were maintained under an argon atmosphere throughout the course of the interchange reactions. Aliquots (0.30 mL) were withdrawn as a function of time and quenched by addition to a 5.0-mL test tube containing 85 μL of 30 mM HCl (final pH 5.0), brief (10 s) vortex mixing, and immediate cooling to −20°C. The frozen samples were then lyophilized and the lipid portion dissolved in 2 mL of chloroform with vortex mixing for 30 s, followed by centrifugation (20 min) using a clinical centrifuge. The clear chloroform solution was poured into another test tube, and chloroform was evaporated under reduced pressure [40 min, 0.4 Torr, 23°C]. The resulting clear film was dissolved in a solution made from 10 μL of chloroform plus 90 μL of the mobile phase that was used for high-performance liquid chromatography (HPLC) analysis. Product mixtures were analyzed using a C18 reverse phase HPLC column with a mobile phase that was composed of 10 mM tetrabutylammonium acetate in denatured ethanol/water/hexane (76/13/10, v/v/v) with flow rate of 0.9 mL/min. The column was maintained at 31°C and the components were monitored at 205 nm by a Waters 996-photodiode-array ultraviolet detector (Milford, MA).
RESULTS
Mixing of 1 with 2 in DPPC/cholesterol host bilayers
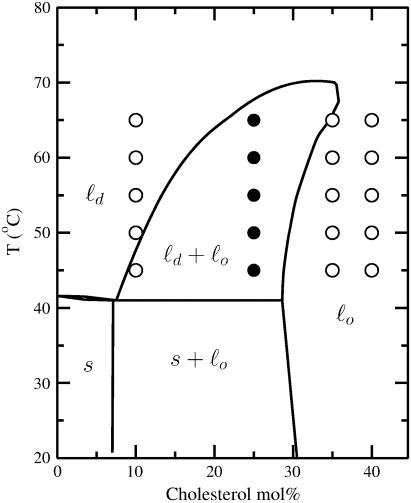
To probe the thermodynamics of sterol-phospholipid interactions, we examined the temperature dependence of the equilibrium constant, K, for the exchange reaction between homodimers and heterodimers derived from 1 and 2 in host bilayers made from DPPC and cholesterol (11). According to the phase diagram for DPPC/cholesterol mixtures, the ld region, the ld/lo coexistence region, and the lo should be readily accessible from 45°C–65°C, using 10, 25, and 35 (or 40) mol % sterol, respectively (Fig. 1) (12). Since the mixing of 1 with 2 has been shown to be similar to the mixing of DPPC with cholesterol, van 't Hoff plots of K in the single-phase regions of the diagram [that is, where ln K = −ΔH°/R (1/T) + ΔS°/R] are expected to yield ΔHo and ΔSo values that are relevant not only to the mixing between 1 and 2, but also to the mixing between DPPC and cholesterol (15).
FIGURE 1.
Phase diagram of DPPC/cholesterol showing: ld, ld/lo coexistence, lo, solid (s), and s/lo coexistence regions (12). The points where NNR measurements were performed are indicated by open symbols (one-phase regions) and solid symbols (two-phase region).
Using standard extrusion methods (200-nm Nuclepore membranes, 60°C), liposomes were prepared from 5 mol % of an equimolar mixture of 1 and 2 plus 95 mol % of DPPC/cholesterol of varying ratios. To ensure that equilibrium product mixtures were obtained, one series of liposomes was made using pure heterodimer {1,2} as the source of these exchangeable lipids, and a second series was prepared from an equimolar mixture of the corresponding homodimers, {1,1} and {2,2}. Thiolate-disulfide interchange reactions were then carried out to promote mixing of the monomers. Experimental procedures that were used were similar to those previously described (11). Values of K were then calculated from the average dimer composition from both sets of experiments, where product mixtures were analyzed at six different time intervals. Thus, 12 different sets of data were used to obtain each value of K.
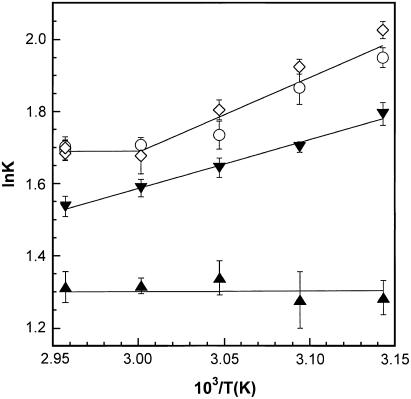
The temperature dependences of K for the four phospholipid/cholesterol compositions that were examined are shown as van 't Hoff plots in Fig. 2. A summary of these data is also shown in Table 1. In the ld phase, where the mixing of 1 with 2 is close to ideal, no significant temperature dependence was detected. In contrast, in the ld/lo coexistence region, the apparent values of K were found to steadily increase with decreasing temperatures. Unexpectedly, bilayers in the lo phase containing 35 or 40 mol % sterol showed more complex behavior. From 60 to 65°C, no significant temperature dependence of K was observed. In contrast, from 45 to 60°C, a significant temperature dependence was found. If one treats these data as two separate regions, the former is characterized by ΔHo = −0.23 ± 0.38 kcal/mol of phospholipid and ΔS° = +1.68 ± 1.12 cal/K mol of phospholipid; the latter corresponds to ΔHo = −2.06 ± 0.14 kcal/mol of phospholipid and ΔS° = −4.48 ± 0.44 cal/K mol of phospholipid. It should be noted that these entropy values include a statistical component, R × ln 4 or 2.75 cal/K mol of lipid dimer, which is due to the fact that the heterodimer is statistically favored over each homodimer by a factor of two.
FIGURE 2.
A van 't Hoff plot of ln K versus 103/T for the association between 1 and 2 in DPPC/cholesterol host membranes containing (▴) 10 mol %, (▾) 25 mol %, (○) 35 mol %, and (⋄) 40 mol % sterol. Note: The data that are shown at 65°C for the 35 and 40 mol % sterol appear as four overlapping points.
TABLE 1.
Value of K as a function of temperature and sterol content
| T (°C) | 10% sterol | 25% sterol | 35% sterol | 40% sterol |
|---|---|---|---|---|
| 45 | 3.6 ± 0.17 | 5.99 ± 0.19 | 7.01 ± 0.19 | 7.56 ± 0.18 |
| 50 | 3.58 ± 0.28 | 5.47 ± 0.08 | 6.45 ± 0.30 | 6.84 ± 0.14 |
| 55 | 3.81 ± 0.18 | 5.17 ± 0.14 | 5.66 ± 0.22 | 6.07 ± 0.17 |
| 60 | 3.73 ± 0.08 | 4.89 ± 0.12 | 5.51 ± 0.07 | 5.35 ± 0.27 |
| 65 | 3.72 ± 0.16 | 4.65 ± 0.13 | 5.49 ± 0.15 | 5.39 ± 0.11 |
| 65 | – | – | 5.44 ± 0.15 | 5.47 ± 0.11 |
The apparent “break” in the van 't Hoff plot at 60°C was confirmed by carrying an additional set of NNR experiments at 65°C, for both the 35 and 40 mol % sterol concentrations (Table 1). For all of these experiments (i.e., eight independent experiments, based on two convergent sets of data in each case), K was equal to ∼5.5. This value is, essentially, the same as that found at 60°C (Table 1 and Fig. 2).
Nearest-neighbor recognition in undiluted bilayers
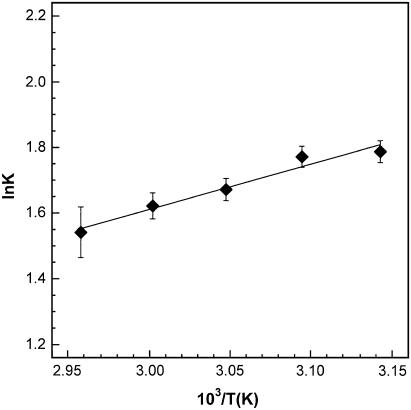
To confirm that the mixing properties of 1 and 2 closely match those of DPPC and cholesterol, we examined the temperature dependence of the mixing of 1 and 2 in bilayers made exclusively from these two exchangeable lipids using 25% of 2 (Fig. 3). As expected, the apparent enthalpy and entropy values (ΔHo = −1.30 ± 0.30 kcal/mol of phospholipid and ΔS° = −2.29 ± 0.92 cal/K mol of phospholipid) were found to be indistinguishable from those measured in DPPC/cholesterol host membranes that contained 25 mol % sterol (ΔHo = −1.27 ± 0.18 kcal/mol of phospholipid and ΔS° = −2.23 ± 0.54 cal/K mol of phospholipid). Thus, these results imply that, at a given temperature, the diluted and undiluted membranes have similar proportions of the ld and lo phase and that the averaged microenvironment surrounding 1 and 2 is also similar.
FIGURE 3.
A van 't Hoff plot of ln K versus 103/T for the association between 1 and 2 in bilayers made from a 3:1 (mol/mol) mixture of 1/2.
DISCUSSION
In bilayers containing 10 mol % sterol, K is ∼3.8, which is close to the value for random mixing (K = 4) and is independent of temperature. This confirms that the mixing between 1 and 2, and therefore the mixing between DPPC and cholesterol, is close to ideal in the ld phase. The change in K as a function of temperature in the ld/lo coexistence region (25 mol % sterol) is due to the effect of temperature on the fractions of the lo and ld phases of the membrane. Phase fractions calculated from our data are in close agreement with those obtained from the phase diagram. Thus, the thermodynamic parameters in this two-phase region are only apparent values. In the lo phase (35 and 40 mol % sterol), at temperatures that lie between 45 and 60°C, a van 't Hoff plot indicates that sterol-phospholipid association is weakly driven by enthalpy with a heat of association that corresponds to ∼2 kcal/mol of phospholipid. This value compares well with the proposed enthalpy of phospholipid-cholesterol complex formation (14).
The fact that K was found to be constant, on going from 60 to 65°C in the lo phase, was unexpected. That this segment of this van 't Hoff plot is not due to “drifting” into the ld/lo coexistence region is evident from the fact that the K values level off at high temperatures. If contributions were being made from the ld phase, then K would be expected to decrease more rapidly with increasing temperatures, which is clearly not the case.
This finding suggests that the phospholipid-cholesterol association, although remaining favorable, has changed from enthalpy driven to entropy driven at ∼60°C. The physical basis for this apparent entropy-enthalpy compensation is not obvious, but we can suggest two possible interpretations. One is that 60°C is close to the critical temperature of the ld-lo coexistence region and that critical fluctuations are dominating the DPPC/cholesterol association that is measured by NNR in the 60–65°C temperature range. Another explanation, based on the concept of condensed complexes, is that 60°C corresponds to thermal dissociation of the complexes. Above this temperature, DPPC/cholesterol is still favored as nearest neighbors, but they no longer form condensed complexes (3,16–20). Although the correctness of these hypotheses remains to be established, these results define the thermodynamic parameters of the molecular interactions between DPPC and cholesterol, with which any realistic model must be consistent.
Finally, to place the driving force for sterol-phospholipid association in the lo phase into clear view, we have calculated the molecular Gibbs free energy of interaction (ΔG°i) between 1 and 2 at various temperatures by subtracting contributions made from the statistical entropy (RT ln4). This free energy corresponds to the difference between an AB interaction and the average of AA and BB interactions; that is,  . As shown in Table 2,
  varies from −104 to −189 cal/mol of phospholipid. These values clearly indicate that the interactions between the phosphocholine and cholesterol are favorable in the lo phase, in contrast to what is observed in the ld phase, where they are neutral (random mixing), and in the gel phase, where they are unfavorable (9).
TABLE 2.
Gibbs free energy of interaction between 1 and 2 in the lo phase
| Temperature (°C) | K* | ΔGo† (cal/mol of phospholipid) |
 ‡ (cal/mol of phospholipid) ‡ (cal/mol of phospholipid) |
|---|---|---|---|
| 65 | 5.45 ± 0.13 | −570 ± 8 | −104 ± 8 |
| 60 | 5.43 ± 0.17 | −561 ± 10 | −101 ± 10 |
| 55 | 5.87 ± 0.20 | −578 ± 11 | −125 ± 11 |
| 50 | 6.65 ± 0.22 | −609 ± 11 | −163 ± 11 |
| 45 | 7.28 ± 0.19 | −628 ± 8 | −189 ± 8 |
K from average values of 35% and 40% sterol at each temperature.
ΔGo = −(1/2) × RT ln K.
 = ΔG° − [−(1/2) × RT ln 4]. Note: the factor of 1/2 in both instances arises because K is defined per dimer.
CONCLUSIONS
NNR measurements, which have been carried out for the mixing of 1 with 2 in host membranes made from DPPC and cholesterol, have yielded insight into the thermodynamics that underlie sterol-phospholipid interactions. In the ld phase, lipid mixing is close to ideal and insensitive to temperature. In the temperature-sensitive region of the lo phase (45–60°C), the mixing of 1 with 2 is characterized by ΔHo = −2.06 ± 0.14 kcal/mol of phospholipid and ΔS° = −4.48 ± 0.44 cal/K mol of phospholipid. Above 60°C, sterol-phospholipid association is converted into an entropy-driven process, where ΔHo = −0.23 ± 0.38 kcal/mol of phospholipid and ΔS° = +1.68 ± 1.12 cal/K mol of phospholipid. Subtraction of contributions made from statistical entropy yield molecular Gibbs free energies of interaction ( ) between 1 and 2 in the lo phase, which vary from −104 cal/mol of phospholipid at 65°C to −189 cal/mol of phospholipid at 45°C.
In a broader context, these findings lend further support for the general features of the phase diagram that has been proposed for DPPC/cholesterol mixtures; they also reveal a region of the lo phase in which a change in the organizational state appears to occur.
SUPPLEMENTARY MATERIAL
An online supplement to this article can be found by visiting BJ Online at http://www.biophysj.org. The supplement contains dimer compositions (27 tables) for the mixing of 1 with 2 in diluted bilayers (PDF).
Acknowledgments
We are grateful to the National Institutes of Health (PHS GM56149) and to the Research Corporation (award CC6246) for support of this research.
References
- 1.Edidin, M. 2003. The state of lipid rafts: from model membranes to cells. Annu. Rev. Biophys. Biomol. Struct. 32:257–283. [DOI] [PubMed] [Google Scholar]
- 2.Simons, K., and W. L. C. Vaz. 2004. Model systems, lipid rafts, and cell membranes. Annu. Rev. Biophys. Biomol. Struct. 33:269–295. [DOI] [PubMed] [Google Scholar]
- 3.McConnell, H. M., and A. Radhakrishnan. 2003. Condensed complexes of cholesterol and phospholipids. Biochim. Biophys. Acta. 1610:159–173. [DOI] [PubMed] [Google Scholar]
- 4.Feingold, L. 1993. Cholesterol in Membrane Models. CRC Press, Boca Raton, FL.
- 5.Vist, M. R., and J. H. Davis. 1990. Phase equilibria of cholesterol/dipalmitoylphosphatidylcholine mixtures: deuterium nuclear magnetic resonance and differential scanning calorimetry. Biochemistry. 29:451–464. [DOI] [PubMed] [Google Scholar]
- 6.Veatch, S. L., and S. L. Keller. 2002. Organization in lipid membranes containing cholesterol. Phys. Rev. Lett. 89:268101/1–268101/4. [DOI] [PubMed] [Google Scholar]
- 7.Sugahara, M., M. Uragami, X. Yan, and S. L. Regen. 2001. The structural role of cholesterol in biological membranes. J. Am. Chem. Soc. 123:7939–7940. [DOI] [PubMed] [Google Scholar]
- 8.Sugahara, M., M. Uragami, and S. L. Regen. 2002. Selective sterol-phospholipid associations in fluid bilayers. J. Am. Chem. Soc. 124:4253–4256. [DOI] [PubMed] [Google Scholar]
- 9.Sugahara, M., M. Uragami, and S. L. Regen. 2003. Selective association of cholesterol with long-chain phospholipids in liquid-ordered bilayers: support for the existence of lipid rafts. J. Am. Chem. Soc. 125:13040–13041. [DOI] [PubMed] [Google Scholar]
- 10.Cao, H., N. Tokutake, and S. L. Regen. 2003. Unraveling the mystery surrounding cholesterol's condensing effect. J. Am. Chem. Soc. 125:16182–16183. [DOI] [PubMed] [Google Scholar]
- 11.Cao, H., J. Zhang, B. Jing, and S. L. Regen. 2005. A chemical sensor for the liquid-ordered phase. J. Am. Chem. Soc. 127:8813–8816. [DOI] [PubMed] [Google Scholar]
- 12.Sankaram, M. B., and T. E. Thompson. 1991. Cholesterol-induced fluid-phase immiscibility in membranes. Proc. Natl. Acad. Sci. USA. 88:8686–8690. [DOI] [PMC free article] [PubMed] [Google Scholar]
- 13.Radhakrishnan, A., and H. M. McConnell. 2002. Thermal dissociation of condensed complexes of cholesterol and phospholipid. J. Phys. Chem. B. 106:4755–4762. [Google Scholar]
- 14.Anderson, T. G., and H. M. McConnell. 2001. Condensed complexes and the calorimetry of cholesterol-phospholipid bilayers. Biophys. J. 81:2774–2785. [DOI] [PMC free article] [PubMed] [Google Scholar]
- 15.Zhang, J., H. Cao, B. Jing, and S. L. Regen. 2006. Ethanol-induced reorganization of the liquid-ordered phase: enhancement of cholesterol-phospholipid association. J. Am. Chem. Soc. 128:265–269. [DOI] [PMC free article] [PubMed] [Google Scholar]
- 16.Finean, J. B. 1953. Phospholipid-cholesterol complex in the structure of myelin. Experientia. 9:17–19. [DOI] [PubMed] [Google Scholar]
- 17.Hinz, H. J., and J. M. Sturtevant. 1972. Calorimetric investigation of the influence of cholesterol on the transition properties of bilayers formed from synthetic L- -lecithins in aqueous suspension. J. Biol. Chem. 247:3697–3700. [PubMed] [Google Scholar]
- 18.Gershfeld, N. L. 1978. Equilibrium studies of lecithin-cholesterol interactions. I. Stoichiometry of lecithin-cholesterol complexes in bulk systems. Biophys. J. 22:469–488. [DOI] [PMC free article] [PubMed] [Google Scholar]
- 19.Needham, D., T. J. McIntosh, and E. Evans. 1988. Thermomechanical and transition properties of dimyristoylphosphatidylcholine/cholesterol bilayers. Biochemistry. 27:4668–4673. [DOI] [PubMed] [Google Scholar]
- 20.Ipsen, J. H., G. Karlstrom, O. G. Mouritsen, H. Wennerstrom, and M. J. Zuckermann. 1987. Phase equilibria in the phosphatidylcholine-cholesterol system. Biochim. Biophys. Acta. 905:162–172. [DOI] [PubMed] [Google Scholar]


