

Abstract
An opsin-encoding cDNA was cloned from the marine alga Acetabularia acetabulum. The cDNA was expressed in Xenopus oocytes into functional Acetabularia rhodopsin (AR) mediating H+ carried outward photocurrents of up to 1.2 μA with an action spectrum maximum at 518 nm (AR518). AR is the first ion-pumping rhodopsin found in a plant organism. Steady-state photocurrents of AR are always positive and rise sigmoidally from negative to positive transmembrane voltages. Numerous kinetic details (amplitudes and time constants), including voltage-dependent recovery of the dark state after light-off, are documented with respect to their sensitivities to light, internal and external pH, and the transmembrane voltage. The results are analyzed by enzyme kinetic formalisms using a simplified version of the known photocycle of bacteriorhodopsin (BR). Blue-light causes a shunt of the photocycle under H+ reuptake from the extracellular side. Similarities and differences of AR with BR are pointed out. This detailed electrophysiological characterization highlights voltage dependencies in catalytic membrane processes of this eukaryotic, H+-pumping rhodopsin and of microbial-type rhodopsins in general.
INTRODUCTION
In 1968, Schilde (1) reported a fast, light-induced response of the transmembrane voltage from the giant unicellular marine alga Acetabularia acetabulum (former A. mediterranea; Fig. 1 A) and suggested rhodopsin to be the responsible photoreceptor, long before any other rhodopsin was found outside the animal kingdom. The observation has been interpreted by an inhibition of a Cl−-importing ATPase (2,3). However, several attempts to isolate this Cl−-ATPase failed because of the wrong substrate (only an H+ ATPase was found (4)) or the wrong genetic code (5), which differs in Acetabularia from normal (6).
FIGURE 1.

Basic relationships. (A) Sketched cells of A. acetabulum in three developmental states, modified from Henry et al. (7). (B) Hypothetical reaction scheme for light-driven H+ export through BR and AR. Due to structural analogies in AR and BR (Fig. 1 B and Supplement-1), we define Di: D-100 in AR and D-96 in BR (H+ donor), Do: D-89 in AR and D-85 in BR (H+ acceptor); Si(o): Schiff base with H+-binding site facing internal (external) bulk phase; protonated and deprotonated states as marked. Hi: cytoplasmic [H+]; HDi: [H+] at entry of reaction cycle; HDo: [H+] at release site from reaction cycle, Ho: lumenal [H+]. (C) Comparison of microbial rhodopsin amino acid sequences in the range of helix 3. The top four eukaryotic sequences are AR (AR DQ074124), ChR1 (Channel rhodopsin-1, AF385748), ChR2 (Channel rhodopsin-2, AF461397) both from Chlamydomonas reinhardtii, NR (Neurospora rhodopsin AF, XM_95432) from Neurospora crassa, LR (Leptosphaeria rhodopsinAF290180) from Leptosphaeria maculans, followed by BR (BR, AAA72504), HR (halorhodopsin, CAB3786), and SRII (sensory rhodopsin II, P42196) all from Halobacterium salinarium. Lettering: green: algae, yellow: fungi, violet: archaea. Amino acids identical in all sequences are underlayed in green, identical in AR and some others are in blue, H+-donor and acceptor groups in yellow and functional substitutes of these in violet. (D) Basic observations of photocurrents from AR expressing Xenopus oocytes, bathed in ND-96 solution pH 7.5, holding voltage 40 mV; top bar: light period; a–c: conditions as marked; green light: peak at 500 nm, J 100%; red light: λ > 600 nm (J > 1023 photons m−2 s−1). (E) Depletion of major ion species in bath has no effect on steady-state photocurrents at +40 mV and 100% green light, except H+.
Recently, Mandoli and co-workers (7) reported a cDNA sequence from juvenile Acetabularia (Fig. 1 A) as a fragment of a tentatively opsin-encoding gene (Acetabulariaopsin, aop). Opsins are membrane-spanning proteins that covalently bind retinal as a chromophoric light-absorbing cofactor thus forming the functional photoreceptor rhodopsin. Three rhodopsin classes can be distinguished according to their electrical properties: i), Electrically neutral rhodopsins operate as visual photoreceptors in animal eyes or sensors for phototaxis in prokaryotes; ii), light-driven ion pumps for H+ and Cl− form a primordial mechanism of photosynthetic energy conversion in archaea and eubacteria (8–11); and iii), channel rhodopsins from phototactic algae mediate light-induced passive conductance of H+ and other cations (12,13).
The best-characterized rhodopsin is the proton-pumping bacteriorhodopsin (BR) from Halobacterium salinarium. A simplified reaction scheme of the H+-pumping process according to Luecke et al. (14) is shown in Fig. 1 B. In this scheme, the retinal Schiff base (S) is represented in two conformations, Si and So, with H+ accessibility either from the internal medium or the external bulk phase, respectively. In darkness, the Schiff base is protonated, and its H+ binding site faces the extracellular bulk phase. The Asp serving as internal H+ donor is protonated, DiH, and the Asp serving as H+ acceptor unprotonated, Do. During the photocycle SoH transfers the H+ to Do. So undergoes a conformational switch to Si and is reprotonated by Di. Then SiH reisomerizes to SoH. All intermediate steps have been characterized by numerous spectroscopic measurements (ultraviolet/Vis, Fourier transform infrared spectroscopy, and resonance Raman spectroscopy), and the three-dimensional structure is known from most photocycle intermediates. However, the photocycle of isolated rhodopsin has never been analyzed in detail at negative membrane voltage, where it operates under natural conditions, and only very little is known about the separate roles of internal and external pH. Previous electrophysiological studies of pumping rhodopsins (15,16) presented rather linear current-voltage relationships, I/E, and the authors applied linear models for the analysis correspondingly. This approach yielded puzzling intersections of the extrapolated I/E relationships with the voltage axis. It also resulted in nonsaturating kinetics colliding with the expected properties of an H+-pumping enzyme.
We cloned a full-length opsin-cDNA from Acetabularia, expressed it in Xenopus oocytes, and studied the properties of the corresponding rhodopsin, Acetabularia rhodopsin (AR), by voltage-clamp techniques. During this study, AR turned out to be a light-driven H+ exporting pump. Most properties of AR are similar to those of BR from H. salinarium (14), but the sensitivities of AR to pH and voltage differ considerably from those reported from BR. The sigmoid I/E relationships described here allow a straightforward enzyme kinetic interpretation of the results.
MATERIALS AND METHODS
Plant material
Axenic cultures of A. acetabulum were obtained according to Schweiger et al. (17) in Müller's medium (18) at 20°C and a light:dark cycle of 14:10 h, 10–12-mm long, about 3-week-old cells were harvested immediately after a dark period of 16 h, weighed and washed with Müller's medium, shock frozen in liquid nitrogen, and stored at −80°C.
RNA isolation
The frozen cells were ground in a mortar with a pestle under liquid nitrogen. The powder was suspended in extraction buffer (100 mM LiCl, 100 mM Tris/HCl, pH 8.0, 10 mM EDTA, 1% β-mercaptoethanol) at a ratio of 1:3 (w/v), followed by an extraction once with phenol-chloroform and once with chloroform. A solution of 8 M LiCl was added to the aqueous phase at a ratio of 1:3 (v/v) and the mixture was stored overnight at 4°C. The precipitate was pelleted (12,000 × g, 10 min) and washed with 2 M LiCl, then with 70% ethanol. The pellet was solved in 0.1% diethylpyrocarbonate-treated, sterilized H2O.
RACE
Total RNA was reverse transcribed using RevertAid H Minus First Strand cDNA Synthesis Kit (MBI-Fermentas, St. Leon-Rot, Germany) with 2 mg of total RNA and 2.5 mM of a (dT)16 primer under the conditions recommended by the manufacturer. Polymerase chain reaction (PCR) was performed on the cDNA with a gene-specific primer (5′CGGATGAGCGTGAAGTTA3′) and the oligo(dT) primer to amplify the 3′-end of the putative Acetabularia opsin (7) that has the Genbank accession No. CF259014. For 5′-RACE, cDNA was generated as described for the 3′-RACE, except that 1 mM of a gene-specific primer (5′GCACGGCAAGCATGATGCAGCCGAC3′) was used instead of oligo(dT) primer. The cDNA was poly dG tailed with terminal nucleotide transferase (MBI-Fermentas), according to the suppliers instructions. PCR was carried out using a poly dG-specific primer (5′T(C)153′) and a nested gene-specific primer (5′CCGTCGACGGTGAATGCGCCGATGATAC3′). The amplicons were sequenced (SEQLAB, Göttingen, Germany).
Generation and cloning of full-length aop
The full-length sequence was amplified in a PCR with two primers derived from the sequences obtained by 3′-RACE (5′AGTCTAGAAAGGATGCTTGCAATATCA3′, introducing an XbaI restriction site) and 5′-RACE (5′ACCTGCAGATCTCACGTTCTGTA3′, introducing a PstI restriction site). The product was cut with XbaI/PstI and ligated into a XbaI/PstI cut pUC19 plasmid (MBI-Fermentas). The sequence of the 1027 bp insert can be found under the Genbank accession no. DQ074124.
Mutagenesis and cloning for heterologous expression
To take differences concerning the genetic code (6) into account, aop was mutagenized through the megaprimer method (19) following the protocol provided by Tyagi et al. (20). The mutagenic primer (5′CGGCCGGAACTGAACAGCGATGGAA3′, antisense) was designed to replace a stop codon (TAA (STOP) changed to CAG (Q)), the first flanking primer (5′CGCGGATCCATGTCAAACCCTAACCCT3′, sense) introduced a BamHI restriction site, and the second flanking primer (5′TTCAAGCTTCCTCGAGCCCCAACTTTTCC3′, antisense) introduced an XhoI restriction site. The first PCR mixture contained 20 nM of the mutagenic primer, 1 nM of the first flanking primer, and 100 ng of pUC19-aop DNA. Before initiation of the second round of PCR, second flanking primer was added to a concentration of 20 nM. PfuUltra Hotstart DNA Polymerase (Stratagene, Amsterdam, The Netherlands) was used instead of Vent Polymerase. Aopmut was cut with BamHI/XhoI and ligated into the polylinker of pSGEM (courtesy of M. Hollmann, Max Planck Institute for Experimental Medicine, Göttingen, Germany).
Heterologous expression in Xenopus oocytes
A full-length cRNA, AR1–279 (aa 1–279), and a truncated version, AR1–235 (aa 1–235), were synthesized in vitro from NsiI-linearized aop-pSGEM plasmid by using T7 RNA polymerase (Riboprobe system T7, Promega, Mannheim, Germany). Because the transport properties of both were qualitatively indistinguishable, most experiments were carried out with AR1–235. Oocytes were prepared from female Xenopus as described previously (21), then single oocytes were injected with 50 nl of water or 50 nl of aop-cRNA (0.5 μg/μl) and incubated in the dark at 19°C in oocyte ringer solution (96 mM NaCl, 2 mM KCl, 1.8 mM CaCl2, 1 mM MgCl2, 5 mM MOPS (3-(N-morpholino)propanesulfonic acid), adjusted to pH 7.5 with NaOH) in the presence of 5 mM Na-pyruvate and 50 μg/ml gentamicin and in the presence of 1 μM all-trans-retinal (SIGMA, Taufkirchen, Germany). Interestingly, retinal addition turned out to be unnecessary. In contrast to BR (16) and channel rhodopsin (12) the affinity of AR for retinal appears so high that complete reconstitution occurs with endogenous retinal. Measurements were performed 3–7 days after injection.
Electrophysiology
Two-electrode voltage clamp was performed to record photocurrent of AR on Xenopus laevis oocytes using a GeneClamp 500 amplifier (Axon Instruments, Union City, CA) and Turbo Tec-03X (NPI Electronic, Tamm, Germany). Data acquisition and light triggering were controlled with pCLAMP 9.0 software via DigiData 1322A interface (Axon Instruments). The temporal resolution of the recording system was ∼1 ms. The data obtained were normally averages of three runs. The microelectrodes were fabricated by pulling borosilicate glass capillaries (1.50 mm o.d. and 1.17 mm i.d.) using a micropipette puller (model P-97, Sutter instrument, Novato, CA) and filled with 3 M KCl. The resistances of microelectrodes were 0.5–1.5 MΩ. A 75-W xenon lamp (Jena-Instruments, Jena, Germany) was used for the source of green (500 nm) or red (600 nm) light. The light was applied to the oocytes by using a 2-mm light guide. Green light at 100% (K50 filter, Balzers Liechtenstein) corresponds to 1.5 × 10²² photons s−1 m−2 at the surface of the oocyte. For the blue-light experiment (405 nm), a CUBE 405 laser system (Coherent, Dieburg, Germany) was employed. Blue light at 100% corresponds to 3.1 × 10²¹ photons s−1 m−2. Lowering of pHi was accomplished by exposure to butarate, following the protocol for pHi changes in Xenopus oocytes (22).
RESULTS
Basic observations
The partial sequence of the opsin-related cDNA already sequenced by Mandoli and co-workers (7) contained the fragment encoding helix 3 (Fig. 1 C). This helix comprises the two aspartates, D-89 and D-100, that in BR function as primary donors, Di, and acceptors, Do, of the Schiff base proton during the photocycle. Since the donor D-100 (D-96 in BR) is conserved in H+-pumping rhodopsins but is absent in anion transporters, sensors, and channel rhodopsins, it was likely that the identified cDNA encodes an H+-transporting protein.
RNA was isolated from juvenile, ∼20-day-old Acetabularia cells. The complete cDNA was isolated and sequenced. The derived 279 amino acid protein comprising seven hypothetical membrane-spanning domains belongs to the microbial-type rhodopsin family with the most striking homology to BR. Within this new AR besides the hypothetical retinal binding Lys, K-218, most amino acids forming the proton transporting hydrogen network in BR are also conserved, namely, Y-60, R-86, Y-87, D-89, D-100, E-206, and D-214 (shown in red in Fig. 1 C and Supplement-1), corresponding in BR to Y-57, R-82, Y-83, D-85, D-96, E-204, and D-212 (14). A-195 and G-196 in AR surprised us since the respective S-193 and E-194 in BR are involved in the extracellular H+ release, although these amino acids are also not conserved in the fungal proton-pumping rhodopsin from Leptosphera (11) either.
RNA encoding either the full-length AR (AR1–279) or a shorter version covering amino acid 1–235 (AR1–235) were prepared and injected into Xenopus oocytes. Between 3 and 7 days after RNA injection, strong green light caused striking outward currents (Fig. 1 Da), whereas red light of similar intensity did not (Fig. 1 Db). Oocytes injected with RNA-free water did not show any light response either (Fig. 1 Dc). This was the first evidence that AR is a green-light-driven transport protein. Since oocytes expressing AR1–235 showed photocurrents with similar kinetics but larger amplitudes than those expressing AR1–279, all further experiments were carried out with AR1–235.
To identify the transported ion species, cations and anions of the medium were exchanged or omitted, i.e., Cl− was exchanged for aspartate, Na+ for N-methyl-D-glucosamine, and Ca2+ was simply left out. In none of these experiments (three per ion species) did the current change significantly (Fig. 1 E), suggesting that none of these ions is transported by AR. However, depletion of extracellular H+ stimulated the photocurrents (pHo 10 in Fig. 1 D).
The light/response relationships of AR (example in Fig. 2 A) show saturation kinetics like ordinary enzymes, which can be linearized by double-reciprocal plots (Fig. 2 B), at least for high light intensities. This evaluation yielded a high half-saturating light intensity especially for pHo 10, indicating a fast photocycle that is enhanced at pH 10. Interestingly, the two linear relationships in Fig. 2 B are parallel. Kinetically this is treated as “uncompetitive inhibition,” which means the inhibitor is binding to the enzyme substrate complex inhibiting substrate release. Stimulation is expected at high pHo for unidirectional H+ export through an acceptor (Do) that is equilibrating rapidly with the external medium (theoretical reasoning in Supplement-2). Deprotonation of DoH is inhibited at low pH.
FIGURE 2.

Light- and pH-sensitivity of steady-state photocurrents. (A) Typical light/response relationship, recorded with 500-nm light at +40 mV, pHo 7.5 (control) and pHo 10. Standard current, IS = 67.7 ± 9.3 nA (n = 8) at pHo 7.5. and 100% J. (B) Same data as in A in double-reciprocal plot. (C) Action spectrum constructed from light/response relationships (reciprocal half-saturation intensities), recorded at different wavelengths. (D) Effect of pHo on steady-state I/E relationships in 100% light; data normalized to standard photocurrent, IS = 61.6 ± 7.8 nA (n = 15) at 0 mV and pHo 7.5. After each measurement, cells were exposed to the reference medium to avoid pHi changes. (E) Effect of pHi on steady-state I/E relationships in 100% light; data normalized to IS as in Fig. 2 D. (F) Same data as in panel E, replotted as log(I/(Imax − I)); linear relationship equivalent to Hill plot in ordinary enzyme kinetics; difference between pHi 6.8 and pHi 7.3: parallel vertical shift by half a log unit per ΔpHi = 0.5; pHi-insensitive slope: ≈0.6 log units (factor 100.6 = 4) per 60 mV.
From light/response curves recorded at different wavelengths, an action spectrum was constructed (Fig. 2 C). It is rhodopsin shaped, peaking at λ = 518 nm, i.e., blue-shifted by ∼30 nm compared to the spectrum for the fast depolarization in Acetabularia (1–3). This discrepancy may be explained by the different molecular environment of AR in native and heterologous membranes.
Sensitivity of steady-state photocurrent to voltage, pHo, and pHi
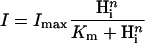
The sensitivity of the photocurrents to the chemical and electrical terms of the proton motive force was studied by measuring the steady-state photocurrents under variation of the membrane voltage, the external pH (pHo), and the internal pH (pHi), The steady-state photocurrents are always positive and rise sigmoidally from small values at very negative voltages to saturation in the positive voltage range. Fig. 2 D shows that varying pHo between 4 and 9 changes the photocurrent very little, especially in the negative voltage range. However, at pHo 10 the current is significantly increased over the whole voltage range, indicating that the rate-limiting proton release group has a pKa > 9. In contrast, changing pHi by only half a unit causes a considerable increase of the currents already in the neutral pH range (Fig. 2 E). Considering AR as an enzyme with internal H+ as substrate we may apply the Hill formalism:
 |
(1) |
or after rearranging
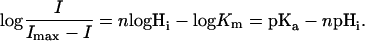 |
(2) |
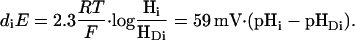
Thus, plotting log(I/(Imax − I)) versus −logHi (i.e., pHi) would result in a straight line with the slope n. For a demonstration of the equivalence of pHi and voltage changes that are sensed by the proton donor group Di, we distinguish the H+ concentration in the cytoplasm, Hi, from the H+ concentration at the donor site, HDi (on a molecular level better described as an H+ occupation probability). Defining diE as the voltage fraction that drops over the internal H+ access channel, IC, we get
 |
(3) |
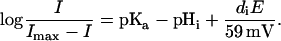
Substituting pHi in Eq. 2 by pHDi = pHi −(diE/59 mV) yields
 |
(4) |
Replotting of the data from Fig. 2 E to Fig. 2 F in this way yields parallel linear relationships with the slope of 0.6 and a vertical distance of ∼0.5 log units, which exactly reflects the different pHi conditions applied. The slope of ∼0.6 log units per 60 mV means that ∼60% of the applied voltage causes apparent changes of pKa of Di, Correspondingly, the pHi 6.8 relationship crosses the E = 0 line at ∼0.4 log units above the origin, yielding the same pKa = pHi + 0.4 = 7.2 for the H+-binding site Di.
Dynamics
Fig. 3 A shows original photocurrent records from one oocyte clamped at different holding voltages Eh between −110 and +70 mV. In general, the temporal response upon rectangular light-on stimulation comprises a transient and a stationary component: upon light-on, there is a fast response, a, that relaxes to the stationary level with the time constant τ1. Since the rise of a is faster than the resolution of our detection system, the recorded peaks are underestimates of the true a. Upon light-off, the current relaxation to zero also has a fast component, b–c, and a slow component, c, with the time constants τ2 and τ3, respectively. The fast one is again not resolved. The voltage sensitivities of the three amplitudes a, b, and c are similar (Fig. 3 B).
FIGURE 3.

Voltage sensitivity of amplitudes and time constants of photocurrents. (A) Four individual current traces recorded at different voltages at pHo 7.5. (B) Amplitudes of a (instantaneous current), b (steady-state current), and c (slowly decaying current component after light-off) plotted versus voltage. Means ± SE from seven cells, normalized to b at 0 mV, and reference pH conditions (pHi 7.3, pHo 7.5); (C) τ1 and τ3 plotted logarithmically versus voltage; note rather constant Q = τ3c ≈ 10 nAs over a wide voltage range, i.e., (in nAs): 6.8 at −70 mV, 8.8 at −40 mV, 11 at −10 mV, 12 at 20 mV, 12 at 50 mV, and 8.9 at 80 mV.
The time constant τ1 is virtually voltage independent, whereas τ3 shows a constant voltage dependence (Fig. 3 C). The more positive the voltage, the faster the current relaxation after light-off. Since the amplitude c also rises with more positive voltages, the integral Q = ∫cdt = cτ3 turns out to be rather constant around 10 nAs over a considerable voltage range.
Detailed light/response relationships
The basic light/response relationship of the steady-state photocurrent b is already presented in Fig. 2, A and B. Now, we focus on the dependence of the individual kinetic phenomena on the light intensity. Fig. 4, A–F, shows examples of photocurrent records upon light pulses of different intensity at two voltages. The general observation is that b saturates faster than a with increasing light. This relationship results in initial current peaks with large amplitudes at higher light intensities. Since the steady-state currents are larger at positive voltage, transient peaks are less pronounced (Fig. 4) in this voltage range, especially at low light.
FIGURE 4.

Intensity sensitivities of the individual dynamic components in AR photocurrents. (A–F) Example records (pHo 7.5) at different light intensities at +70 and −110 mV. (G) Double-reciprocal plots of light/response relationships of photocurrents a and c (defined in panel A) at +70 and −110 mV; for b relations, see Fig. 2 B; note voltage-insensitive J1/2. (H) Time constants τ1 and τ3 versus 1/J, corresponding to double-reciprocal plots of transition probabilities k = 1/τ versus J.
The amplitudes b and c change in parallel to changes in voltage (Fig. 3 B) and/or light (visible in Fig. 4, A–C; b:c ≈ 3) throughout. The half-saturating light intensity (J1/2, determined by the marked intersection of the inverted intensity curve with the abscissa) is not influenced by the voltage (Fig. 4 G) and is larger for a than for c and b, correspondingly. The time constant τ1 describes the decrease of the photocurrent from the initial value to the steady-state level b. This time constant decreases down to 2 ms with increasing light intensities (Fig. 4 H). It reflects the depletion of SoH (AR518). In contrast, τ3 reflects a dark process and thus shows no obvious light dependence (Fig. 4 H).
Double pulse experiments
When two bright light pulses are applied, separated by a short dark interval, the second transient current was smaller than the one evoked by the first pulse, whereas the steady-state level remained constant (Fig. 5, A–D). This refractory behavior was weak at positive (Fig. 5, A and B) and more pronounced at negative voltages (Fig. 5, C and D). The resulting time constants τ4 for recovery of the dark state are derived from the recoveries of the full size transient current at all voltages in Fig. 5 E and listed in the inset. In comparison with τ3, τ4 has about the same voltage sensitivity (approximately twofold faster recovery per +60 mV), but the underlying process is ∼3 times slower throughout.
FIGURE 5.

Kinetic recovery after illumination. (A–D) Example records of exposure to a second light pulse after a reference light pulse (100% intensity) and dark periods of various durations, recorded at +70 mV and −110 mV as marked. (E) Systematic evaluation of experiments like A–D: Exponential recovery (means ± SE, n = 4) of response b–a (s. Fig. 4 A) during dark period with τ4, faster at positive and slower at negative voltage; compare Fig. 3 C, and notice τ4 > τ3. (F) Effect of blue-light (∼1022 photons m−2 s−1, 500 nm, generated by blue-light laser) on standard, green-light induced steady-state photocurrents (100% J, pHo 7.5), at −50 and −110 mV; blue-light-on: fast negative transient followed by continuous reduction of positive steady-state current; blue-light-off: qualitatively symmetric response with fast, positive transient, followed by steady-state level; note: the blue-light response is independent of the voltage.
Probing for the blue-light-absorbing photocycle intermediate
Since it was likely that τ3 reflects the reprotonation of the retinal Schiff base, we probed for a blue-shifted photocycle intermediate by application of blue light pulses of 405 nm on top of strong green light exposure. The results in Fig. 5 F show a short current transient upon blue-light-on, followed by a continuous reduction of the green-light-mediated outward current. Both the fast and the slow response on blue-light always appear negative and voltage independent. The reduction of the steady-state current is ∼30% smaller in pHo 10 compared to pHo 7.5 (data not illustrated), indicating less accumulation of M-intermediates at pHo 10.
DISCUSSION
General aspects
AR is an additional member in the new and short list of BR-like rhodopsins in eukaryotes (10,11), one of the only two known H+-pumping rhodopsins from eukaryotes and the first reported proton-pumping rhodopsin from a photosynthetic eukaryote. It can be excluded that the AR-cDNA (aop) belongs to a contaminating organism since the aop encodes a rhodopsin in Xenopus only after changing the unusual genetic code of Acetabularia (6) into normal. Common features of the photoelectric response in Acetabularia (1–3) and of AR comprise the similar action spectrum, the rapid onset of the light-induced current, the high light intensity for half-saturating response, and the low sensitivity to pHo between pHo 9 and pHo 4. Because of these similarities we might assume that AR is the photoreceptor of the fast photoelectric response in Acetabularia. However, it is puzzling that the fast photoelectric response is an inward current, whereas the green-light-induced currents of AR described here are outward currents throughout. Thus, it would be premature here to speculate about the physiological role of AR in Acetabularia. Possibly, the behavior of the heterologously expressed AR differs from its in vivo function.
Functional comparison with BR
The similar shape of the photocurrents with transient and stationary components and the high half-saturating intensity indicate strong similarities between AR and BR. Significant kinetic differences between AR and BR exist with respect to sensitivity to pHi and pHo. Characteristic of AR is a high sensitivity to pHi (Fig. 2 E) and a low sensitivity to pHo (Fig. 3 D). For BR, a strong, straightforward dependence on the substrate concentration is only reported when Di is mutated into a nonacidic group, D96N (23). In contrast, AR shows no pHi-shielding influence of Di, as shown by the pHi-induced difference of the normalized current I/(Imax − I) by exactly 1 log unit per ΔpHi (Fig. 2 F).
The photocurrents of AR show virtually no pHo sensitivity between pHo 4 and 9, whereas those of BR are ∼10% reduced per pHo unit at 0 mV and pHo < 7.5 (16). This weak pHo sensitivity of both AR and BR is explained by the H+-shielding effect of the H+ pathway (24) between SoH and the external bulk solution. For pHo > 9, only the photocurrents from AR (presented here) are available. They show a significant stimulation at pHo 10 at all voltages (Fig. 2 D). This means, only when the external proton concentration is very low (pHo > pKa ≈ 9) is the Do group rapidly deprotonated after retinal reisomerization from 13-cis to 13-trans (25). This interpretation agrees with the finding that the apparent pKa of the Do group changes from a very low value (∼3) in the all-trans conformation of the ground state to a very high value (∼11) in the 13-cis conformation (14). It might be surprising that the enhancement at pHo > 9 is seen even at negative voltage, when H+ uptake should be rate limiting. This phenomenon is explained by the connectivity model in which all intermediates L, M1, M2, and N are in equilibrium as long as the retinal is in the 13-cis conformation (25).
The steepness of the sigmoid I/E relationship may be expressed by the voltage interval between 10% and 90% saturation. In comparison to BR, where approximate linearity of I/E has been reported between −150 and +50 mV (16), the sigmoid I/E relationships of the photocurrents of AR in this voltage range (e.g., Fig. 2, D and E) indicate that the limiting reaction steps of the reaction cycle of AR sense a larger fraction of the total voltage than in BR.
Number of excited molecules
One striking relationship in the results of Fig. 3 is the rather constant and voltage-independent current integral Q = τ3c ≈ 10 nA s after light-off. These 10 nAs (τ3c) correspond to n = Q/e ≈ 6 × 10⁷ elementary charges, possibly reprotonating Si into SiH (Fig. 3 C). Thus, the number of charges transported after the light-off (at high light intensities) is more or less voltage independent, which is consistent with the voltage insensitivity of the blue light response. Anticipating that 40% of the charge is transported in the slow part of the photocycle, this number corresponds to N = 2.5 × Q/e = 1.5 × 10⁸ AR molecules at 50% J. Accordingly, the total number of functional rhodopsins is ∼3 × 10⁸ molecules in the oocyte membrane.
Rate limitation
The slowest step in the reaction cycle (τ4) reflects the recovery of the full AR sensitivity. It is pHo and voltage sensitive and extremely slow at negative voltage and acidic pHo. Since for the BR photocycle, deprotonation of DoH (Fig. 1 B) is accepted as the slowest reaction at low pHo (O-state to BRD) (26), we assign τ4 to the O-AR518 transition (SoH/DoH-SoH/Do). Thus, at negative voltage the O-intermediate is more populated and not a third M (M′) as suggested previously (16). The decay of O to AR518 is connected only to a small charge movement (27), which restrains it from direct electrical recording. The blue-light-induced negative current peak (Fig. 5 F) is interpreted in the usual way as photoisomerization and reprotonation of accumulated So (M-state) from the extracellular side (separate transition So-SoH), whereas the reduction of the steady-state current is interpreted as a permanent two-photon reaction (green plus blue) (16). The finding that the apparent response to blue light in Fig. 5 C is voltage independent is important. This surprising observation means that the occupancy of the amount of deprotonated Si and So (M-states) is voltage independent and that all rate-limiting, voltage-dependent steps of the photocycle are located downstream of So.
CONCLUSIONS
We draw the following conclusions:
AR is the first reported ion-pumping rhodopsin from a photosynthetic eukaryote.
AR is a light-driven H+ pump similar to BR but with different sensitivities to voltage, pHo, and pHi.
The influence of the transmembrane voltage on the kinetic characteristics of ion-pumping rhodopsins obeys conventional, enzyme kinetic formalisms.
The intracellular H+ donor group has a pKa of 7.2, whereas the extracellular H+ release group resembles a pKa > 9.
In continuous light, M-like and O-like intermediates are accumulated, but only O is further enriched at negative voltage.
Acknowledgments
We thank Dr. Rolf Hagedorn for stimulating discussion.
This work was supported by the Deutsche Forschungsgemeinschaft (P.H.).
Satoshi P. Tsunoda and David Ewers contributed equally to this work.
David Ewers's present address is Abteilung Neurophysiologie, Medizinische Hochschule Hannover, Carl-Neuberg-Strasse 1, 30625 Hannover, Germany.
References
- 1.Schilde, C. 1968. Rapid photoelectric effect in the alga Acetabularia. Z. Naturforsch. B. 23:1369–1376. [PubMed] [Google Scholar]
- 2.Gradmann, D. 1978. Green light (550 nm) inhibits electrogenic Cl− pump in Acetabularia membrane by permeability increase for the carrier ion. J. Membr. Biol. 44:1–24. [Google Scholar]
- 3.Gradmann, D. 1984. Electrogenic chloride pump in the marine alga Acetabularia. In Chloride Transport Coupling in Biological Membranes and Epithelia. G. A. Gerencser, editor. Elsevier Biomedical Press, Amsterdam. 13–61.
- 4.Smahel, M., H. G. Klieber, and D. Gradmann. 1992. Vanadate-sensitive ATPase in the plasmalemma of Acetabularia: biochemical and kinetic characterization. Planta. 188:62–69. [DOI] [PubMed] [Google Scholar]
- 5.Ikeda, M., R. Schmid, and D. Oesterhelt. 1990. A Cl− translocating adenosinetriphosphatase in Acetabularia acetabulum. 1. Purification and characterization of a novel type of adenosinetriphosphatase that differs from chloroplast F1 adenosinetriphosphatase. Biochemistry. 29:2057–2065. [DOI] [PubMed] [Google Scholar]
- 6.Schneider, S. U., M. B. Leible, and X. P. Yang. 1989. Strong homology between the small subunit of ribulose-1,5-bisphosphate carboxylase/oxygenase of two species of Acetabularia and the occurrence of unusual codon usage. Mol. Gen. Genet. 218:445–452. [DOI] [PubMed] [Google Scholar]
- 7.Henry, I. M., M. D. Wilkinson, J. M. Hernandez, Z. Schwarz-Sommer, E. Grotewold, and D. F. Mandoli. 2004. Comparison of ESTs from juvenile and adult phases of the giant unicellular green alga Acetabularia acetabulum. BMC Plant Biol. 4:3–14. [DOI] [PMC free article] [PubMed] [Google Scholar]
- 8.Bieszke, J. A., E. N. Spudich, K. L. Scott, K. A. Borkovich, and J. L. Spudich. 1999. A eukaryotic protein, NOP-1, binds retinal to form an archaeal rhodopsin-like photochemically reactive pigment. Biochemistry. 38:14138–14145. [DOI] [PubMed] [Google Scholar]
- 9.Beja, O., L. Aravind, E. V. Koonin, M. T. Suzuki, A. Hadd, L. P. Nguyen, S. Jovanovich, C. M. Gates, R. A. Feldman, J. L. Spudich, E. N. Spudich, and E. F. DeLong. 2000. Bacterial rhodopsin: evidence for a new type of phototrophy in the sea. Science. 289:1902–1906. [DOI] [PubMed] [Google Scholar]
- 10.Bieszke, J. A., E. L. Braun, L. E. Bean, S. C. Kang, D. O. Natvig, and K. A. Borkovich. 1999. The nop-1 gene of Neurospora crassa encodes a seven transmembrane helix retinal-binding protein homologous to archaeal rhodopsins. Proc. Natl. Acad. Sci. USA. 96:8034–8039. [DOI] [PMC free article] [PubMed] [Google Scholar]
- 11.Waschuk, S. A., A. G. Bezerra, L. Shi, and L. S. Brown. 2005. Leptosphaeria rhodopsin: bacteriorhodopsin-like proton pump from a eukaryote. Proc. Natl. Acad. Sci. USA. 102:6879–6883. [DOI] [PMC free article] [PubMed] [Google Scholar]
- 12.Nagel, G., D. Ollig, M. Fuhrmann, S. Kateriya, A. M. Mustl, E. Bamberg, and P. Hegemann. 2002. Channelrhodopsin-1: a light-gated proton channel in green algae. Science. 296:2395–2398. [DOI] [PubMed] [Google Scholar]
- 13.Nagel, G., T. Szellas, W. Huhn, S. Kateriya, N. Adeishvili, P. Berthold, D. Ollig, P. Hegemann, and E. Bamberg. 2003. Channelrhodopsin-2, a directly light-gated cation-selective membrane channel. Proc. Natl. Acad. Sci. USA. 100:13940–13945. [DOI] [PMC free article] [PubMed] [Google Scholar]
- 14.Luecke, H., B. Schobert, H. T. Richter, J. P. Cartailler, and J. K. Lanyi. 1999. Structural changes in bacteriorhodopsin during ion transport at 2 angstrom resolution. Science. 286:255–260. [DOI] [PubMed] [Google Scholar]
- 15.Friedrich, T., S. Geibel, R. Kalmbach, I. Chizhov, K. Ataka, J. Heberle, M. Engelhard, and E. Bamberg. 2002. Proteorhodopsin is a light-driven proton pump with variable vectoriality. J. Mol. Biol. 321:821–838. [DOI] [PubMed] [Google Scholar]
- 16.Geibel, S., T. Friedrich, P. Ormos, P. G. Wood, G. Nagel, and E. Bamberg. 2001. The voltage-dependent proton pumping in bacteriorhodopsin is characterized by optoelectric behavior. Biophys. J. 81:2059–2068. [DOI] [PMC free article] [PubMed] [Google Scholar]
- 17.Schweiger, H. G., P. Dehm, and S. Berger. 1977. Culture conditions for Acetabularia. In Progress in Acetabularia Research. C. L. F. Woodcock, editor. Academic Press, New !York. 319–330.
- 18.Müller, D. 1962. On year and lunar periodicity phenomenon in several brown algae. Bot. Mar. 4:140–155. [Google Scholar]
- 19.Kammann, M., J. Laufs, J. Schell, and B. Gronenborn. 1989. Rapid insertional mutagenesis of DNA by polymerase chain reaction (PCR). Nucleic Acids Res. 17:5404–5404. [DOI] [PMC free article] [PubMed] [Google Scholar]
- 20.Tyagi, R., R. Lai, and R. G. Duggleby. 2004. A new approach to ‘megaprimer’ polymerase chain reaction mutagenesis without an intermediate gel purification step. BMC Biotechnol. 4:2. [DOI] [PMC free article] [PubMed] [Google Scholar]
- 21.Grygorczyk, R., P. Hankebaier, W. Schwarz, and H. Passow. 1989. Measurement of erythroid band 3 protein-mediated anion transport in mRNA-injected oocytes of Xenopus laevis. Methods Enzymol. 173:453–466. [DOI] [PubMed] [Google Scholar]
- 22.Stewart, A. K., M. N. Chernova, Y. Z. Kunes, and S. L. Alper. 2001. Regulation of AE2 anion exchanger by intracellular pH: critical regions of the NH(2)-terminal cytoplasmic domain. Am. J. Physiol. Cell Physiol. 281:C1344–C1354. [DOI] [PubMed] [Google Scholar]
- 23.Gergely, C., C. Ganea, G. Groma, and G. Varo. 1993. Study of the photocycle and charge motions of the bacteriorhodopsin mutant D96N. Biophys. J. 65:2478–2483. [DOI] [PMC free article] [PubMed] [Google Scholar]
- 24.Garczarek, F., L. S. Brown, J. K. Lanyi, and K. Gerwert. 2005. Proton binding within a membrane protein by a protonated water cluster. Proc. Natl. Acad. Sci. USA. 102:3633–3638. [DOI] [PMC free article] [PubMed] [Google Scholar]
- 25.Brown, L. S., A. K. Dioumaev, R. Needleman, and J. K. Lanyi. 1998. Connectivity of the retinal Schiff base to Asp85 and Asp96 during the bacteriorhodopsin photocycle: the local-access model. Biophys. J. 75:1455–1465. [DOI] [PMC free article] [PubMed] [Google Scholar]
- 26.Richter, H. T., R. Needleman, H. Kandori, A. Maeda, and J. K. Lanyi. 1996. Relationship of retinal configuration and internal proton transfer at the end of the bacteriorhodopsin photocycle. Biochemistry. 35:15461–15466. [DOI] [PubMed] [Google Scholar]
- 27.Tóth-Boconádi, R., L. Keszthelyi, and W. Stoeckenius. 2003. Photoexcitation of the O-intermediate in bacteriorhodopsin mutant L93A. Biophys. J. 84:3848–3856. [DOI] [PMC free article] [PubMed] [Google Scholar]