Abstract
Studies in human systemic lupus erythematosus (SLE) suggest a possible role for histone deacetylases (HDACs) in skewed gene expression and disease pathogenesis. We used the MRL-lpr/lpr murine model of lupus to demonstrate that HDACs play a key role in the heightened levels of both Th1 and Th2 cytokine expression that contribute to disease. The availability of specific HDAC inhibitors (HDIs) such as trichostatin A (TSA) and suberonylanilide hydroxamic acid (SAHA) permits the study of the role of HDACs in gene regulation. Our results indicate that HDIs downregulate IL-12, IFN-γ, IL-6, and IL-10 mRNA and protein levels in MRL-lpr/lpr splenocytes. This effect on gene transcription is associated with an increased accumulation of acetylated histones H3 and H4 in total cellular chromatin. To elucidate the in vivo effects of TSA on lupuslike disease, we treated MRL-lpr/lpr mice with TSA (0.5 mg/kg/d) for 5 weeks. Compared with vehicle-treated control mice, TSA-treated mice exhibited a significant reduction in proteinuria, glomerulonephritis, and spleen weight. Taken together, these findings suggest that increased expression of HDACs leading to an altered state of histone acetylation may be of pathologic significance in MRL-lpr/lpr mice. In addition, TSA or other HDIs may have therapeutic benefit in the treatment of SLE.
Introduction
Systemic lupus erythematosus (SLE) is an autoimmune disease of indeterminate etiology, characterized by episodic flares that are often associated with relentless disease progression, substantial morbidity, and increased mortality (1). Murine models of lupus, including the MRL-lpr/lpr mouse, have proven invaluable in analyses of the pathogenesis of SLE (2). MRL-lpr/lpr mice exhibit (a) onset of an accelerated autoimmune syndrome with polyclonal B cell activation and hypergammaglobulinemia beginning at about 8 weeks of age; (b) serologic evidence of a panoply of autoantibodies, including anti–double-stranded DNA (anti-dsDNA) autoantibodies and hypocomplementemia by 12–16 weeks of age; and (c) clinical signs of arthritis, massive lymphadenopathy, splenomegaly, vasculitis, and glomerulonephritis (GN) by the age of 16–24 weeks. Fifty percent of MRL-lpr/lpr mice die by 24 weeks of age, primarily from renal failure (2).
Although the etiology of SLE is unknown, a number of key mediators of disease have been identified. Cytokines produced by Th1 and Th2 lymphocytes play a major role in the immunopathogenesis of human and murine SLE (3). Studies of cytokine mRNA and protein in MRL-lpr/lpr mice with established disease have documented that splenic Th1 and Th2 subsets are constitutively activated (4). These T cells produce heightened levels of specific cytokines that contribute directly to the aberrant immune response that ultimately leads to dysregulated autoantibody production (3, 4).
IFN-γ is a Th1 cytokine that enhances production of IgG2a and IgG3; moreover, this cytokine accelerates GN in both NZB/W F1 and MRL-lpr/lpr murine models of SLE. In vivo administration of IFN-γ accelerates the disease process, whereas treatment with monoclonal anti–IFN-γ antibody or soluble IFN-γ receptor significantly delays the disease in NZB/W F1 mice and, to a lesser extent, in MRL-lpr/lpr mice (5, 6). IL-12 is also a Th1 cytokine that promotes differentiation of Th1 CD4+ cells. Administration of IL-12 accelerates GN by promoting intrarenal accumulation of IFN-γ–secreting CD4+, CD8+, and double-negative T cells and increased production of nitric oxide. Administration of recombinant IL-12 (rIL-12) to younger MRL-lpr/lpr mice also accelerates GN, whereas monoclonal anti–IL-12 Ab inhibits production of anti-dsDNA autoantibody in NZB/W F1 mice (5, 6). IL-6 is a Th2 B cell stimulatory cytokine that induces autoAb production. Increased IL-6 secretion has been associated with the clinical expression of both renal and CNS lupus (3). Lastly, IL-10 is a potent Th2 growth and differentiation factor for activated B cells, whose production is increased in murine models of SLE (5, 6). In vivo administration of rIL-10 accelerates autoimmunity, whereas monoclonal anti–IL-10 Ab delays the onset of anti-dsDNA autoantibody production, GN, and proteinuria and decreases mortality in NZB/W F1 mice (5, 6).
The initiating mechanism for heightened cytokine production in SLE remains unknown. One potential mechanism may be an alteration in gene transcription. Chromatin remodeling following histone acetylation or deacetylation appears to play a central role in the regulation of gene expression. Acetylation of core nucleosomal histones is a posttranslational modification mediated by opposing activities of histone acetyltransferases (HATs) and histone deacetylases (HDACs). Lysine ε–amino groups of histones H3 and H4 are acetylated more than H2A and H2B by HATs (7). In contrast, HDACs catalyze the removal of acetyl groups. HDAC inhibitors (HDIs) modify gene expression positively or negatively in a cell- and gene-specific manner (8). HDIs increase the accumulation of acetylated histones H3 and H4, directly influencing chromatin structure and, thereby, the relationship of the nucleosome to gene promoter elements (9). However, regulation of gene transcription via histone acetylation is estimated to occur in only 1–5% of genes (10).
Trichostatin A (TSA) is a specific, reversible inhibitor of HDACs in vitro and in vivo that is active at low nanomolar concentrations (11). This agent and a structurally related compound, suberoylanilide hydroxamic acid (SAHA) (12), were used effectively and without overt toxicity in mouse models of cancer (13–15). We previously demonstrated that TSA significantly downregulated CD154 (CD40-ligand) and IL-10 mRNA and protein expression while simultaneously upregulating IFN-γ mRNA and protein expression in human SLE T cells (16). Recently, other investigators have shown that HDIs inhibited LPS-induced TNF-α, IL-1β, IL-12, and IFN-γ in human PBMCs and T cell receptor–ζ chain in T cells with no effect on LPS-stimulated synthesis of IL-1β precursor, IL-1Ra, or IL-8 (17, 18).
To investigate further the role of histone acetylation in disease pathogenesis and the potential of HDIs as therapeutic agents in SLE, we assessed the effect of TSA on Th1 and Th2 cytokine production by MRL-lpr/lpr splenocytes in vitro. TSA significantly downregulated production of both Th1 and Th2 cytokines by MRL-lpr/lpr splenocytes in vitro. We subsequently treated MRL-lpr/lpr mice with TSA to determine the in vivo effects of HDIs on SLE disease progression. There was a significant amelioration of clinical signs of disease, particularly GN in MRL-lpr/lpr mice treated with HDIs compared with controls.
Methods
Animals.
Eight-week-old female MRL-lpr/lpr mice were purchased from The Jackson Laboratory (Bar Harbor, Maine, USA), housed under specific pathogen–free conditions at the Ralph H. Johnson Veterans Affairs Medical Center animal facility, and provided with autoclaved food and sterile water ad libitum. Mice were randomly tested, and documented to be serologically negative for common murine pathogens.
Reagents.
The following reagents were purchased from these vendors: TSA (BIOMOL Research Laboratories, Plymouth Meeting, Pennsylvania, USA); SAHA (Calbiochem-Novabiochem Corp., La Jolla, California, USA); recombinant IFN-γ (rIFN-γ) (PharMingen, San Diego, California, USA); concanavalin A (ConA) and LPS (Salmonella enteritidis) (Sigma-Aldrich, St. Louis, Missouri, USA); FCS and RPMI (GIBCO BRL; Life Technologies Inc., Gaithersburg, Maryland, USA); penicillin and streptomycin (Life Technologies Inc., Grand Island, New York, USA); and anti–acetylated histone H4 and H3 polyclonal Ab’s (Upstate Biotechnology Inc., Lake Placid, New York, USA).
Splenocyte isolation.
Spleens were isolated from MRL-lpr/lpr mice at 10 weeks of age (before disease) and 24 weeks of age (active disease). Mice were anesthetized with methoxyflurane (Metafane; Pitman-Moore, Mundelein, Illinois), and sacrificed by cervical dislocation. Spleens were surgically removed, and kept on ice in sterile DMEM supplemented with 1% FCS. Bulk cultures were established at 5 × 10⁶/ml in RPMI-1640 supplemented with 10% FCS, 2 mM L-glutamine, 100 U/ml penicillin, 100 μg/ml streptomycin, and 5 × 10⁻⁵ M 2-mercaptoethanol.
Cell activation and TSA and SAHA treatment.
Splenocytes (2 × 10⁵ per well) were cultured in 200 μl of culture medium in 96-well plates at 37°C and 5% CO2 for up to 72 hours. To stimulate IFN-γ production, 10 μg/ml ConA was used. For IL-10 secretion, 10 μg/ml ConA and 100 ng/ml LPS alone or in combination with 100 U/ml rIFN-γ were used. For IL-12 and IL-6, LPS and rIFN-γ were used at the above concentrations. Cell culture supernatants were harvested at 24 and 72 hours for cytokine measurement. Experimental concentrations and incubation times for TSA and SAHA were based on previous reports of effective concentrations of TSA and SAHA in in vitro experiments in murine systems. Where indicated, cells were treated with different concentrations of TSA or SAHA for 18 hours before activation. In some experiments, TSA or SAHA was added at the same time as the immune activator.
Trypan blue exclusion method.
Splenocytes were cultured for 24 hours in a six-well culture dish at a density of 2 × 10⁶ per well in 1 ml medium with varying concentrations of TSA and SAHA. The cells were stained with trypan blue, and the viable noncolored and nonviable blue-colored cells were counted using a hemocytometer.
3-[4,5-dimethylthiazol-2-y]-2,5-diphenyltetrasodium bromide tetrazolium assay.
To further assess cell viability, the 3-[4,5-dimethylthiazol-2-y]-2,5-diphenyltetrasodium bromide tetrazolium assay was performed as previously described (19). Briefly, splenocytes were cultured in 96-well plates in triplicate at a density of 2.5 × 10⁵ cells per well in 250 μl of the culture medium for 24 hours with DMSO and different concentrations of TSA and SAHA. The 96-well culture plate was centrifuged, and supernatants were discarded. Fifty microliters of MTT (Sigma-Aldrich; 5 mg/ml in PBS) was added to each well. After incubation at 37°C in 5% CO2 for 4 hours, the plate was centrifuged and untransformed MTT was carefully discarded. Cells were lysed with 100 μl of lysis buffer (55% N′N-dimethylformamide, 20% SDS, pH 4.7) for 4 hours at 37°C. The plate was read on a microplate reader using 550- and 600-nm wavelengths.
Cell cycle analysis.
Cell cycle distribution was assayed according to the method of Nusse et al. (20). In brief, splenocytes were harvested, resuspended in staining solution containing propidium iodide (0.01 mg/ml), sodium citrate (0.1%), NP40 (0.03%), and RNase (10 μg/ml), and analyzed by flow cytometry.
Isolation of RNA and semiquantitative RT-PCR.
Splenocytes were preincubated with TSA or SAHA for 18 hours and then stimulated either with ConA for 18 hours to induce IFN-γ mRNA, or with both LPS and rIFN-γ for 6 and 18 hours to induce IL-12p40, IL-12p35, IL-6, and IL-10 mRNA. Total RNA from untreated and TSA-treated cells was isolated using TRIzol reagent (Life Technologies Inc., Grand Island, New York, USA). Two micrograms of total RNA was converted to cDNA by standard methods using reverse transcriptase (Life Technologies Inc., Gaithersburg, Maryland, USA) and random primers (Promega Corp., Madison, Wisconsin, USA).
Five microliters of cDNA was amplified by semiquantitative PCR using the following specific primers: GAPDH: sense, CTGGTGCTGAGTATGTCGTG; antisense, CAGTCTTCTGAGTGGCAGTG; IFN-γ: sense, CCTCAGACTCTTTGAAGTCT; antisense, CAGCGACTCCTTTTCCTCTT; IL-12p35: sense, ACCTGCTGAAGACCACAGAT; antisense, GATTCTGAAGTGCTGCGTTG; IL-12p40: sense, CTCACCTGTGACACGCCTGA; antisense, CAGGACACTGAATACTTCTC; IL-6: sense, CAGAAAGCCAGAGTCCTTCAGAGAG; antisense, CTAGGTTTGCCGACTAGATCC; IL-10: sense, CTGAGGCGCTGTCATCGATT; antisense, AGGTCCTGGAGTCCAGCAGA. The reaction mixtures were subjected to 35 cycles of denaturation (94°C, 30 seconds) and annealing for 30 minutes at 58°C (GAPDH, IFN-γ, IL-12p35, and IL-12p40), 55°C (IL-10), or 50°C (IL-6). Extension was for 1 minute at 72°C; a final extension of 7 minutes at 72°C was performed using a DNA thermal cycler (Perkin-Elmer Gene Amp 2400 thermocycler; Perkin-Elmer, Norwalk, Connecticut, USA). PCR amplifications were carried out in duplicate. PCR conditions and cycle number were defined for each cytokine primer pair such that a linear relationship between input RNA and final PCR product was obtained, as defined via the OD signal. Positive and negative controls were included in each assay to establish that only cDNA PCR products were detected and that none of the reagents was contaminated with cDNA or extraneous PCR products. PCR products were separated by 2% agarose gel electrophoresis, and band intensities were quantified using an Alpha Imager 2000 (Alpha Innotech Corp., San Leandro, California, USA). Independent amplification of the control gene, GAPDH, was used to correct for differences in efficiency of RNA isolation and reverse transcription. The final normalized results were calculated by dividing the relative transcript levels of the test genes by the relative amounts of GAPDH transcripts (16).
Cytokine ELISA.
IFN-γ, IL-12p40, IL-6, and IL-10 in supernatants were quantified by ELISA according to the manufacturer’s instructions (R&D Systems Inc., Minneapolis, Minnesota, USA).
Histone isolation and immunoblotting.
For histone preparation, splenocytes (1 × 10⁶ per ml) were cultured with TSA or SAHA for 18 hours, harvested, and thoroughly washed with cold PBS. Histones were isolated as described previously (11). Briefly, cells were pelleted, and resuspended in 1 ml ice-cold lysis buffer (10 mM Tris·HCl [pH 6.5], 50 mM sodium bisulfite, 1% Triton X-100, 10 mM MgCl2, 8.6% sucrose). Nuclei were isolated by centrifugation at 40 × g for 5 minutes, washed twice with 1 ml of lysis buffer, and subsequently washed with 1 ml of Tris·EDTA solution (10 mM Tris·HCl [pH 7.4], 13 mM EDTA). Nuclei were then pelleted and resuspended in 100 μl of ice-cold water. Samples were acidified with 0.2 M sulfuric acid (final concentration), vortexed thoroughly, and incubated on ice for 1 hour. Thereafter, samples were centrifuged at 15,000 g for 10 minutes at 4°C, and the protein in the supernatants was precipitated with 1 ml of acetone overnight at 20°C. Precipitated protein was collected by centrifugation at 15,000 g for 10 minutes at 4°C, air-dried, and resuspended in 50–100 μl of water (21). Protein concentrations were quantified by the Bio-Rad Protein Assay kit (Bio-Rad Laboratories Inc., Hercules, California, USA) using BSA as the standard. Proteins (5 μg of each) were denatured at 100°C in loading buffer for 10 minutes, and electrophoresed in 15% polyacrylamide gels. After electrophoresis, samples were transferred onto Immobilon, as previously described (22). Buffer was replaced with PBS and 1% BSA containing 1:1,000 polyclonal rabbit anti–acetylated histone H3 or H4 Ab’s for 16 hours at 4°C. Immunoblots were washed in distilled water and then incubated in PBS containing 1% BSA and a 1:5,000 dilution of goat anti-rabbit HRP for 2 hours at room temperature. Blots were washed in distilled water, rinsed, and soaked in ECL chemiluminescent detection system (Amersham Life Sciences, Little Chalfont, United Kingdom) for 1 minute. Membranes were exposed to Kodak BioMax film for 1–5 minutes (Kodak Imaging Systems, Rochester, New York, USA). Differences in band density on autoradiograms were quantified using the IS-1000 Digital Imaging System (Alpha Innotech Corp.).
In vivo treatment.
Fourteen-week-old female MRL-lpr/lpr mice (n = 10) were treated with subcutaneous injections of TSA 0.5 mg/kg body weight in 40 μl of DMSO daily for 5 weeks. The dose of TSA was based on published results demonstrating a significant inhibition of tumor progression in mice (14). Control MRL-lpr/lpr mice (n = 10) were injected with 40 μl of DMSO alone. There were no differences between TSA-treated and vehicle-treated mice in age, weight, or food and water consumption.
Urine-protein excretion.
Mice were placed in metabolic cages for 24-hour urine collections. Urinary albumin excretion was determined by ELISA using a standard curve of known concentrations of mouse albumin (Cappel Research Products, Durham, North Carolina, USA) as previously described (23).
Measurement of autoantibodies.
Anti-dsDNA autoantibody levels were quantified by ELISA as preciously described (24). Briefly, dsDNA was obtained by S1 nuclease (Sigma-Aldrich) treatment of phenol-extracted calf thymus DNA. Ninety-six-well ELISA plates were then coated with 5 μg/ml double-stranded calf thymus DNA, and incubated at 37°C overnight. The plates were then washed with PBS containing 0.05% Tween (PBS-T). Sera were added to each well in serial dilutions starting at 1:100 dilution, and incubated for 45 minutes at room temperature. After washing with PBS-T, HRP-conjugated goat anti-mouse IgG (γ chain–specific; Sigma-Aldrich) was added and incubated for 45 minutes. After thorough washing, 0.1 M citrate buffer (pH 4) containing 0.015% H2O2 and 3,3′5,5′-tetramethylbenzidine (TMB; Sigma-Aldrich) was added. Results are denoted as the OD380 at 1:100 serum dilution. Anti–glomerular basement membrane (anti-GBM) Ab was measured by ELISA as previously detailed (23).
Measurement of total IgG and IgG isotype.
Total IgG levels in sera were determined by ELISA using a standard curve of known concentrations of mouse IgG. ELISA plates were coated with 1 μg/ml goat anti-mouse Ig (κ chain–specific; Southern Biotechnology Associates, Birmingham, Alabama, USA) overnight at 4°C. After washing with PBS-T, sera were added in serial dilutions starting at a 1:1,000 dilution and incubated for 45 minutes at room temperature. Color development was measured using an HRP-conjugated goat anti-mouse IgG (γ chain–specific; Sigma-Aldrich) and a TMB substrate. The same method was used for measurement of serum IgG isotype levels and total Ig in sera, except that HRP-conjugated goat anti-mouse IgG1, IgG2a, IgG2b, or IgG3 was used (Southern Biotechnology Associates).
Pathology.
Mice were sacrificed by cervical dislocation after isoflurane anesthesia, and the kidneys were removed. One kidney was fixed with buffered formalin, embedded in paraffin, sectioned, and stained with H&E. The slides were read and interpreted by a renal immunopathologist (P. Ruiz) without prior knowledge of the treatment modality. Renal pathology was graded by standard methods for glomerular inflammation, proliferation, crescent formation, and necrosis. Interstitial changes and vasculitis were also noted. Scores from 0 to 3 were assigned for each of the features, and then added together to yield a final renal score (25). Scores for necrosis and crescent formation were doubled prior to adding. For example, glomerular inflammation was graded as follows: 0, normal; 1, few inflammatory cells; 2, moderate inflammation; and 3, severe inflammation.
Immunofluorescence staining.
The other kidney was snap-frozen, cut into 4-μm-thick sections, and stained with FITC-conjugated rabbit anti-mouse IgG, IgG1, IgG2a, and IgG3 (Sigma-Aldrich) and sheep anti-mouse C3 (Sigma-Aldrich). The deposition of IgG and C3 in frozen sections was graded 0–3+ (26).
Confocal microscopy.
Frozen sections of splenic tissue from MRL-lpr/lpr mice were cut into 4-μm sections and stained with FITC-conjugated anti-CD4 or anti-CD8 and then double-stained with rhodamine-conjugated anti-CD3. Additional sections were stained with rhodamine anti-CD3 and FITC anti-B220. Microscopic images were acquired with an Olympus microscope workstation (Olympus America Inc., Melville, New York, USA) equipped with a laser-scanning confocal unit (Olympus America Inc.), 15-mW krypton and argon lasers, and an X63 Plan Apochromat/1.4 NA or X40 Plan Neofluar /1.3 NA oil-immersion objective (Olympus America Inc.). FITC was excited using the 488-nm argon laser emission line and collected using a standard-fluorescence isothiocyanate filter set (525 ± 50 nm). Rhodamine with Con A was excited at 568 nm with the krypton laser, and images were collected with a 600 ± 45–nm filter.
For image analysis, the images (originally 8 bits per pixel) were binarized with a threshold intensity of positivity of 50% of the dynamic range of the whole image. Images were acquired from three different high-powered fields for each spleen (n = 4) from treated and untreated mice. Images were analyzed using the proprietary software of the microscope workstation (ULTRAVIEW; Olympus America Inc.). Analysis for CD3+B220+ cells was accomplished using colocalization of rhodamine and FITC. Cells double-staining with these two markers were considered to be the CD4–CD8–CD3+ T cells characteristically increased in MRL-lpr/lpr mice.
Statistical analysis.
Statistical significance (P ≤ 0.05) was calculated by paired Student’s t test, Mann-Whitney U rank-sum test, or ANOVA (SigmaStat; Jandel Corp., Corte Madera, California, USA). Mean values (± SEM) are used throughout the text.
Results
TSA and SAHA decrease expression of IFN-γ mRNA and protein.
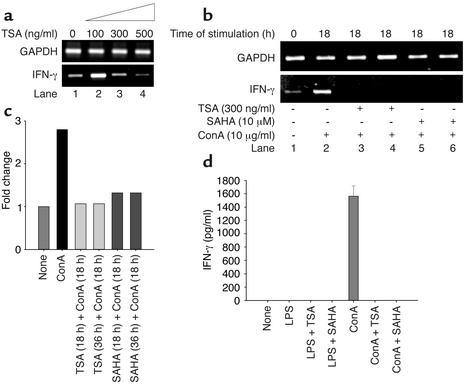
Splenocytes from diseased (24-week-old) MRL-lpr/lpr mice spontaneously express high concentrations of specific cytokines, including IFN-γ, IL-12, IL-6, and IL-10, compared with younger (10-week-old) mice (27). For this reason, splenocytes derived from mice at 24 weeks were used for concentration-response analysis of unstimulated cells. To determine whether TSA can downregulate spontaneously produced IFN-γ mRNA, splenocytes from diseased (24-week-old) MRL-lpr/lpr mice were treated with 0–500 ng/ml of TSA over 18 hours. The 18-hour time interval was selected based on our recent data demonstrating optimal downregulation of CD154 and IL-10 transcripts in human SLE T cells by TSA at 18 hours (16). TSA at low concentrations (100 ng/ml) had little effect or even possibly increased IFN-γ mRNA levels as measured by semiquantitative RT-PCR. At 300 ng/ml TSA, there was downregulation of IFN-γ mRNA, while at 500 ng/ml TSA, suppression of IFN-γ transcription was almost complete (Figure 1a).
Figure 1.
Downregulation of IFN-γ transcript and protein levels by TSA and SAHA. (a) TSA (300–500 ng/ml) decreases the level of IFN-γ mRNA relative to GAPDH mRNA in splenocytes from 24-week-old MRL-lpr/lpr mice. (b) Splenocytes from 10-week-old MRL-lpr/lpr mice were incubated in the absence or presence of 300 ng/ml TSA or 10 μM SAHA for 18 hours. Splenocytes were then stimulated with ConA (10 μg/ml) for 18 hours. In lanes 3 and 5, TSA or SAHA was added at the same time as ConA and cultured for 18 hours. IFN-γ mRNA levels relative to GAPDH are shown. (c) Based on densitometric scanning of the gel in b, this graph depicts the fold change of IFN-γ mRNA in cells cultured as described above. A representative of three independent experiments is shown. (d) Splenocytes from 10-week-old mice were cultured in the presence of vehicle, LPS, LPS plus TSA, LPS plus SAHA, ConA, ConA plus TSA, or ConA plus SAHA for 72 hours. The concentrations of TSA and SAHA were 300 ng/ml and 10 μM, respectively. This graph depicts the amount of IFN-γ protein secretion. The bar represents the mean ± SEM of three independent experiments.
To determine whether TSA or SAHA downregulates ConA-induced IFN-γ mRNA expression, splenocytes from younger, predisease 10-week-old MRL-lpr/lpr mice were stimulated for 18 hours with the mitogen. Splenocyte mitogen activation upregulated IFN-γ mRNA content approximately 2.5-fold but did not alter GAPDH mRNA expression (Figure 1b, lane 1 vs. lane 2, and Figure 1c). In contrast, when splenocytes were preincubated with TSA or SAHA for 18 hours, upregulation of IFN-γ transcript was markedly attenuated compared with cells not exposed to these inhibitors. Concentration-titration experiments revealed that the optimal concentration of SAHA for IFN-γ transcript suppression was 10 μM (data not shown). Thus, both TSA and SAHA inhibit IFN-γ mRNA upregulation by splenocytes from 10-week-old predisease MRL-lpr/lpr mice in response to mitogenic stimulation.
The marked decrement of IFN-γ transcript by these inhibitors prompted us to quantify IFN-γ protein secretion in splenocyte culture supernatants. Over 72 hours, ConA, but not LPS, stimulated splenocytes from 10-week-old MRL-lpr/lpr mice to secrete a mean (± SEM) 1,563.2 ± 88.3 pg/ml of IFN-γ (Figure 1d). ConA-stimulated splenocytes cultured in the presence of either 10 μM SAHA or 300 ng/ml TSA did not secrete any detectable IFN-γ protein (Figure 1d). Thus, inhibition of IFN-γ transcription by TSA and SAHA blocks synthesis and secretion of IFN-γ protein by mitogen-stimulated splenocytes from 10-week-old MRL-lpr/lpr mice.
TSA and SAHA downregulate expression of IL-12p40 and IL-12p35 mRNA, and IL-12p40 protein.
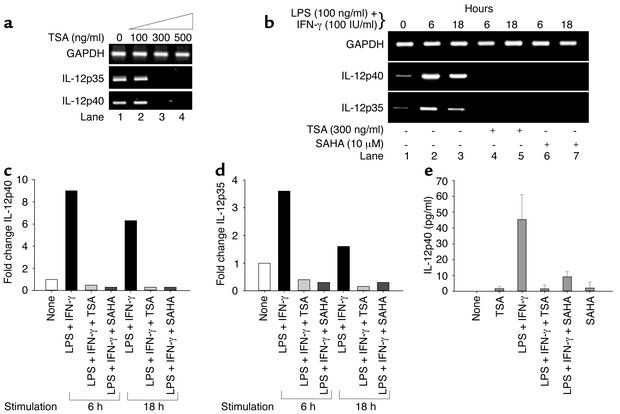
We next investigated whether TSA downregulates transcription of IL-12 assaying for both IL-12p35 and IL-12p40 subunits. Splenocytes from diseased, 24-week-old MRL-lpr/lpr mice had constitutive expression of both IL-12 subunit transcripts (Figure 2a). Concentrations of TSA greater than 100 ng/ml completely suppressed both transcripts (Figure 2a).
Figure 2.
Downregulation of IL-12 transcript and protein levels by TSA and SAHA. (a) Increasing concentrations of TSA (0–500 ng/ml) progressively decrease levels of IL-12p40 and IL-12p35 mRNA relative to GAPDH mRNA in splenocytes from 24-week-old MRL-lpr/lpr mice. (b) Splenocytes from 10-week-old MRL-lpr/lpr mice were incubated in the absence or presence of 300 ng/ml TSA or 10 μM SAHA for 18 hours. Splenocytes were then stimulated with LPS (100 ng/ml) plus IFN-γ (100 IU/ml) for 6 or 18 hours. IL-12p40 and IL-12p35 mRNA levels relative to GAPDH are shown. (c and d) Based on densitometric scanning of the gel in b, these graphs depict the fold change of IL-12p40 (c) and IL-12p35 (d) mRNA in cells cultured as described above. A representative of three independent experiments is shown. (e) Splenocytes from 10-week-old mice were cultured in the presence of vehicle, TSA, LPS plus IFN-γ, LPS plus IFN-γ plus TSA, LPS plus IFN-γ plus SAHA, or SAHA for 24 hours. The concentrations of TSA and SAHA were 300 ng/ml and 10 μM, respectively. This graph depicts the amount of IL-12p40 protein secretion. The bar represents the mean ± SEM of three independent experiments.
To address whether TSA and or SAHA downregulates LPS- and IFN-γ–induced IL-12p35 and p40 transcripts, splenocytes from 10-week-old MRL-lpr/lpr mice were stimulated in the presence or absence of TSA and SAHA for 18 hours. Splenocytes from younger mice were used because these cells express little if any constitutive IL-12p35 and p40 transcripts compared with splenocytes from older mice (Figure 2b, lane 1). Splenocytes were then stimulated with LPS and IFN-γ for 6 and 18 hours, respectively. Figure 2b demonstrates that, at 6 hours, there was a 9- and 3.5-fold increase of IL-12p40 and p35 transcripts, respectively, in the absence of the inhibitors relative to GAPDH transcript, as measured by densitometry. Similarly, at 18 hours, there was a 6- and 1.5-fold increase of IL-12p40 and p35 mRNA, respectively, relative to GAPDH mRNA in the absence of inhibitors. When splenocytes from 10-week-old mice were activated in the presence of 300 ng/ml TSA or 10 μM SAHA, IL-12p35 and p40 transcripts were undetectable (Figure 2, b–d).
In the absence of stimulation, splenocytes from 10-week-old MRL-lpr/lpr mice did not secrete detectable IL-12p40 protein during 24 hours. When splenocytes were activated with LPS and IFN-γ for 24 hours, the mean (± SEM) IL-12p40 secretion was 45.3 ± 9.1 pg/ml. However, preincubation of the splenocytes with TSA and SAHA resulted in significantly lower IL-12p40 protein production over 24 hours (mean ± SEM TSA, 1.5 ± 1.4 pg/ml; SAHA, 9.1 ± 1.9 pg/ml; P = 0.003 by ANOVA) (Figure 2e). Taken together, these results demonstrate that inhibition of p40 transcripts by TSA and SAHA leads to marked downregulation of IL-12p40 protein secretion by stimulated MRL-lpr/lpr splenocytes.
TSA and SAHA downregulate expression of IL-6 mRNA and protein.
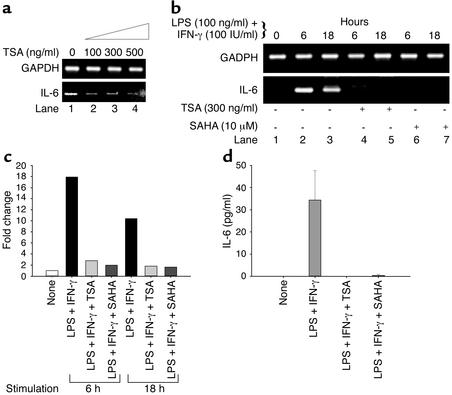
To determine whether TSA or SAHA effects Th2 cytokine production, splenocytes from diseased, 24-week-old MRL-lpr/lpr mice were treated with increasing concentrations of TSA over 18 hours. As shown in Figure 3a, lane 1, significantly increased, constitutive IL-6 transcript was present in splenocytes from 24-week-old mice (28) compared with 10-week-old mice (Figure 3b, lane 1). As shown in Figure 3a, TSA downregulated IL-6 mRNA in unstimulated splenocytes from 24-week-old MRL-lpr/lpr mice beginning at a concentration of 100 ng/ml.
Figure 3.
Downregulation of IL-6 transcript and protein levels by TSA and SAHA. (a) Increasing concentrations of TSA (0–500 ng/ml) progressively decrease levels of IL-6 relative to GAPDH mRNA in splenocytes from 24-week-old MRL-lpr/lpr mice. (b) Splenocytes from 10-week-old MRL-lpr/lpr mice were incubated in the absence or presence of 300 ng/ml TSA or 10 μM SAHA for 18 hours. Splenocytes were then stimulated with LPS (100 ng/ml) plus IFN-γ (100 IU/ml) for 6 or 18 hours. IL-6 mRNA levels relative to GAPDH are shown. (c) Based on densitometric scanning of the gel in b, this graph depicts the fold change of IL-6 mRNA in cells cultured as described above. A representative of three independent experiments is shown. (d) Splenocytes from 10-week-old mice were cultured in the presence of vehicle, LPS plus IFN-γ, LPS plus IFN-γ plus TSA, or LPS plus IFN-γ plus SAHA for 72 hours. The concentrations of TSA and SAHA were 300 ng/ml and 10 μM, respectively. This graph depicts the amount of IL-6 protein secretion. The bar represents the mean ± SEM of three independent experiments.
To address whether TSA and SAHA downregulate LPS- and IFN-γ−induced IL-6 transcript content, splenocytes from 10-week-old MRL-lpr/lpr mice were treated in the absence or presence of TSA or SAHA for 18 hours before LPS and IFN-γ stimulation for 6 and 18 hours, respectively. As depicted in Figure 3, b and c, IL-6 mRNA was upregulated 18-fold at 6 hours and tenfold at 18 hours relative to GAPDH. In contrast, there was no detectable IL-6 mRNA present in TSA- or SAHA-pretreated splenocytes from 10-week-old mice (Figure 3b, lanes 4–7). The downregulation of IL-6 mRNA was paralleled by a lack of detectable secretion of IL-6 protein in culture supernatants of splenocytes from 10-week-old mice (Figure 3d). When splenocytes from 10-week-old mice were cultured with LPS and IFN-γ for 72 hours, there was a mean (± SEM) 34.4 ± 7.6 pg/ml of IL-6 protein present in culture supernatants. Addition of TSA or SAHA with LPS and IFN-γ for 72 hours completely blocked IL-6 protein secretion. Taken together, these results demonstrate that both TSA and SAHA downregulate IL-6 mRNA transcription and IL-6 protein secretion by stimulated MRL-lpr/lpr splenocytes from 10-week-old mice.
TSA and SAHA decrease expression of IL-10 mRNA and protein.
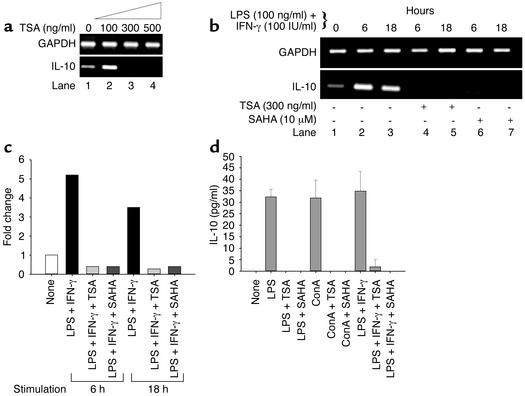
To investigate whether TSA downregulates other Th2 cytokines, such as IL-10, splenocytes from 24-week-old MRL-lpr/lpr mice were treated with increasing concentrations of TSA. TSA downregulated IL-10 mRNA at a concentration of 300 ng/ml (Figure 4a). To address whether TSA and SAHA downregulate LPS- and IFN-γ–induced IL-10 transcript content, splenocytes from predisease, 10-week-old MRL-lpr/lpr mice were treated in the absence or presence of TSA and SAHA for 18 hours before LPS and IFN-γ stimulation for 6 and 18 hours, respectively. Figure 4, b and c, demonstrates that IL-10 mRNA was upregulated approximately fivefold at 6 hours and approximately threefold at 18 hours relative to GAPDH transcript. There was no detectable IL-10 mRNA when the splenocytes were pretreated with either TSA or SAHA (Figure 4b, lanes 4–7).
Figure 4.
Downregulation of IL-10 transcript and protein levels by TSA and SAHA. (a) TSA (300–500 ng/ml) decreases the levels of IL-10 mRNA relative to GAPDH mRNA in splenocytes from 24-week-old MRL-lpr/lpr mice. (b) Splenocytes from 10-week-old MRL-lpr/lpr mice were incubated in the absence or presence of 300 ng/ml TSA or 10 μM SAHA for 18 hours. Splenocytes were then stimulated with LPS (100 ng/ml) plus IFN-γ (100 IU/ml) for 6 or 18 hours. IL-10 mRNA levels relative to GAPDH are shown. (c) Based on densitometric scanning of the gel in b, this graph depicts the fold change of IL-10 mRNA in cells cultured as described above. A representative of three independent experiments is shown. (d) Splenocytes from 10-week-old mice were cultured for 72 hours in the presence of vehicle, LPS, LPS plus TSA, LPS plus SAHA, ConA, ConA plus TSA, ConA plus SAHA, LPS plus IFN-γ, LPS plus IFN-γ plus TSA, or LPS plus IFN-γ plus SAHA. The concentrations of TSA and SAHA were 300 ng/ml and 10 μM, respectively. This graph depicts the amount of IL-10 protein secretion. The bar represents the mean ± SEM of three independent experiments.
To determine the effect of TSA and SAHA on IL-10 protein secretion, splenocytes from 10-week-old MRL-lpr/lpr mice were stimulated with ConA, LPS, or LPS plus IFN-γ for 72 hours in the absence or presence of TSA or SAHA. As shown in Figure 4d, splenocytes stimulated with ConA, LPS, or LPS plus IFN-γ secreted a mean (± SEM) of 31.8 ± 4.5, 32.3 ± 1.9, or 34.8 ± 4.9 pg/ml, respectively, of IL-10 protein. When cells were pretreated with TSA or SAHA, there was no detectable IL-10 secretion. Taken together, these results reveal that both TSA and SAHA downregulate induced IL-10 mRNA transcription and protein secretion by splenocytes from 10-week-old MRL-lpr/lpr mice.
TSA and SAHA induce accumulation of acetylated histones.
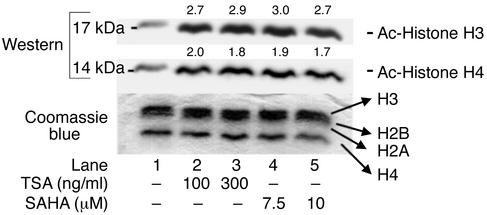
We propose that one mechanism by which HDIs suppress transcription of cytokine genes in MRL-lpr/lpr splenocytes is by accumulation of acetylated histones, resulting in chromatin remodeling. To test this possibility, we quantified acetylated histones H3 and H4 in HDI-treated splenocytes. Splenocytes from 10-week-old MRL-lpr/lpr mice were cultured with increasing concentrations of TSA or SAHA for 18 hours; nuclear histones were isolated and separated by SDS-PAGE, and transferred to Immobilon for immunoblotting with anti–acetylated H3 and H4 Ab’s. In Figure 5, immunoblot analysis of H3 and H4 histones prior to incubation with TSA or SAHA revealed background acetylation. Exposure of cells to TSA or SAHA for 18 hours resulted in approximately three- or twofold increased accumulation of acetylated H3 and H4 histones, respectively. Coomassie blue staining of the gel revealed no change in total H3 and H4 histones when cells were exposed to TSA or SAHA. These findings indicate that inhibition of HDACs by TSA and SAHA increases acetylation of H3 and H4 histones in splenocytes from MRL-lpr/lpr mice.
Figure 5.
Western immunoblot analysis of acetylated histones H3 and H4 in 24-week-old MRL-lpr/lpr splenocytes. Histones were isolated by acid extraction from cells cultured with different doses of TSA or SAHA for 18 hours. Acetylation was detected using anti–acetylated H3 and H4 Ab’s. A parallel gel stained with Coomassie blue is shown as a control for protein loading in each lane (66–68).
TSA and SAHA do not increase cell death.
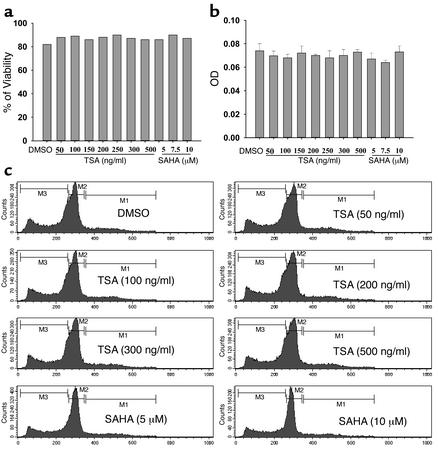
To determine whether increasing doses of TSA and SAHA decrease cell viability, thus explaining the inhibition of cytokine production, splenocytes from 24-week-old mice were cultured for 24 hours with increasing concentrations of TSA (50–500 ng/ml) or SAHA (5–10 μM). The cell viability was determined by trypan blue exclusion, MTT assay, and cell cycle analysis. The effect of different concentrations of TSA and SAHA on splenocyte cell viability is summarized in Figure 6. There was no evidence for decreased cell viability in TSA- or SAHA-treated cells compared with vehicle-treated cells, even at the highest concentrations tested.
Figure 6.
Effects of different concentrations of TSA or SAHA on cell viability. Cell viability was assessed by trypan blue exclusion (a), MTT method (b), and cell cycle analysis by propidium iodide staining (c). The bars represent the mean ± SD of triplicates.
TSA treatment of MRL-lpr/lpr mice decreases spleen weight.
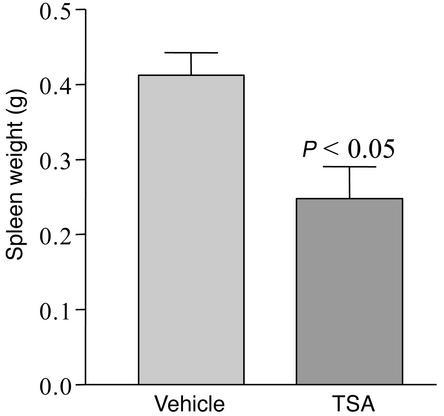
Based on in vitro evidence that TSA downregulates Th1 and Th2 cytokine production by MRL-lpr/lpr splenocytes, we tested the hypothesis that TSA would delay or prevent the progression of lupus activity. We assessed several indicators of lupus activity that reflect the underlying immunopathology of the disease. The first was spleen size, because MRL-lpr/lpr mice develop massive splenomegaly and lymphadenopathy with disease progression. At age 19 weeks, five animals from each group were sacrificed, and the mean spleen weights were determined. Compared with vehicle-treated controls (0.41 ± 0.06 g), TSA-treated mice had significantly smaller spleens (0.28 ± 0.08 g, P < 0.05) (Figure 7).
Figure 7.
Spleen weights of MRL-lpr/lpr mice receiving daily injections of either TSA (0.5 mg/kg BW in DMSO) or vehicle (DMSO) for 5 weeks beginning at 14 weeks of age (n = 5, P < 0.05).
TSA decreases the number of CD3+B220+ cells in spleen.
To investigate whether TSA treatment differentially affects splenocyte subsets that might account for the decrease in spleen size in TSA-treated mice, we initially assessed changes in splenic architecture by standard evaluation of H&E-stained frozen splenic sections. No differences in overall splenic architecture were noted between the two groups (data not shown). We next determined by immunofluorescence whether TSA treatment affected the percentage of specific T cell subsets in the spleen, using mean fluorescence as an indicator of the presence of a particular cell type. We observed a trend toward increased fluorescence for CD4, CD8, and CD19 in the spleens of the TSA treated group, but no significant differences between the two groups as to mean fluorescence. Using confocal microscopic colocalization of cells that were both CD3+ and B220+, there was an overall reduction in the percentage of double-positive cells (control 26.1% ± 3% vs. TSA 12.4% ± 7%, P < 0.05). We interpret these findings to indicate, based on spleen size, that there was an overall reduction in the number of all splenic cellular subsets, and that there was a specific reduction in the number of CD3+/B220+ T cells.
TSA has no effect on autoantibody production.
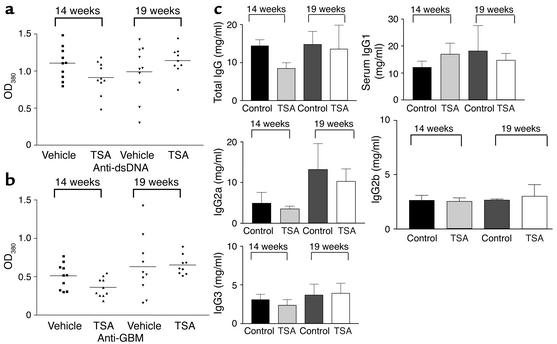
MRL-lpr/lpr mice develop hypergammaglobulinemia and produce high concentrations of serum autoantibodies directed against several autoantigens, including dsDNA and GBM. To determine whether treatment with TSA modifies autoantibody production, serum levels of anti-dsDNA and anti-GBM autoantibodies were quantified. The levels of both anti-dsDNA and anti-GBM autoantibodies in TSA-treated mice and controls were similar at ages 14 and 19 weeks (Figure 8, a and b). IgG isotype levels were also not affected by TSA treatment (Figure 8c). Thus, TSA treatment does not affect serum autoantibody production or IgG isotype levels.
Figure 8.
Serum anti-dsDNA and anti-GBM Ab levels in MRL-lpr/lpr mice receiving daily injections of either TSA (0.5 mg/kg BW in DMSO) or vehicle (DMSO) measured by ELISA at 14 and 19 weeks of age. (a) Anti-dsDNA levels in sera from MRL-lpr/lpr mice. Data are the OD380 at 1:100 serum dilution in each group with 5 μg/ml double-stranded calf thymus DNA as antigen. (b) Anti-GBM Ab levels in sera from MRL-lpr/lpr mice. Data are the OD380 at 1:100 sera dilution in each group with 50 μg/ml rat GBM as antigen. (c) Total IgG and IgG isotype levels in sera from MRL-lpr/lpr mice.
TSA decreases protein secretion.
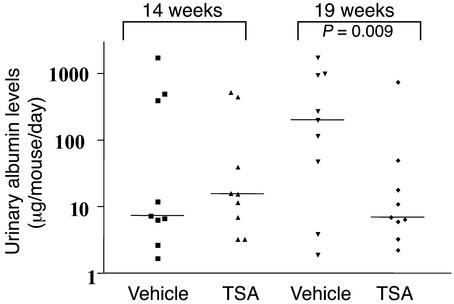
To determine whether TSA altered the progression of renal disease, we quantified albumin excretion by ELISA in urine specimens collected over 24-hour intervals between ages 14 and 19 weeks. The MRL-lpr/lpr mice in the TSA-treated group at the initiation of treatment at age 14 weeks had a mean urine-albumin excretion of 374 ± 252 μg per mouse per day. At 19 weeks of age, mice treated with TSA had a mean albumin excretion of 94 ± 87 μg per mouse per day (P = 0.009). Thus, TSA treatment decreased proteinuria when given early in disease. In contrast, vehicle-treated 19-week-old mice had a significant increase in albuminuria (765 ± 350 μg/mouse/day) compared with pretreated 14-week-old mice (298 ± 191 μg/mouse/day). These results demonstrate that TSA treatment significantly reverses early disease manifestations and prevents progression of proteinuria with age in MRL-lpr/lpr mice (Figure 9).
Figure 9.
Urinary-albumin excretion by MRL-lpr/lpr mice receiving daily injections of either TSA (0.5 mg/kg BW in DMSO) or vehicle (DMSO) for 5 weeks beginning at 14 weeks of age. Data are the 24-hour urinary albumin excretion (μg/mouse/day) in each group. At 19 weeks of age, four of the nine untreated mice had albumin excretion above 1 mg/d, while none of the nine TSA-treated mice had albuminuria above 1 mg/d (P < 0.05 at 19 weeks).
TSA modifies renal pathology and renal score.
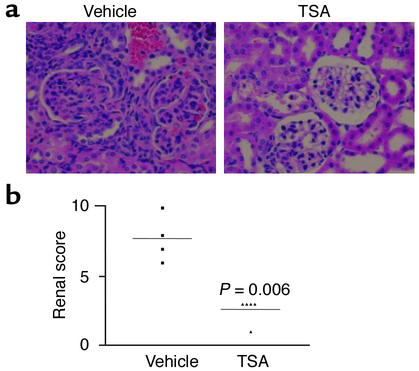
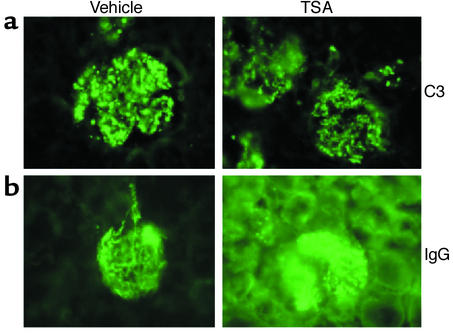
To further assess effects of TSA treatment on disease progression, kidney sections obtained at necropsy at 19 weeks were examined by standard immunohistologic techniques for evidence of glomerular inflammation, immune complex deposition, and complement fixation. Figure 10a shows a representative kidney section from TSA- and vehicle-treated mice, stained with H&E. The glomeruli from the vehicle-treated mouse show characteristic histopathologic evidence of diffuse proliferative GN, including hypercellularity, mesangial proliferation, and glomerular sclerosis. In contrast, the kidney section from the TSA-treated mouse shows minimal signs of inflammation or cellular proliferation. Based on light-microscopy pathologic assessment, the renal pathology index of TSA-treated mice was significantly lower than that of vehicle-treated mice at 19 weeks of age (Figure 10b). Immunofluorescence microscopy, however, revealed no significant difference in the intensity or distribution of staining for IgG or C3, indicating that treatment with TSA did not prevent immune complex deposition or complement fixation in the glomerulus (Figure 11, a and b). Analysis of IgG isotype deposition in the glomeruli (IgG1, IgG2a, and IgG3) revealed no difference in staining between the two groups (data not shown). Thus the significant decrease in proliferative renal disease was evident in the TSA-treated mice even though TSA did not affect IgG or C3 deposition.
Figure 10.
(a) Representative kidney sections stained with H&E from an MRL-lpr/lpr mouse receiving daily injections of either TSA (0.5 mg/kg BW in DMSO) or vehicle (DMSO) for 5 weeks beginning at 14 weeks of age. At the time of sacrifice (19 weeks), the kidneys were removed and then sectioned before staining with H&E. (b) The kidney slides were graded for glomerular inflammation, proliferation, crescent formation, and necrosis. Scores from 0 to 3+ were assigned for each of these features and then added together to yield a final renal score.
Figure 11.
Immunohistochemical analysis of IgG and C3 deposition in the kidneys of MRL-lpr/lpr mice receiving daily injections of either TSA (0.5 mg/kg BW in DMSO) or vehicle (DMSO) for 5 weeks beginning at 14 weeks of age. (a) Representative section of a kidney stained for IgG fluorescence. (b) Representative section of a kidney stained for C3 fluorescence.
Toxicity.
The toxicity of TSA in vivo was assessed by monitoring of body weight, food intake, and behavior in treated mice compared with control mice. There were no notable differences between the groups. No deaths occurred in either the TSA-treated or the vehicle-group during the treatment period. At the age of 19 weeks, there was no significant difference in the weights of treated (35.6 ± 1.3 g) and control mice (34.4 ± 1.3 g). However, small subcutaneous ulcers developed at the site of injection in both the TSA- and the vehicle-treated groups. These ulcers most likely resulted from DMSO.
Discussion
Splenocytes from both predisease 10-week-old and diseased 24-week-old lupus-prone MRL-lpr/lpr mice were analyzed in parallel experiments to assess the effects of HDIs on cytokine expression with advancing age and disease activity. These experiments also allowed comparison of the effects of the HDIs on induced and spontaneous cytokine expression. Our results indicate that both TSA and SAHA effectively reduced IL-12, IFN-γ, IL-6, and IL-10 transcription, as revealed by the decreased detectable mRNA transcripts assayed by semiquantitative RT-PCR. Both HDIs were efficacious in downregulating cytokine transcription independent of stimulation or attendant disease activity. Concentration-response analyses established that, in most assays, 300 ng/ml TSA and 10 μM SAHA produced comparable inhibition. Neither TSA nor SAHA altered GAPDH mRNA expression or negatively impacted cell viability at the concentrations used in these experiments.
Furthermore, our results demonstrate that TSA had no effect on in vivo anti-dsDNA or anti-GBM autoantibody production, nor did it prevent or decrease IgG or C3 deposition in the kidney. However, treatment with TSA did significantly decrease urine-protein excretion and renal pathology scores compared with those of controls. TSA treatment also resulted in decreased splenomegaly with a specific decrease in CD3+/B220+ T cells. Taken together, these experiments confirm and extend our earlier results in human SLE T cells by demonstrating that HDIs can target expression of disease-modifying genes without affecting the expression of other genes, such as GAPDH. The in vivo studies demonstrate that treatment with an HDI diminished renal disease in MRL-lpr/lpr mice, indicating a potential use of HDIs in the clinical setting.
Inhibition of cytokine transcription by TSA and SAHA was temporally related to enhanced acetylation of core H3 and H4 histones. These parallel findings suggest that chromatin rearrangement may be a mechanism for decreased cytokine gene expression by MRL-lpr/lpr splenocytes induced by TSA and SAHA. Epigenetic phenomena, including methylation and histone acetylation, are critical in regulation of gene expression (7). Complex patterns of chromatin activation and repression are causally associated with the regulation of many fundamental immune processes. For instance, differentiation of naive CD4+ Th0 cells into mature Th2 cells is associated with chromatin remodeling of the IL-4 and IL-13 genes, whereas differentiation into Th1 cells induces remodeling of the IFN-γ but not the IL-4 or IL-13 genes (29). Also, in primary macrophages, nucleosome 1 was rapidly and selectively remodeled in the IL-12p40 promoter in a protein synthesis–dependent manner (30). These alterations in chromatin structure are likely a product of modifications in the pattern of histone acetylation (31).
Although the exact mechanism(s) leading to downregulation of cytokine genes in MRL-lpr/lpr mice remains to be determined, several possibilities can be proposed. HDIs are believed to modulate gene expression either positively or negatively in a gene-specific manner (8, 32). For example, TSA upregulates MHC-I, MHC-II, CD40, and CD54 while downregulating PU-1 and CD9 in mouse macrophage cell lines (33–35). Previous studies have also demonstrated that HDIs suppress collagen synthesis, TGF-β1–induced fibrogenesis, IL-2, IL-8, IL-18, c-myc, bag-1, and Lc-PTP, while upregulating CD21, glutamate receptor-2, and the manganese superoxide dismutase gene (8, 36–40). Differential-display analysis of cells treated with TSA reveals a change (either an increase or a decrease) in the transcriptional activity of specific genes with an increase in the overall level of core histone acetylation (10, 41).
HDACs may also interact with transcriptional factors and modulate their activity. For example, HDAC2 has been shown to bind to YY1. YY1 is a sequence-specific DNA-binding protein that can act as a repressor or an activator, depending on the context of the specific promoter (42). Thus, that HDIs suppress activated cytokine genes, such as IL-12, IFN-γ, IL-6, and IL-10, in MRL-lpr/lpr splenocytes in our study is not surprising. Indeed, a recent study by Leoni et al. demonstrated that single oral administration of SAHA to mice dose-dependently reduced circulating TNF-α, IL-1β, IL-6, and IFN-γ induced by LPS (17). Administration of SAHA also reduced hepatic cellular injury in mice following i.v. infusion of ConA (17). Moreover, HDIs inhibited nitric oxide (NO) release in mouse peritoneal macrophages stimulated with TNF-α and IFN-γ and rat mesangial cells stimulated with LPS and IFN-γ (17, 43). Preliminary studies from our group demonstrated that TSA concentration dependently inhibited the production of TNF-α, IL-6, IL-12, and NO in LPS and IFN-γ by stimulated mesangial cells isolated from 10-week-old MRL-lpr/lpr mice (C.M. Reilly, unpublished data) (44).
Second, in addition to their modification of histones, acetylases modify other proteins, including transcriptional factors (31). For example, acetylation of T cell factor disrupts its interaction with the Drosophila β-catenin homolog armadillo, resulting in decreased transcriptional activity (45). Also, acetylation of p53 stimulates DNA binding (46), whereas deacetylation of p53 modulates its effect on cell growth and apoptosis (47). In addition, the transcription factor C/EBP, which upregulates IL-12p40 and IL-6 transcription, is also downregulated by TSA or butyrate, reducing both C/EBP mRNA and protein levels (48). NF-κB is another pivotal transcription factor that regulates the expression of several cytokine genes, including IFN-γ and IL-10 (49). IκB-β binds to NF-κB, inhibiting its nuclear translocation (49). Downregulation of IL-1–dependent induction of the IL-8 gene in the human colon carcinoma cell line Caco-2 by butyrate (another HDI) is due to induced expression of IκB-β, with resulting inhibition of NF-κB nuclear translocation (50). Thus, the effect of HDIs on IL-12, IL-6, IFN-γ, and IL-10 expression may be direct via chromatin remodeling, acting through C/EBP, or indirect, acting through NF-κB.
Third, HDIs can act by inducing other genes, such as TGF-β, which modulates IFN-γ and IL-10 transcript expression (51). Our unpublished data as well a previous study by others (52) suggest that HDIs upregulate TGF-β gene expression. Thus, inhibition of expression of IL-10 and IFN-γ in the splenocytes of MRL-lpr/lpr mice by HDIs could potentially be mediated by multiple mechanisms. These differential mechanistic effects likely explain why HDIs inhibit IFN-γ production by MRL-lpr/lpr splenocytes while enhancing IFN-γ production by CD4+ peripheral blood T cells from human lupus patients. The ability of HDIs to influence the expression of genes depends on the particular promoter architecture of that gene. Recent completion of the human and mouse genomes has revealed that the human and murine IFN-γ genes display homology within their genomic structure (mouse GDB accession no. NW 000033 and human GDB accession no. NT 029419) (53–55). This homology is also seen within the promoter regions, but important differences in sequence exist (56). Since IFN-γ gene is overexpressed by MRL-lpr/lpr splenocytes, it is likely that the chromatin architecture at the IFN-γ promoter is different (i.e., open chromatin) from that of its human SLE T cell counterpart, where the gene is not undergoing transcription (closed chromatin). The contrast between HDI-induced inhibition of IFN-γ production by MRL-lpr/lpr splenocytes and upregulation of IFN-γ in human SLE T cells is perhaps not so surprising given that the experiments were performed on two different cellular subsets from two different species producing different amounts of the cytokine. We are pursuing experiments to determine the mechanism for the effect of HDIs on cytokine production in MRL-lpr/lpr mice.
Although the MRL-lpr/lpr murine model of lupus has many similarities to human lupus, including autoantibody production and development of GN, it differs as well. While both male and female MRL-lpr/lpr mice are similarly affected, human SLE affects females ninefold more than males. MRL-lpr/lpr mice have elevated production of IFN-γ and TGF-β, while humans with SLE produce low levels of these cytokines (5, 6). Moreover, the spectrum of clinical manifestations in humans is greater and the outcome more variable compared with the homogeneous presentation of the MRL-lpr/lpr model. These differences emphasize that the positive effects of TSA treatment in MRL-lpr/lpr mice do not necessarily mean that it will be effective in human lupus. Several reports have demonstrated that neutralization of Th1 and Th2 cytokines is beneficial in lupus treatment (5, 6). Indeed, MRL-lpr/lpr mice with either a single deletion or a homozygous deletion of the IFN-γ gene (57) or the IFN-γ receptor gene were protected from disease, as were NZB/W F1 × NZW F1 mice treated with anti–IFN-γ Ab’s (58) or soluble IFN-γ receptor (59). Similarly, MRL-lpr/lpr mice treated with anti–IL-12 Ab’s showed enhanced survival (60). Moreover, treatment of NZB × NZW F1 mice with anti–IL-6 (61) and anti–IL-10 Ab’s delayed onset of autoimmunity and proteinuria and prolonged survival (62). We believe that the beneficial effect of TSA on renal disease in MRL-lpr/lpr mice is mediated by effects on the production of inflammatory mediators including the cytokines reported herein.
HDIs are not the only agents that can cause marked reduction in proteinuria and significant improvement in renal pathology without changing circulating serum levels of autoantibodies and glomerular immune complex deposition in MRL-lpr/lpr mice compared with vehicle-treated controls. For example, uncoupling of autoantibody production, immune complex deposits, and kidney damage was also observed in NZB × NZW F1 mice deficient in the γ chain of the Fc receptor (63). Moreover, MRL-lpr/lpr mice heterozygous for the IFN-γ gene (IFN-γ+/–) had minimal kidney disease and prolonged survival despite the fact that autoantibody levels and kidney immune deposits were unaffected (57). Finally, treatment of MRL-lpr/lpr mice with a high dose of GCSF resulted in substantial protection from kidney disease and prolonged survival without affecting immune complex deposition in kidneys (64). Thus, our study combined with the above studies suggests that renal disease and autoantibody titers are not directly linked and that inflammatory mechanisms leading to tissue damage are distinct from those leading to autoantibody production. The decrease in spleen size and suppression of the CD3+B220+ T cell subset in MRL-lpr/lpr mice treated with TSA are likely multifactorial. A number of pharmacologic and genetic knockout studies in MRL-lpr/lpr mice have reported decreases in spleen size with decreases in the number of CD4–CD8–CD3+B220+ T cells. Specific cytokines such as IFN-γ appear to be important for their proliferation. Thus we postulate that the decreased spleen size and decreased numbers of double-negative T cells in MRL-lpr/lpr mice treated with TSA likely reflect a local decrease in cytokine production (i.e., IL-12 and IFN-γ) in the spleen.
HDIs, such as SAHA and depsipeptide, are currently in phase I clinical trials as anticancer therapy (65). Investigations of the potential role of these agents in autoimmune diseases are just beginning. The downregulation of IFN-γ, IL-12, IL-6, and IL-10 gene expression by HDIs has several biological consequences. Our results indicate that one consequence is amelioration of nephritis in a murine model of SLE. Further studies are certainly warranted to assess the therapeutic potential, long-term effects, impact on immunocompetence, and mechanism of action of HDIs in SLE prior to clinical trials of these agents in lupus.
Acknowledgments
This work was supported by a Grant in Aid from the American Heart Association, and by grants from the Lupus Foundation of America, Forsyth County United Way, Wake Forest University School of Medicine Venture Funds, NIH (AR49153) (to N. Mishra), and the Medical Research Service at the Ralph H. Johnson Veterans Administration Medical Center. D.R. Brown is supported by NIH grant F32 AI10582. C.M. Reilly is a postdoctoral fellow of the Arthritis Foundation and an Associate Investigator in the Ralph H. Johnson research enhancement awards program.
Footnotes
Nilamadhab Mishra and Christopher M. Reilly contributed equally to this work.
Conflict of interest: The authors have declared that no conflict of interest exists.
Nonstandard abbreviations used: systemic lupus erythematosus (SLE); double-stranded DNA (dsDNA); glomerulonephritis (GN); recombinant IL-12 (rIL-12); recombinant IFN-γ (rIFN-γ); concanavalin A (ConA); histone deacetylase (HDAC); histone deacetylase inhibitor (HDI); trichostatin A (TSA); suberonylanilide hydroxamic acid (SAHA); body weight (BW); PBS containing 0.05% Tween (PBS-T); glomerular basement membrane (GBM).
References
- 1.Gladman, D.D., and Urowitz, M.B. 1997. Prognostic subsets and mortality in systemic lupus erythematosus. In Dubois’ lupus erythematosus. D.J. Wallace and B.H. Hahn, editors. Williams & Wilkins. Baltimore, Maryland, USA. 1213–1229.
- 2.Theofilopoulos AN, Dixon FJ. Murine models of systemic lupus erythematosus. Adv. Immunol. 1985;37:269–390. doi: 10.1016/s0065-2776(08)60342-9. [DOI] [PubMed] [Google Scholar]
- 3.Dean GS, Tyrrell-Price J, Crawley E, Isenberg DA. Cytokines and systemic lupus erythematosus. Ann. Rheum. Dis. 2000;59:243–251. doi: 10.1136/ard.59.4.243. [DOI] [PMC free article] [PubMed] [Google Scholar]
- 4.Murray LJ, Lee R, Martens C. In vivo cytokine gene expression in T cell subsets of the autoimmune MRL/Mp-lpr/lpr mouse. Eur. J. Immunol. 1990;20:163–170. doi: 10.1002/eji.1830200124. [DOI] [PubMed] [Google Scholar]
- 5.Handwerger, B.S., Luzina, I., da Silva, L., Storrer, C.E., and Via, C.S. 1999. Cytokines in the immunopathogenesis of lupus. In Lupus: molecular and cellular pathogenesis. G.M. Kammer and G.C. Tsokos, editors. Humana Press. Totowa, New Jersey, USA. 321–340.
- 6.Hahn, B.H. 1997. Animal models of systemic lupus erythematosus. In Dubois’ lupus erythematosus. D.J. Wallace and B.H. Hahn, editors. Williams & Wilkins. Baltimore, Maryland, USA. 339–380.
- 7.Spencer VA, Davie JR. Role of covalent modifications of histones in regulating gene expression. Gene. 1999;240:1–12. doi: 10.1016/s0378-1119(99)00405-9. [DOI] [PubMed] [Google Scholar]
- 8.Vidal M, Gaber RF. RPD3 encodes a second factor required to achieve maximum positive and negative transcriptional states in Saccharomyces cerevisiae. Mol. Cell. Biol. 1991;11:6317–6327. doi: 10.1128/mcb.11.12.6317. [DOI] [PMC free article] [PubMed] [Google Scholar]
- 9.Turner BM. Decoding the nucleosome. Cell. 1993;75:5–8. [PubMed] [Google Scholar]
- 10.Van Lint C, Emiliani S, Verdin E. The expression of a small fraction of cellular genes is changed in response to histone hyperacetylation. Gene Expr. 1996;5:245–253. [PMC free article] [PubMed] [Google Scholar]
- 11.Yoshida M, Kijima M, Akita M, Beppu T. Potent and specific inhibition of mammalian histone deacetylase both in vivo and in vitro by trichostatin A. J. Biol. Chem. 1990;265:17174–17179. [PubMed] [Google Scholar]
- 12.Richon VM, et al. A class of hybrid polar inducers of transformed cell differentiation inhibits histone deacetylases. Proc. Natl. Acad. Sci. USA. 1998;95:3003–3007. doi: 10.1073/pnas.95.6.3003. [DOI] [PMC free article] [PubMed] [Google Scholar]
- 13.Butler LM, et al. Suberoylanilide hydroxamic acid, an inhibitor of histone deacetylase, suppresses the growth of prostate cancer cells in vitro and in vivo. Cancer Res. 2000;60:5165–5170. [PubMed] [Google Scholar]
- 14.Vigushin DM, et al. Trichostatin A is a histone deacetylase inhibitor with potent antitumor activity against breast cancer in vivo. Clin. Cancer Res. 2001;7:971–976. [PubMed] [Google Scholar]
- 15.Nervi C, et al. Inhibition of histone deacetylase activity by trichostatin A modulates gene expression during mouse embryogenesis without apparent toxicity. Cancer Res. 2001;61:1247–1249. [PubMed] [Google Scholar]
- 16.Mishra N, Brown DR, Olorenshaw IM, Kammer GM. Trichostatin A reverses skewed expression of CD154, interleukin-10, and interferon-gamma gene and protein expression in lupus T cells. Proc. Natl. Acad. Sci. USA. 2001;98:2628–2633. doi: 10.1073/pnas.051507098. [DOI] [PMC free article] [PubMed] [Google Scholar]
- 17.Leoni F, et al. The antitumor histone deacetylase inhibitor suberoylanilide hydroxamic acid exhibits antiinflammatory properties via suppression of cytokines. Proc. Natl. Acad. Sci. USA. 2002;99:2995–3000. doi: 10.1073/pnas.052702999. [DOI] [PMC free article] [PubMed] [Google Scholar]
- 18.Nambiar MP, Warke VG, Fisher CU, Tsokos GC. Effect of trichostatin A on human T cells resembles signaling abnormalities in T cells of patients with systemic lupus erythematosus: a new mechanism for TCR zeta chain deficiency and abnormal signaling. J. Cell. Biochem. 2002;85:459–469. doi: 10.1002/jcb.10160. [DOI] [PubMed] [Google Scholar]
- 19.Wang Y, Zheng X. A flow cytometry-based assay for quantitative analysis of cellular proliferation and cytotoxicity in vitro. J. Immunol. Methods. 2002;268:179–188. doi: 10.1016/s0022-1759(02)00190-4. [DOI] [PubMed] [Google Scholar]
- 20.Nusse M, Beisker W, Hoffmann C, Tarnok A. Flow cytometric analysis of G1- and G2/M-phase subpopulations in mammalian cell nuclei using side scatter and DNA content measurements. Cytometry. 1990;11:813–821. doi: 10.1002/cyto.990110707. [DOI] [PubMed] [Google Scholar]
- 21.Richon VM, Sandhoff TW, Rifkind RA, Marks PA. Histone deacetylase inhibitor selectively induces p21WAF1 expression and gene-associated histone acetylation. Proc. Natl. Acad. Sci. USA. 2000;97:10014–10019. doi: 10.1073/pnas.180316197. [DOI] [PMC free article] [PubMed] [Google Scholar]
- 22.Mishra N, Khan IU, Tsokos GC, Kammer GM. Association of deficient type II protein kinase A activity with aberrant nuclear translocation of the RII beta subunit in systemic lupus erythematosus T lymphocytes. J. Immunol. 2000;165:2830–2840. doi: 10.4049/jimmunol.165.5.2830. [DOI] [PubMed] [Google Scholar]
- 23.Weinberg JB, et al. The role of nitric oxide in the pathogenesis of spontaneous murine autoimmune disease: increased nitric oxide production and nitric oxide synthase expression in MRL-lpr/lpr mice, and reduction of spontaneous glomerulonephritis and arthritis by orally administered NG-monomethyl-L-arginine. J. Exp. Med. 1994;179:651–660. doi: 10.1084/jem.179.2.651. [DOI] [PMC free article] [PubMed] [Google Scholar]
- 24.Gilkeson GS, Grudier JP, Karounos DG, Pisetsky DS. Induction of anti-double stranded DNA antibodies in normal mice by immunization with bacterial DNA. J. Immunol. 1989;142:1482–1486. [PubMed] [Google Scholar]
- 25.Watson ML, et al. Genetic analysis of MRL-lpr mice: relationship of the Fas apoptosis gene to disease manifestations and renal disease-modifying loci. J. Exp. Med. 1992;176:1645–1656. doi: 10.1084/jem.176.6.1645. [DOI] [PMC free article] [PubMed] [Google Scholar]
- 26.Watanabe H, et al. Modulation of renal disease in MRL/lpr mice genetically deficient in the alternative complement pathway factor B. J. Immunol. 2000;164:786–794. doi: 10.4049/jimmunol.164.2.786. [DOI] [PubMed] [Google Scholar]
- 27.Prud’homme GJ, Kono DH, Theofilopoulos AN. Quantitative polymerase chain reaction analysis reveals marked overexpression of interleukin-1 beta, interleukin-1 and interferon-gamma mRNA in the lymph nodes of lupus-prone mice. Mol. Immunol. 1995;32:495–503. doi: 10.1016/0161-5890(95)00024-9. [DOI] [PubMed] [Google Scholar]
- 28.Tang B, et al. Age-associated increase in interleukin 6 in MRL/lpr mice. Int. Immunol. 1991;3:273–278. doi: 10.1093/intimm/3.3.273. [DOI] [PubMed] [Google Scholar]
- 29.Agarwal S, Rao A. Modulation of chromatin structure regulates cytokine gene expression during T cell differentiation. Immunity. 1998;9:765–775. doi: 10.1016/s1074-7613(00)80642-1. [DOI] [PubMed] [Google Scholar]
- 30.Weinmann AS, Plevy SE, Smale ST. Rapid and selective remodeling of a positioned nucleosome during the induction of IL-12 p40 transcription. Immunity. 1999;11:665–675. doi: 10.1016/s1074-7613(00)80141-7. [DOI] [PubMed] [Google Scholar]
- 31.Pazin MJ, Kadonaga JT. What’s up and down with histone deacetylation and transcription? Cell. 1997;89:325–328. doi: 10.1016/s0092-8674(00)80211-1. [DOI] [PubMed] [Google Scholar]
- 32.Johnstone RW. Histone-deacetylase inhibitors: novel drugs for the treatment of cancer. Nat. Rev. Drug Discov. 2002;1:287–299. doi: 10.1038/nrd772. [DOI] [PubMed] [Google Scholar]
- 33.Laribee RN, Klemsz MJ. Loss of PU.1 expression following inhibition of histone deacetylases. J. Immunol. 2001;167:5160–5166. doi: 10.4049/jimmunol.167.9.5160. [DOI] [PubMed] [Google Scholar]
- 34.Wang XQ, Alfaro ML, Evans GF, Zuckerman SH. Histone deacetylase inhibition results in decreased macrophage CD9 expression. Biochem. Biophys. Res. Commun. 2002;294:660–666. doi: 10.1016/S0006-291X(02)00523-5. [DOI] [PubMed] [Google Scholar]
- 35.Magner WJ, et al. Activation of MHC class I, II, and CD40 gene expression by histone deacetylase inhibitors. J. Immunol. 2000;165:7017–7024. doi: 10.4049/jimmunol.165.12.7017. [DOI] [PubMed] [Google Scholar]
- 36.Koyama Y, Adachi M, Sekiya M, Takekawa M, Imai K. Histone deacetylase inhibitors suppress IL-2-mediated gene expression prior to induction of apoptosis. Blood. 2000;96:1490–1495. [PubMed] [Google Scholar]
- 37.Maehara K, Uekawa N, Isobe K. Effects of histone acetylation on transcriptional regulation of manganese superoxide dismutase gene. Biochem. Biophys. Res. Commun. 2002;295:187–192. doi: 10.1016/S0006-291X(02)00646-0. [DOI] [PubMed] [Google Scholar]
- 38.Zabel MD, Weis JJ, Weis JH. Lymphoid transcription of the murine CD21 gene is positively regulated by histone acetylation. J. Immunol. 1999;163:2697–2703. [PubMed] [Google Scholar]
- 39.Huang Y, Doherty JJ, Dingledine R. Altered histone acetylation at glutamate receptor 2 and brain-derived neurotrophic factor genes is an early event triggered by status epilepticus. J. Neurosci. 2002;22:8422–8428. doi: 10.1523/JNEUROSCI.22-19-08422.2002. [DOI] [PMC free article] [PubMed] [Google Scholar]
- 40.Koyama N, et al. Differential effects of histone deacetylase inhibitors on interleukin-18 gene expression in myeloid cells. Biochem. Biophys. Res. Commun. 2002;292:937–943. doi: 10.1006/bbrc.2002.6753. [DOI] [PubMed] [Google Scholar]
- 41.Della Ragione F, et al. Genes modulated by histone acetylation as new effectors of butyrate activity. FEBS Lett. 2001;499:199–204. doi: 10.1016/s0014-5793(01)02539-x. [DOI] [PubMed] [Google Scholar]
- 42.Yang WM, Inouye C, Zeng Y, Bearss D, Seto E. Transcriptional repression by YY1 is mediated by interaction with a mammalian homolog of the yeast global regulator RPD3. Proc. Natl. Acad. Sci. USA. 1996;93:12845–12850. doi: 10.1073/pnas.93.23.12845. [DOI] [PMC free article] [PubMed] [Google Scholar]
- 43.Yu Z, Zhang W, Kone BC. Histone deacetylases augment cytokine induction of the iNOS gene. J. Am. Soc. Nephrol. 2002;13:2009–2017. doi: 10.1097/01.asn.0000024253.59665.f1. [DOI] [PubMed] [Google Scholar]
- 44.Reilly CM, Mishra N, Kammer GM, Gilkeson GS. Trichostatin A inhibits mesangial cell activation and lupus nephritis in MRL/lpr mice. Arthritis Rheum. 2002;46(Suppl. 9):S226. (Abstr.) [Google Scholar]
- 45.Waltzer L, Bienz M. Drosophila CBP represses the transcription factor TCF to antagonize Wingless signalling. Nature. 1998;395:521–525. doi: 10.1038/26785. [DOI] [PubMed] [Google Scholar]
- 46.Gu W, Roeder RG. Activation of p53 sequence-specific DNA binding by acetylation of the p53 C-terminal domain. Cell. 1997;90:595–606. doi: 10.1016/s0092-8674(00)80521-8. [DOI] [PubMed] [Google Scholar]
- 47.Luo J, Su F, Chen D, Shiloh A, Gu W. Deacetylation of p53 modulates its effect on cell growth and apoptosis. Nature. 2000;408:377–381. doi: 10.1038/35042612. [DOI] [PubMed] [Google Scholar]
- 48.Plevy SE, Gemberling JH, Hsu S, Dorner AJ, Smale ST. Multiple control elements mediate activation of the murine and human interleukin 12 p40 promoters: evidence of functional synergy between C/EBP and Rel proteins. Mol. Cell. Biol. 1997;17:4572–4588. doi: 10.1128/mcb.17.8.4572. [DOI] [PMC free article] [PubMed] [Google Scholar]
- 49.Thompson JE, Phillips RJ, Erdjument-Bromage H, Tempst P, Ghosh S. I kappa B-beta regulates the persistent response in a biphasic activation of NF-kappa B. Cell. 1995;80:573–582. doi: 10.1016/0092-8674(95)90511-1. [DOI] [PubMed] [Google Scholar]
- 50.Wu GD, Huang N, Wen X, Keilbaugh SA, Yang H. High-level expression of I kappa B-beta in the surface epithelium of the colon: in vitro evidence for an immunomodulatory role. J. Leukoc. Biol. 1999;66:1049–1056. doi: 10.1002/jlb.66.6.1049. [DOI] [PubMed] [Google Scholar]
- 51.Letterio JJ, Roberts AB. Regulation of immune responses by TGF-beta. Annu. Rev. Immunol. 1998;16:137–161. doi: 10.1146/annurev.immunol.16.1.137. [DOI] [PubMed] [Google Scholar]
- 52.Gray SG, et al. IGF-II enhances trichostatin A-induced TGFbeta1 and p21(Waf1,Cip1, sdi1) expression in Hep3B cells. Exp. Cell Res. 1999;253:618–628. doi: 10.1006/excr.1999.4661. [DOI] [PubMed] [Google Scholar]
- 53.Gray PW, Goeddel DV. Cloning and expression of murine immune interferon cDNA. Proc. Natl. Acad. Sci. USA. 1983;80:5842–5846. doi: 10.1073/pnas.80.19.5842. [DOI] [PMC free article] [PubMed] [Google Scholar]
- 54.Gray PW, Goeddel DV. Structure of the human immune interferon gene. Nature. 1982;298:859–863. doi: 10.1038/298859a0. [DOI] [PubMed] [Google Scholar]
- 55.Taya Y, et al. Cloning and structure of the human immune interferon-gamma chromosomal gene. EMBO J. 1982;1:953–958. doi: 10.1002/j.1460-2075.1982.tb01277.x. [DOI] [PMC free article] [PubMed] [Google Scholar]
- 56.Fitzpatrick DR, et al. Distinct methylation of the interferon gamma (IFN-gamma) and interleukin 3 (IL-3) genes in newly activated primary CD8+ T lymphocytes: regional IFN-gamma promoter demethylation and mRNA expression are heritable in CD44(high)CD8+ T cells. J. Exp. Med. 1998;188:103–117. doi: 10.1084/jem.188.1.103. [DOI] [PMC free article] [PubMed] [Google Scholar]
- 57.Balomenos D, Rumold R, Theofilopoulos AN. Interferon-gamma is required for lupus-like disease and lymphoaccumulation in MRL-lpr mice. J. Clin. Invest. 1998;101:364–371. doi: 10.1172/JCI750. [DOI] [PMC free article] [PubMed] [Google Scholar]
- 58.Jacob CO, van der Meide PH, McDevitt HO. In vivo treatment of (NZB X NZW)F1 lupus-like nephritis with monoclonal antibody to gamma interferon. J. Exp. Med. 1987;166:798–803. doi: 10.1084/jem.166.3.798. [DOI] [PMC free article] [PubMed] [Google Scholar]
- 59.Ozmen L, et al. Experimental therapy of systemic lupus erythematosus: the treatment of NZB/W mice with mouse soluble interferon-gamma receptor inhibits the onset of glomerulonephritis. Eur. J. Immunol. 1995;25:6–12. doi: 10.1002/eji.1830250103. [DOI] [PubMed] [Google Scholar]
- 60.Huang FP, et al. The role of interleukin 12 and nitric oxide in the development of spontaneous autoimmune disease in MRL/MP-lpr/lpr mice. J. Exp. Med. 1996;183:1447–1459. doi: 10.1084/jem.183.4.1447. [DOI] [PMC free article] [PubMed] [Google Scholar]
- 61.Finck BK, Chan B, Wofsy D. Interleukin 6 promotes murine lupus in NZB/NZW F1 mice. J. Clin. Invest. 1994;94:585–591. doi: 10.1172/JCI117373. [DOI] [PMC free article] [PubMed] [Google Scholar]
- 62.Ishida H, et al. Continuous administration of anti-interleukin 10 antibodies delays onset of autoimmunity in NZB/W F1 mice. J. Exp. Med. 1994;179:305–310. doi: 10.1084/jem.179.1.305. [DOI] [PMC free article] [PubMed] [Google Scholar]
- 63.Clynes R, Dumitru C, Ravetch JV. Uncoupling of immune complex formation and kidney damage in autoimmune glomerulonephritis. Science. 1998;279:1052–1054. doi: 10.1126/science.279.5353.1052. [DOI] [PubMed] [Google Scholar]
- 64.Zavala F, et al. Granulocyte-colony stimulating factor treatment of lupus autoimmune disease in MRL-lpr/lpr mice. J. Immunol. 1999;163:5125–5132. [PubMed] [Google Scholar]
- 65.Marks PA, Richon VM, Rifkind RA. Histone deacetylase inhibitors: inducers of differentiation or apoptosis of transformed cells. J. Natl. Cancer Inst. 2000;92:1210–1216. doi: 10.1093/jnci/92.15.1210. [DOI] [PubMed] [Google Scholar]
- 66.Chadee DN, et al. Increased Ser-10 phosphorylation of histone H3 in mitogen-stimulated and oncogene-transformed mouse fibroblasts. J. Biol. Chem. 1999;274:24914–24920. doi: 10.1074/jbc.274.35.24914. [DOI] [PubMed] [Google Scholar]
- 67.Strahl BD, et al. Methylation of histone H4 at arginine 3 occurs in vivo and is mediated by the nuclear receptor coactivator PRMT1. Curr. Biol. 2001;11:996–1000. doi: 10.1016/s0960-9822(01)00294-9. [DOI] [PubMed] [Google Scholar]
- 68.Wang H, et al. Methylation of histone H4 at arginine 3 facilitating transcriptional activation by nuclear hormone receptor. Science. 2001;293:853–857. doi: 10.1126/science.1060781. [DOI] [PubMed] [Google Scholar]


