

Abstract
Conjugative transfer of a bacteriocin plasmid, pPD1, of Enterococcus faecalis is induced in response to a peptide sex pheromone, cPD1, secreted from plasmid-free recipient cells. cPD1 is taken up by a pPD1 donor cell and binds to an intracellular receptor, TraA. Once a recipient cell acquires pPD1, it starts to produce an inhibitor of cPD1, termed iPD1, which functions as a TraA antagonist and blocks self-induction in donor cells. In this study, we discuss how TraA transduces the signal of cPD1 to the mating response. Gel mobility shift assays indicated that TraA is bound to a traA-ipd intergenic region, which is essential for cPD1 response. DNase I footprinting analysis suggested the presence of one strong (tab1) and two weak (tab2 and tab3) TraA-binding sites in the intergenic region. Primer extension analysis implied that the transcriptional initiation sites of traA and ipd were located in the intergenic region. Northern analysis showed that cPD1 upregulated and downregulated transcription of ipd and traA, respectively. The circular permutation assay showed that TraA bent a DNA fragment corresponding to the tab1 region, and its angle was changed in the presence of cPD1 or iPD1. From these data, we propose a model that TraA changes the conformation of the tab1 region in response to cPD1 and upregulates the transcription of ipd, which may lead to expression of genes required for the mating response.
In Enterococcus faecalis, the conjugative transfer of certain plasmids, such as bacteriocin plasmid pPD1 (40), a hemolysin/bacteriocin plasmid, pAD1 (35), a tetracycline-resistance plasmid, pCF10 (10), and a hemolysin/bacteriocin plasmid, pOB1 (29), is controlled by peptide pheromones (7, 9, 13). Plasmid-free recipient cells secrete multiple peptide sex pheromones (1, 2, 8), and a given pheromone (cX) specifically activates the conjugative transfer of a corresponding plasmid (pX). Once recipient cells acquire pX, they start to produce a pheromone inhibitor (iX) to block the activity of cX and to prevent self-clumping of donor cells (7, 20, 23). If plasmid-free cells secreting cX get close to donor cells, the cX outcompetes iX and triggers the mating processes including the synthesis of a surface adhesin, so-called “aggregation substance” (AS) (13, 14, 15, 16, 39). AS expressed on the surface of donor cells leads to binding to recipient cells and induces mating aggregates in which the plasmid is transferred at high frequency.
Previous studies (25, 27) using radiolabeled cPD1 showed that cPD1 was internalized into donor cells with the aid of TraC, which shows amino acid sequence similarity to oligopeptide binding proteins, which are a component of oligopeptide permease. The tracer study also demonstrated that the imported cPD1 binds to an intracellular receptor, TraA, encoded by pPD1. TraA bound to cPD1 with high affinity (dissociation constant [Kd] = 0.13 nM [25] or Kd = 0.5 nM [27]), which was approximately equal to the concentration of cPD1 required for the induction of sexual aggregation. iPD1 inhibited the binding of cPD1 to TraA in a competitive manner, indicating that iPD1 functioned as a TraA antagonist against cPD1 (27). No other pheromones or inhibitors prevented cPD1 binding, indicating that TraA determines the specificity among pheromones, inhibitors, and plasmids (25). TraA is encoded immediately upstream of the iPD1 gene, designated ipd (11, 24). traA insertion mutants underwent constitutive aggregation, indicating that TraA may act as a negative regulator in the cPD1 signaling pathway (28, 33). In contrast, OG1X carrying pAM351AIM, which has a deletion of a 1.6-kb SpeI-SpeI region (see Fig. 1) containing most of traA, all of ipd, and their intergenic region, was insensitive to cPD1. This indicated that ipd and/or the intergenic region between traA and ipd is essential for the response to cPD1 (28).
FIG. 1.

Identification of TraA-binding site in pPD1. (A) Map of pPD1. ORFs relating to mating response are shown. The AluI sites of the 2.3-kb HincII-HincII fragment containing traA and ipd are indicated by arrowheads. The region between two speI sites is deleted in OG1X(pAM351AIM), exhibiting a pheromone-insensitive phenotype. (B) Agarose gel electrophoresis of AluI digests of the HincII-HincII fragment. The digests (0.3 μg) were incubated with (lane 1) or without (lane 2) TraA (50 ng) for 30 min at 37°C in 30 mM Tris-HCl buffer (pH 7.4) containing 0.6 mM EDTA, 30 mM KCl, 0.6 mM DTT, 0.2 mg of bovine serum albumin per ml, 0.2 mg of salmon sperm DNA (TAKARA) per ml, and 10% glycerol. Then, the incubated digests were separated by 4% agarose gel electrophoresis (NuSeive GTG; FMC bioproducts) and stained with ethidium bromide. The arrow indicates the 260-bp fragment which disappeared in lane 2.
In this study, we investigated a function of TraA as a DNA-binding protein and clarified that TraA is bound to and influences the DNA conformation within the ipd-traA intergenic region. Following Northern blot and primer extension analyses, we aim to propose a model which proves that the conformational change of the intergenic region triggers transcriptional control, finally leading to a mating response.
MATERIALS AND METHODS
Bacterial strains, plasmids, and culture conditions.
The bacterial strains and plasmids used in this study are listed in Table 1. OG1X(pAM351) has the same phenotype as OG1X(pPD1) concerning pheromone-inducing cell clumping and plasmid transfer (17). E. faecalis strains were grown in Todd-Hewitt broth (Oxoid) at 37°C. Escherichia coli strains were grown in Luria-Bertani medium at 37°C.
TABLE 1.
Bacterial strains and plasmids used in this study
| Strain or plasmid | Relevant genotype or phenotypea | Comments | Reference or source |
|---|---|---|---|
| E. faecalis | |||
| OG1X | Str | Proteinase-negative derivative of OG1-10 | 17 |
| E. coli | |||
| SURE | e14−(McrA−) Δ(mcrCB-hsdSMR-mrr)171 endA1 supE44 thi-1 gyrA96 relA1 lac recB recJ sbcC umuC::Tn5(Kanr) uvrC [F′ proAB lacqZΔM15 Tn10(Tetr)] | DNA cloning | Stratagene |
| BL-21 | F−ompT hsdS(rB− mB−) gal | Protein expression | Pharmacia Biotech |
| Plasmids | |||
| pPD1 | Bac | 59-kb conjugative plasmid from strain 39-5 | 40 |
| pAM351 | Bac Tet | Derivative of pPD1 with Tn916 | 17 |
| pGEX-6P-1 | Amp | Expression vector for fusion proteins with GST | Pharmacia Biotech |
| pGEX-traA | Amp | PGEX-6P-1 containing the ORF of traA | This study |
| pHH21 | Amp | pUC18 containing 2.3-kb HincII-HincII fragment | 24 |
| pBend2 | Amp | DNA bending vector | 18, 41 |
| pFB0 | Amp | DNA bending vector in this study; pUC18 containing the 0.24-kb EcoRI-HindIII fragment of pBend2 | This study |
| pFB6 | Amp | pFB0 containing the tab1 region | This study |
Str, streptomycin resistance; Bac, bacteriocin production; Tet, tetracycline resistance; Amp, ampicillin resistance.
Peptides.
cPD1 (32) and iPD1 (22, 23) used in this study were manually synthesized by the solid-phase method using the 9-fluorenylmethoxycarbonyl (Fmoc) strategy. Synthesized peptides were cleaved from resins with a cleavage mixture (53% trifluoroacetic acid, 43% dichloromethane, 4% ethanedithiol) and purified by reverse-phase high-performance liquid chromatography with an octyldecyl silane column (Pegasil ODS; Senshu-kagaku, Tokyo, Japan). The concentrations of peptides were calculated from the absorbance at 220 nm with bovine serum albumin as a standard.
Overexpression and purification of the TraA protein.
The traA DNA was amplified by Taq DNA polymerase using pAM351 as a template and the following primers: 5′-GAGGATCCCATTTAAATGAATTAATG-3′ and 5′-GAGAATTCGTTAATCTATTTTTTTGTGG-3′. These primers create the BamHI site at the 5′ end and the EcoRI site at the 3′ end of the traA gene, respectively. The amplified DNA was digested with BamHI and EcoRI and ligated to pGEX-6P-1 (Amersham Pharmacia Biotech), which was digested with the same restriction enzymes, and dephosphorylated with calf intestine alkaline phosphatase (TAKARA; Tokyo, Japan). E. coli BL21 was transformed with this construct, named pGEX-traA. The transformant was grown under appropriate antibiotic selection in 4 liters of medium to an optical density at 660 nm of 0.8 at 37°C. The cells were induced to express a fusion protein of glutathione S-transferase (GST) and TraA by adding isopropyl-β-d-thiogalactopyranoside (10 μM) and were grown for an additional 8 h at 26.5°C. GST-TraA was obtained according to the protocol of Gene Fusion System (Amersham Pharmacia Biotech). About 100 mg of GST-TraA was obtained from cells in 4 liters of culture. The GST-TraA fraction eluted with glutathione was applied to a DEAE-Sepharose column (100 ml in an XK 50/20 column; DEAE-Sepharose Fast Flow; Amersham Pharmacia Biotech) equilibrated with 50 mM Tris-HCl (pH 7.0). The column was washed with buffer, and proteins were eluted with a linear gradient of NaCl from 0 to 0.5 M in a total volume of 250 ml. Fractions containing GST-TraA were pooled and added with Triton X-100 to a final concentration of 0.1% and with dithiothreitol to a concentration of 1 mM. GST-TraA was cleaved with 40 U of PreScission Protease (Amersham Pharmacia Biotech) for 5 days at 4°C. The digested sample was applied to a glutathione-Sepharose 4B column (10 ml; Amersham Pharmacia Biotech) to remove GST moiety and protease. The proteins were dialyzed overnight against 50 mM Tris-HCl (pH 7.0) and applied to a phosphocellulose column (30 ml, P11; Whatman) equilibrated with the same buffer. After the column was washed with buffer containing 0.4 M NaCl, TraA was eluted with 50 ml of the same buffer containing 0.6 M NaCl to yield 1 mg of TraA. This fraction was analyzed with a sodium dodecyl sulfate-polyacrylamide gel, and TraA was observed as a single band by silver staining (Silver Stain Kit II; Wako Chemical Industries, Osaka, Japan). Protein concentrations were determined according to the method of Bradford (6) with bovine serum albumin as a standard.
Gel mobility shift assay.
Gel shift assays were performed with 32P-labeled double strand DNAs as probes. Probe DNAs were amplified by PCR with primers carrying an additional restriction enzyme recognition sequence (CGGGATCCCG for BamHI or GAGTCGAC for SalI), digested with the appropriate restriction enzymes, dephosphorylated with shrimp alkaline phosphatase (Boehringer Mannheim), and labeled with T4 polynucleotide kinase (TAKARA) and [γ-32P]ATP (3,000 Ci/mmol; Muromachi-yakuhin, Tokyo, Japan). Probe DNAs were mixed with TraA in 20 μl of buffer solution (25 mM HEPES-KOH [pH 7.9] containing 0.5 mM EDTA, 50 mM KCl, 0.6 mM dithiothreitol [DTT], 10% glycerol, 0.02% Triton X-100, and 0.1 mg of poly(dI-dC)-poly(dI-dC) [Amersham Pharmacia Biotech]) per ml. The reaction mixture was incubated for 30 min at 25°C, and then the resulting DNA-TraA complex was analyzed by nondenaturing polyacrylamide gel electrophoresis in a 6% gel containing 2.5% glycerol using TGE running buffer (50 mM Tris, 380 mM glycine, 2 mM EDTA [pH 8.5]).
DNase I footprinting.
DNase I footprinting was performed according to a solid phase strategy (30, 31) using a fluorescence DNA sequencer (21, 30). Probe DNAs were amplified with carboxyfluorescein-labeled (FAM-labeled) forward primers and biotin-labeled reverse primers (5′FAM-CTTGAGATAATTTCTCGC-3′ and 5′biotin-GTTACTACTATAGC-3′ for forward chain strand analysis and 5′FAM-GTTACTACTATAGCATT-3′ and 5′biotin-CTTGAGATAATTTCTCGC-3′ for reverse chain strand analysis, respectively). Amplified DNA fragments were immobilized to streptoavidin beads (Dynabeads M-280 streptavidin; DYNAL) for 3 h at room temperature according to the manufacturer's protocol.
Immobilized DNA and TraA were preincubated for 30 min at 25°C in 20 μl of buffer solution [25 mM HEPES-KOH (pH 7.9) containing 0.5 mM EDTA, 50 mM KCl, 50 mM MgCl2, 0.6 mM DTT, 10% glycerol, 0.02% Triton X-100, and 0.1 mg of poly(dI-dC)-poly(dI-dC)per ml]. DNase I digestion was done by adding 0.5 U of DNase I (TAKARA) to the reaction mixture and following incubation for 30 s and stopped by adding 20 μl of 4 M NaCl containing 100 mM EDTA. DNA-immobilized beads in the reaction mixture were sequentially washed with BW buffer (10 mM Tris-HCl [pH 7.5], 1 mM EDTA, 200 mM NaCl) and TE buffer (10 mM Tris-HCl [pH 8.0], 1 mM EDTA). The precipitated beads were suspended in 4 μl of loading buffer (75% formamide, 12.5% GENESCAN 400HD [ROX] size standard [PE Biosystems], 12.5% gel loading dye [500 mg of blue dextran per ml, 25 mM EDTA]), and then DNA fragments were analyzed on a 373S DNA sequencer (PE Biosystems). Gel images were created from screen shots from a Power Macintosh 7500/120.
Circular permutation assay (DNA bending assay).
A DNA fragment including the TraA binding region was amplified by using pAM351 as a template and the following primers: 5′-GATCTAGAATTTTTCCCGGAAAC-3′ and 5′-GATCTAGACAAGTATATGTATTTTA-3′. These primers create an XbaI site at both 5′ and 3′ ends of the TraA binding region. The amplified DNA was digested with XbaI and ligated to pFB0 digested with same restriction enzymes and dephosphorylated with shrimp alkaline phosphatase. This construct, named pFB6, was transformed into E. coli SURE (Stratagene, La Jolla, Calif.). The direction of the insert DNA was determined by DNA sequencing with M13 universal primers to decide the position of tab1 region in DNA probes. DNA fragments containing the TraA binding region at different positions were obtained by digesting pFB6 with each of 10 restriction enzymes (MluI, BglII, ClaI, XhoI, EcoRV, PvuII, SmaI, NruI, RsaI, and BamHI) (18, 41). All restriction enzymes were purchased from TAKARA or Nippon Gene (Tokyo, Japan). The labeling of these fragments and following gel mobility shift assay were performed in the same way as described above in the section “Gel mobility shift assay.”. Bending angles were calculated according to the method described by Thompson (34).
RNA extraction from E. faecalis.
In order to analyze rapid change of mRNA expression levels, total RNA was extracted from pPD1 donor cells by disrupting the cell wall using glass beads instead of cell lysis with lysozyme. Cells in 10 ml of culture were harvested by centrifugation and resuspended in 1 ml of ISOGEN (Nippon Gene). The cell suspension was transferred to a 2-ml tube containing 50 μl of 10% sodium dodecyl sulfate and 0.8 g of glass beads (0.1 mm zirconia-silica beads; BioSpec Products), and the tube was shaken vigorously at 5,000 rpm with a Mini-Beadbeater (Biospec Products) for 1 min and immediately chilled on ice. This procedure was repeated four times. Total RNAs were isolated from these extracts according to the manufacturer's protocol.
Primer extension analysis.
Primer extension analysis was performed according to the protocol described previously (36). Two 30-mer oligonucleotides complementary to open reading frames (ORFs) on pPD1 were labeled with T4 polynucleotide kinase and [γ-32P]ATP and used as primers (5′-TACCTTCATAAAACTTAGCTTGAGATAATT-3′ for traA, 5′-AGAAACAAGAGTTAATATTAGTGCAAACAA-3′ for ipd). Positional markers were prepared by using the same primers as were used in reverse transcription (RT), [α-32P]dCTP, BcaBest DNA sequencing kit (TAKARA), and pHH21, a plasmid containing traA and ipd (24), as a template.
Northern analysis.
Northern analysis was carried out following the previously reported procedure (26) except for the preparation of probes. The probe for analysis of transcription of the traA gene (probe PA) was double-stranded DNA according to the traA ORF amplified by PCR in the presence of [α-32P]dCTP with primers described in the section “Overexpression and purification of TraA protein.” Probes for analysis of the transcription of ipd and its downstream genes (probe PI) were complementary to the ipd mRNA (5′-AGAAACAAGAGTTAATATTAGTGCAAACAA-3′), which is labeled with T4 polynucleotide kinase and [γ-32P]ATP.
RESULTS
Interaction of TraA and traA-ipd intergenic region.
In our previous study, OG1X(pAM351AIM) carrying a deletion of the SpeI-SpeI region (Fig. 1A) lacked the ability to respond to cPD1. It indicated this region to be essential for cPD1 response and suggested that TraA may interact with this region (28). In order to examine the binding ability of TraA for this DNA region, a 2.3-kb HincII-HincII DNA fragment of pPD1 was digested with AluI, incubated with or without TraA, and then analyzed by agarose gel electrophoresis (Fig. 1). A 260-bp band including a traA-ipd intergenic region, which sequence is shown in Fig. 2, disappeared after incubation with TraA (Fig. 1B), suggesting that TraA interacts with the DNA fragment. No band corresponding to the TraA-DNA complex was detected, probably due to its instability in electrophoresis.
FIG. 2.

The 260-bp traA-ipd intergenic region. Primers for the PCR amplification of the probes used for the gel shift assay (see Fig. 3A) are shown by arrows over the nucleotide sequence. A 68-bp fragment (used in Fig. 3B) is indicated with a line under the sequence. TraA binding sites determined by DNase I footprinting are boxed and named tab1, tab2, and tab3. Transcriptional initiation sites of traA and ipd determined by primer extension analysis (see Fig. 6) are indicated by bending arrows. S.D. indicates the putative Shine-Dalgarno sequence. −35 and −10 indicate the putative promoter sequence of ipd and traA.
In order to further examine the interaction of TraA and DNA, a gel mobility shift assay was performed using radiolabeled DNA probes and acrylamide gel containing glycerol. TraA-DNA complex was detected with the probe DNA amplified by PCR with a set of P1 and P3 primers or of P2 and P3 primers (Fig. 3A, lanes 3 to 5 and 7 to 10, respectively). When the P2-P3 probe was digested with DraI, the TraA-DNA complex was not detected (lanes 11 to 15 in Fig. 3A), indicating that TraA bound immediately upstream of a putative −35 promoter. In the case of P1-P3 probe, the TraA-DNA complex migrated more slowly and formed a smear band as the concentration of TraA increased from 25 to 175 μg/ml (Fig. 3A, lanes 3 to 5). On the other hand, in the case of P2-P3 probe, the TraA-DNA complex migrated to the same position under different concentrations of TraA. The amount of complex increased as the concentration of TraA increased from 2.5 to 175 μg/ml (Fig. 3A, lanes 7 to 10).
FIG. 3.

Determination of the TraA binding site by using a gel shift assay. (A) Gel shift assay with TraA. Probes were prepared by PCR amplification with primers shown in Fig. 2: lanes 1 to 5, primers P1 and P3; lanes 6 to 10, primers P2 and P3; lanes 11 to 15, probe P2-P3 digested with DraI. Probes were incubated with the following: lanes 1, 6, and 11, no proteins and peptides; lane 2, 7, and 12, 0.05 μg of TraA; lane 3, 8, and 13, 0.5 μg of TraA; lane 4, 9, and 13, 1 μg of TraA; lane 5, 10, and 15, 3.5 μg of TraA. (B) Effects of cPD1 and iPD1 on mobility of the TraA-DNA complex. Each lane shows the shifted bands (TraA-DNA complexes) in the gel mobility shift assay. A 68-bp 32P-labeled DNA probe containing tab1 sequence was incubated with the following: lane 1, no proteins and peptides; lane 2, TraA only; lane 3, TraA with cPD1; lane 4, TraA with cPD1 and iPD1; lane 5, TraA with iPD1.
When TraA and a probe containing the TraA binding region (from 134 to 202 in Fig. 2) were incubated in the presence of cPD1 or iPD1, the band corresponding to the TraA-DNA complex was detected as well as in the absence of those peptides (Fig. 3B). This suggests that the binding of TraA to this DNA region was not affected by cPD1 or iPD1. However, in the presence of iPD1 (Fig. 3B, lanes 4 and 5), the TraA-DNA complex migrated slightly faster than that incubated with cPD1 (lane 3) or without peptides (lane 2). This suggested that iPD1 changed the conformation of DNA of the TraA-binding region, and this conformational change may be associated with the control of cPD1 response.
Determination of TraA DNA binding sites by DNase I footprinting assay.
DNase I footprinting assays were carried out with a probe corresponding to the traA-ipd intergenic region (Fig. 2 and 4). When the probe was incubated with 1.3 μmol of TraA, a protected region was observed around the DraI recognition site. This protected region was named tab1 (TraA-binding region 1) (Fig. 2). When the probe was incubated with 9.2 μmol of TraA, two other protected regions were observed and termed tab2 and tab3 (Fig. 2). These three footprints were observed in both strands (Fig. 4). These results suggest one strong and two weak TraA-binding sites in the traA-ipd intergenic region. These three protected regions have similarity in sequences (5′-TXXTXAXAATACA-3′, where X is any nucleotide), which might be a TraA binding motif.
FIG. 4.
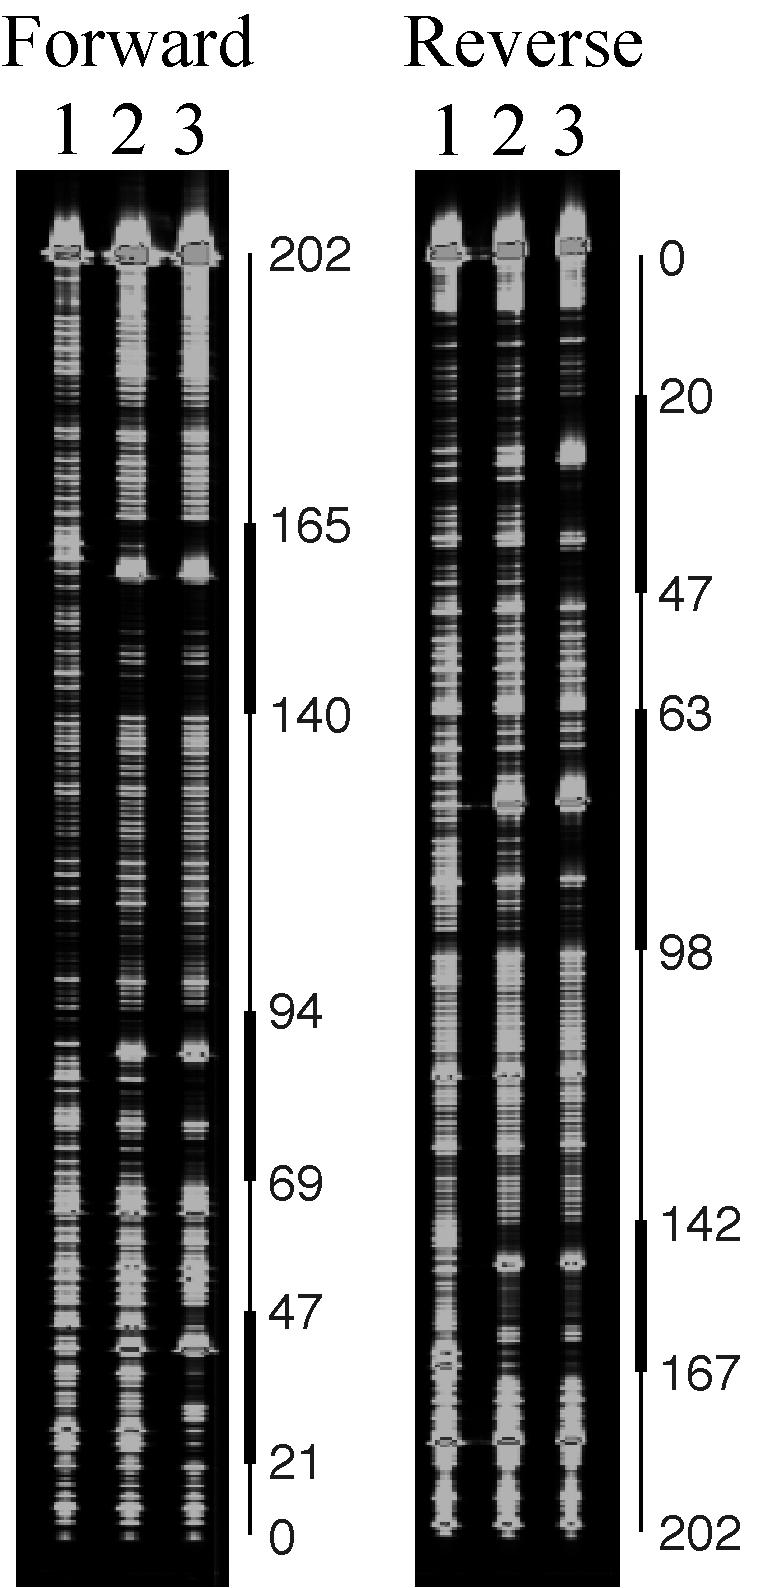
DNase I footprinting. Forward chain (from traA to ipd) and reverse chain (from ipd to traA) analyses are shown. Lanes 1 to 3, double-stranded DNAs were incubated with 0, 1, and 7 μg of TraA, respectively. Protected regions (tab1, tab2, and tab3) are shown in Fig. 2.
Transcriptional analysis of traA and ipd.
The kinetics of traA and ipd expression in cPD1-induced cells was examined by Northern analysis (Fig. 5). A fuzzy band hybridized with the PA probe was detected around the size of 1.5 kb from cPD1-noninduced cells (Fig. 5B). These bands completely disappeared 15 min after cPD1 induction. Alternatively, a 0.5-kb band hybridized with a PI probe was observed in cPD1-induced cells, and it increased gradually in the 60 min after cPD1 induction (Fig. 5C). The 0.5-kb transcript was not observed from cPD1-noninduced cells (Fig. 5C, lane 1); however, when the hybridized membrane was overexposed, it was clearly observed (data not shown). This indicates that a low level of the ipd transcript is expressed in the cPD1-noninduced cells.
FIG. 5.

Northern analysis. E. faecalis OG1X(pAM351) was grown in 10 ml of medium to an optical density at 660 nm of 0.5 at 37°C, and 50 nM of cPD1 was then added to the culture. Probes used are shown in panel A. Probe PA is double-stranded DNA incorporating [α-32P]dCTP. Probe PI is an oligonucleotide labeled with 32P at its 5′ ends. (B and C) Northern analysis of traA (B) and ipd (C). The probes PA and PI were used for traA and ipd, respectively. Arrows indicate sizes of observed transcripts. Lanes 1 to 6 are total RNAs extracted from induced cells in time course (0 [preinduced], 15, 30, 60, 90, and 120 min, respectively).
Transcriptional initiation sites of traA and ipd were determined by primer extension analysis (Fig. 6). RNA was extracted from cells that were either induced by cPD1 or left uninduced and was used as a template for RT. Two primers that were used correspond to respective regions within the ORFs of traA and ipd. The traA primer extension reaction generated a few products with a few bases difference. These products were not detected when RNA from cPD1-induced cells was used as a template, suggesting that transcription of traA was shut down after cPD1 induction. This coincided with the results of the Northern analysis shown in Fig. 5B. The longest product corresponds to a transcript with the 5′-end 163 nucleotides upstream of the ATG translational start codon of the traA structural gene (Fig. 6A). The shorter ones may be degradation products.
FIG. 6.

Primer extension analysis of traA and ipd. Reverse transcripts of traA (A) and ipd (B) by primer extension analysis are shown. Arrowheads indicate the nucleotide position +1. Sequences containing these initiation sites are regions indicated by lines. Lanes A, C, G, and T are positional markers using the same primers. Lanes 0 min and 15 min are reverse transcripts using RNAs from cells 0 and 15 min after induction,.
The primer extension reaction for ipd generated a product corresponding to a transcript with the 5′ end 32 nucleotides upstream of the start codon of the ipd structural gene (Fig. 6B). This product increased when RNA from cPD1-induced cells was used, suggesting upregulation of ipd expression by cPD1 induction. This also coincided with the results of Northern analysis. The transcripts of traA and ipd overlapped for 15 bases at their 5′ ends (Fig. 2). Taken together with the result of Northern blot analysis, transcription of ipd terminated immediately downstream of an inverted repeat as shown in Fig. 5A.
DNA bending mediated by TraA.
From the results that the TraA-DNA complex migrated slightly faster in the presence of iPD1 than it did in the presence of cPD1 or without those peptides, it was conceivable that conformational change, most likely DNA bending, of the TraA DNA binding region occurred in response to cPD1 and iPD1. In a DNA-bending assay, a set of DNA fragments that carried the tab1 region was used. These fragments differed from each other in the distance between the tab1 region and 5′ end (Fig. 7). TraA-DNA complexes exhibited a position-dependent mobility, suggesting that DNA bending occurred in the presence of TraA. The angle of the DNA bending was estimated by using the equation μM/μE = cos(α/2), where μM and μE represent the gel mobilities of molecules with bends at their centers and ends, respectively, and α is the angle by which the DNA departs from linearity (34). Using the mobilities of the slowest- and fastest-migrating complexes as data, this equation predicted that the complexes with TraA have only a 57° bend. Subsequently, these experiments were repeated as described above in the presence of cPD1 or iPD1. The angle was changed to 53 and 43° with cPD1 and iPD1, respectively. These results suggested that TraA controlled transcriptions of traA and ipd by changing the bending angle of the tab1 region.
FIG. 7.

DNA bending in TraA-DNA complex. (A) Probes used in DNA bending assay. Each probe contains a 40-bp DNA fragment (position at 131 to 170) of pPD1 at different positions. Probes 1 to 10 were digested fragments of pFB6, a plasmid containing the tab1 region, using 10 restriction enzymes. The length of these probes was about 200 bp. (B to D) Electrophoretic pattern of TraA-DNA complexes in DNA bending assay. Lanes 1 to 10 are probes 1 to 10, respectively, incubated with TraA. Probes were incubated with TraA only (B), TraA plus cPD1 (C), and TraA plus iPD1 (D) are shown. Angles of DNA bending were calculated from mobilities of lanes 6 and 10.
DISCUSSION
The Northern blot analysis and primer extension analysis have shown that the ipd transcript starts from the promoter region located in the traA-ipd intergenic region and is terminated around the downstream region of the inverted repeat (Fig. 5 and 6). There is no other ORF-like sequence except for iPD1 in the 0.5-kb ipd-transcribed region. The amount of iPD1 in the culture filtrate of donor cells grown in the presence or absence of cPD1 had previously been measured (unpublished data); this level of iPD1 secreted into medium increased only twofold in the presence of cPD1, even though ipd RNA was greatly induced by cPD1 (Fig. 5C). From this observation, it is likely that the ipd RNA functions as not only mRNA but also a functional RNA molecule such as prgQ encoded by pCF10 (19). It has been known that prgQ is transcribed as QS (small) RNA or QL (large) RNA in the absence or presence of cCF10, and it has been suggested that QL induces the expression of the AS gene, prgB, together with ribosomes, and PrgS RNA that stabilizes binding of QL RNA to ribosomes.
Northern analysis has also shown that the expression of traA is downregulated by cPD1. TraA is a negative regulator in the cPD1 signaling pathway, suggesting that the downregulation of traA should result in derepression by TraA. Hence a two-step regulation model is proposed; at the first step, the expression of ipd is triggered by DNA bending, and at the second step, the expression of ipd is further induced from the TraA-free promoter. Indeed, the ipd transcript was gradually increased within 1 h after cPD1 induction. Furthermore, this coincided with the fact that a traA insertion mutant constitutively expresses ipd at a maximum level even under the cPD1-noninduced condition (unpublished data).
Primer extension analysis of traA showed that the transcription initiates within the traA-ipd intergenic region. Taken together with the data from Northern blot analysis, the transcript would be read through to traB. In order to clarify the initiation and termination sites of traA, RT-PCRs with some sets of specific primers were performed (data not shown). The result suggested another possibility, that the transcript initiates from the region downstream from ipd although the intensity of the RT-PCR product was very low compared to that initiating from the intergenic region and the band corresponding to the transcript through to traB was also detected. The fact that the transcription of pheromone receptor is initiated from the inhibitor downstream region was found for the cCF10 system. It might be the case that the traA mRNA was quite unstable and the product detected in the primer extension analysis was a degradation product from intact mRNA initiating from the ipd downstream region.
A previous study on pAD1 (12) has demonstrated that pAD1 TraA associated with cAD1 loses its affinity to DNA and, as a consequence, releases the negative regulation (5). By contrast, the gel mobility shift assay in this study demonstrated that the DNA-binding affinity of pPD1 TraA remained unchanged in the presence of cPD1 or iPD1. This has also been demonstrated with the use of a solution: biotinylated DNA corresponding to the traA-ipd intergenic region bound to TraA both in the presence and in the absence of cPD1 (J. Nakayama, T. Horii, Y. Takananami, S. Shino, and A. Suzuki, Abstr. ASM Conf. Streptococcal Genet., abstr. 1B-03, 1998). The gel mobility shift assay suggested that the conformation of the TraA-DNA complex changed in the presence of cPD1 from that in the presence of iPD1. The DNA-bending assay revealed that the bending angle of the tab1 region was slightly enhanced in the presence of cPD1. This conformational change of tab1 is most likely to contribute to the transcriptional control of ipd and also traA.
The DNase I footprinting assay indicated one strong (tab1) and two weak TraA-binding sites (tab2 and tab3) in the traA-ipd intergenic region. Binding of TraA to tab1 was clearly observed in the gel mobility shift assay, although binding to tab2 and tab3 was negligible (data not shown), suggesting that the affinity of TraA to these two sites is much lower than that to tab1. These observations resemble those for the transcriptional control of occQ with OccR in Agrobacterium tumefaciens, in which OccR binds to and bends an operator region located in an intergenic region of occR and occQ and its bending angle changes irrespective of the presence of octopine (37, 38). The operator region contains two subsites, and dimers of OccR bind to these subsites. The first (high-affinity) subsite is essential and sufficient for OccR binding, and the second subsite is required for ligand-responsive DNA bending, in which one dimer shifts the binding position by one helical turn. Although, in the case of TraA, the tab1 site is sufficient for TraA DNA binding and also TraA DNA bending, tab2 and tab3 sites may have a function similar to that of the second subsite of the OccR operator. Recently it has been reported that a TraA-homologous DNA-binding protein encoded by pCF10, PrgX, exists as a dimer in vivo and the control of oligomerization can be related to pheromone response (3, 4). It has also been found that TraA has a tendency to oligomerize or aggregate in the presence of cPD1 in vitro (Nakayama et al., ASM Conf. Streptococcal Genet.). However, the gel mobility shift assay in this study did not show a considerable change in the migration of the TraA-DNA complex in the presence of cPD1, suggesting no change in the oligomerization form. Each TraA molecule bound to tab1, tab2, and possibly tab3 may interact, thus resulting in a change in conformation of the intergenic region and regulation of ipd and traA expressions. Indeed, when P1-P3 probe including the three binding sites was used for the gel mobility shift assay, the TraA-DNA complex migrated more slowly and formed smear bands with an increased concentration of TraA (Fig. 3A, lanes 3 to 5). Further studies with the P2-P3 probe and TraA should indicate further the mechanism by which the transcriptions of ipd and traA are controlled.
Finally, a model throughout cPD1 signal transduction was proposed. In the absence of recipient cells, the donor cells secrete iPD1, which is incorporated into donor cells again and bound to TraA. The TraA-iPD1 complex binds to the traA-ipd intergenic region and bends this DNA. In this state, both ipd and traA are expressed at a low level. When recipient cells secreting cPD1 become donor cells, the given cPD1 outcompetes iPD1 and replaces iPD1 on TraA. The TraA-cPD1 complex changes the bending angle of this intergenic region, which leads to downregulation of traA and upregulation of ipd. As time progresses, active TraA molecules decrease and the ipd promoter is derepressed, which induces full ipd expression, leading to the high level of AS gene expression required for stable mating.
Acknowledgments
We thank D. B. Clewell for E. faecalis strains, Sarah Poole for helpful comments on English in the manuscript, and National Institute of Genetics (Shizuoka, Japan) for pBend2.
This work was supported in part by a Grant-in-Aid for Scientific Research (no. 09760112) from the Ministry of Education, Culture, Sports, Science and Technology of Japan.
REFERENCES
- 1.An, F. Y., and D. B. Clewell. 2002. Identification of the cAD1 sex pheromone precursor in Enterococcus faecalis. J. Bacteriol. 184:1880-1887. [DOI] [PMC free article] [PubMed] [Google Scholar]
- 2.Antiporta, M. H., and G. M. Dunny. 2002. ccfA, the genetic determinant for the cCF10 peptide pheromone in Enterococcus faecalis. J. Bacteriol. 184:1155-1162. [DOI] [PMC free article] [PubMed] [Google Scholar]
- 3.Bae, T., and G. M. Dunny. 2001. Dominant-negative mutants of prgX: evidence for a role for PrgX dimerization in negative regulation of pheromone-inducible conjugation. Mol. Microbiol. 39:1307-1320. [DOI] [PubMed] [Google Scholar]
- 4.Bae, T., B. Kozlowicz, and G. M. Dunny. 2002. Two targets in pCF10 DNA for PrgX binding: their role in production of Qa and prgX mRNA and in regulation of pheromone-inducible conjugation. J. Mol. Biol. 315:995-1007. [DOI] [PubMed] [Google Scholar]
- 5.Bastos, M., H. Tomita, K. Tanimoto, and D. B. Clewell. 1998. Regulation of the Enterococcus faecalis pAD1-related sex pheromone response: analyses of traD expression and its role in controlling conjugation functions. Mol. Microbiol. 30:381-392. [DOI] [PubMed] [Google Scholar]
- 6.Bradford, M. M. 1976. A rapid and sensitive method for the quantification of microgram quantities of protein utilizing the principle of protein-dye binding. Anal. Biochem. 72:248-254. [DOI] [PubMed] [Google Scholar]
- 7.Clewell, D. B. 1999. Sex pheromone systems in enterococci, p.47-65. In G. M. Dunny and S. C. Winans (ed.), Cell-cell signaling in bacteria. American Society for Microbiology, Washington, D.C.
- 8.Clewell, D. B., F. Y. An, S. E. Flannagan, M. Antiporta, and G. M. Dunny. 2000. Enterococcal sex pheromone precursors are part of signal sequences for surface lipoproteins. Mol. Microbiol. 35:246-247. [DOI] [PubMed] [Google Scholar]
- 9.Dunny, G. M., M. H. Antiporta, and H. Hirt. 2001. Peptide pheromone-induced transfer of plasmid pCF10 in Enterococcus faecalis: probing the genetic and molecular basis for specificity of the pheromone response. Peptides 22:1529-1539. [DOI] [PubMed] [Google Scholar]
- 10.Dunny, G. M., C. Funk, and J. Adsit. 1981. Direct stimulation of the transfer of antibiotic resistance by sex pheromones in Streptococcus faecalis. Plasmid 6:270-278. [DOI] [PubMed] [Google Scholar]
- 11.Fujimoto, S., H. Tomita, E. Wakamatsu, and Y. Ike. 1995. Physical mapping of the conjugative bacteriocin plasmid pPD1 of Enterococcus faecalis and identification of the determinant related to the pheromone response. J. Bacteriol. 177:5574-5581. [DOI] [PMC free article] [PubMed] [Google Scholar]
- 12.Fujimoto, S., and D. B. Clewell. 1998. Regulation of the pAD1 sex pheromone response of Enterococcus faecalis by direct interaction between the cAD1 peptide mating signal and the negatively regulating, DNA-binding TraA protein. Proc. Natl. Acad. Sci. USA 95:6430-6435. [DOI] [PMC free article] [PubMed] [Google Scholar]
- 13.Galli, D., A. Friesenegger, and R. Wirth. 1992. Transcriptional control of sex-pheromone-inducible genes on plasmid pAD1 of Enterococcus faecalis and sequence analysis of a third structural gene for (pPD1-Encode) aggregation substance. Mol. Microbiol. 6:1297-1308. [DOI] [PubMed] [Google Scholar]
- 14.Galli, D., and R. Wirth. 1990. Sequence analysis of Enterococcus faecalis aggregation substance encoded by the sex pheromone plasmid pAD1. Mol. Microbiol. 4:895-904. [DOI] [PubMed] [Google Scholar]
- 15.Galli, D., and R. Wirth. 1991. Comparative analysis of Enterococcus faecalis sex pheromone plasmids identifies a single homologous DNA region which codes for aggregation substance. J. Bacteriol. 173:3029-3033. [DOI] [PMC free article] [PubMed] [Google Scholar]
- 16.Hirt, H., G. Wanner, D. Galli, and R. Wirth. 1993. Biochemical, immunological and ultrastructural characterization of aggregation substances encoded by Enterococcus faecalis sex-pheromone plasmids. Eur. J. Biochem. 211:711-716. [DOI] [PubMed] [Google Scholar]
- 17.Ike, Y., R. A. Craig, B. A. White, Y. Yagi, and D. B. Clewell. 1983. Modification of Streptococcus faecalis sex pheromones after acquisition of plasmid DNA. Proc. Natl. Acad. Sci. USA 80:5369-5373. [DOI] [PMC free article] [PubMed] [Google Scholar]
- 18.Kim, J., C. Zwieb, C. Wu, and S. Adhya. 1989. Bending of DNA by gene-regulatory proteins: construction and use of a DNA bending vector. Gene 85:15-23. [DOI] [PubMed] [Google Scholar]
- 19.Leonard, B. A., B. A. Bensing, P. J. Hedberg, R. E. Ruhfel, J. W. Chung, and G. M. Dunny. 1995. Pheromone-inducible gene regulation and signaling for the control of aggregation substance expression in the conjugative plasmid pCF10. Dev. Biol. Stand. 85:27-34. [PubMed] [Google Scholar]
- 20.Leonard, B. A., A. Podbielski, P. J. Hedberg, and G. M. Dunny. 1996. Enterococcus faecalis pheromone binding protein, PrgZ, recruits a chromosomal oligopeptide permease system to import sex pheromone cCF10 for induction of conjugation. Proc. Natl. Acad. Sci. USA 93:260-264. [DOI] [PMC free article] [PubMed] [Google Scholar]
- 21.Machida, M., H. Kamio, and D. Sorenson. 1997. Long-range and highly sensitive DNase I footprinting by an automated infrared DNA sequencer. BioTechniques 23:300-303. [DOI] [PubMed] [Google Scholar]
- 22.Mori, M., H. Tanaka, Y. Sakagami, A. Isogai, M. Fujino, C. Kitada, D. B. Clewell, and A. Suzuki. 1987. Isolation and structure of the sex pheromone inhibitor, iPD1, excreted by Streptococcus faecalis donor strains harboring plasmid pPD1. J. Bacteriol. 169:1747-1749. [DOI] [PMC free article] [PubMed] [Google Scholar]
- 23.Nakayama, J., G. M. Dunny, D. B. Clewell, and A. Suzuki. 1995. Quantitative analysis for pheromone inhibitor and pheromone shutdown in Enterococcus faecalis. Dev. Biol. Stand. 85:35-38. [PubMed] [Google Scholar]
- 24.Nakayama, J., K. Yoshida, H. Kobayashi, A. Isogai, D. B. Clewell, and A. Suzuki. 1995. Cloning and characterization of a region of Enterococcus faecalis plasmid pPD1 encoding pheromone inhibitor (ipd), pheromone sensitivity (traC), and pheromone shutdown (traB) genes. J. Bacteriol. 177:5567-5573. [DOI] [PMC free article] [PubMed] [Google Scholar]
- 25.Nakayama, J., T. Horii, and A. Suzuki. 1999. Bacterial peptide pheromone is improved where it directly binds to an intracellular receptor, p.215-217. In Y. Shimonishi (ed.), Peptide science—present and future. Proceedings of the 1st International Peptide Symposium, 1997. Kluwer Academic Publishers, Dordrecht, The Netherlands.
- 26.Nakayama, J., Y. Cao, T. Horii, S. Sakuda, A. D. L. Akkermans, W. M. de Vos, and H. Nagasawa. 2001. Gelatinase biosynthesis activating pheromone: a peptide lactone that mediates a quorum sensing in Enterococcus faecalis. Mol. Microbiol. 41:145-154. [DOI] [PubMed] [Google Scholar]
- 27.Nakayama, J., Y. Takanami, T. Horii, S. Sakuda, and A. Suzuki. 1998. Molecular mechanism of peptide-specific pheromone signaling in Enterococcus faecalis: functions of pheromone receptor TraA and pheromone-binding protein TraC encoded by plasmid pPD1. J. Bacteriol. 180:449-456. [DOI] [PMC free article] [PubMed] [Google Scholar]
- 28.Nakayama, J., and A. Suzuki. 1997. Genetic analysis of plasmid-specific pheromone signaling encoded by pPD1 in Enterococcus faecalis. Biosci. Biotechnol. Biochem. 61:1796-1799. [DOI] [PubMed] [Google Scholar]
- 29.Oliver, D. R., B. L. Brown, and D. B. Clewell. 1977. Characterization of plasmids determining hemolysin and bacteriocin production in Streptococcus faecalis. J. Bacteriol. 130:948-950. [DOI] [PMC free article] [PubMed] [Google Scholar]
- 30.Sandaltzopoulos, R., W. Ansorge, P. B. Becker, and H. Voss. 1994. Nonradioactive, solid-phase DNase I footprints analyzed on an A.L.F. DNA sequencer. BioTechniques 17:474-477. [PubMed] [Google Scholar]
- 31.Sandaltzopoulos, R., and P. B. Becker. 1994. Solid phase DNase I footprinting: quick and versatile. Nucleic Acids Res. 22:1511-1512. [DOI] [PMC free article] [PubMed] [Google Scholar]
- 32.Suzuki, A., M. Mori, Y. Sakagami, A. Isogai, M. Fujino, C. Kitada, R. A. Craig, and D. B. Clewell. 1984. Isolation and structure of bacterial sex pheromone, cPD1. Science 226:849-850. [DOI] [PubMed] [Google Scholar]
- 33.Tanimoto, K., H. Tomita, and Y. Ike. 1996. The traA gene of the Enterococcus faecalis conjugative plasmid pPD1 encodes a negative regulator for the pheromone response. Plasmid 36:55-61. [DOI] [PubMed] [Google Scholar]
- 34.Thompson, J. F., and A. Landy. 1988. Empirical estimation of protein-induced DNA bending angles: applications to lambda site-specific recombination complexes. Nucleic Acids Res. 16:9687-9705. [DOI] [PMC free article] [PubMed] [Google Scholar]
- 35.Tomich, P. K., F. Y. An, S. P. Damle, and D. B. Clewell. 1979. Plasmid-related transmissibility and multiple drug resistance in Streptococcus faecalis subsp. zymogenes strain DS16. Antimicrob. Agents Chemother. 15:828-830. [DOI] [PMC free article] [PubMed] [Google Scholar]
- 36.Triezenberg, S. G. 1992. Primer extension, chapter 4.8. In F. M. Ausubel, R. Brent, R. E. Kingston, D. D. Moore, J. G. Seidman, J. A. Smith, and K. Struhl (ed.), Current protocols in molecular biology. Wiley Interscience, New York, N.Y.
- 37.Wang, L., J. D. Helmann, and C. Winans. 1992. The A. tumefaciens transcriptional activator OccR causes a bend at a target promoter, which is partially relaxed by a plant tumor metabolite. Cell 69:659-667. [DOI] [PubMed] [Google Scholar]
- 38.Wang, L., and S. C. Winans. 1995. The sixty nucleotide OccR operator contains a subsite essential and sufficient for OccR binding and a second subsite required for ligand-responsive DNA bending. J. Mol. Biol. 253:691-702. [DOI] [PubMed] [Google Scholar]
- 39.Waters, C. M., and G. M. Dunny. 2001. Analysis of functional domains of the Enterococcus faecalis pheromone-induced surface protein aggregation substance. J. Bacteriol. 183:5659-5667. [DOI] [PMC free article] [PubMed] [Google Scholar]
- 40.Yagi, Y., R. E. Kessler, J. H. Show, D. E. Lopatin, F. Y. An, and D. B. Clewell. 1983. Plasmid content of Streptococcus faecalis strain 39-5 and identification of a pheromone (cPD1)-induced surface antigen. J. Gen. Microbiol. 129:1207-1215. [DOI] [PubMed] [Google Scholar]
- 41.Zwieb, C., J. Kim, and S. Adhya. 1989. DNA bending by negative regulatory proteins: Gal and Lac repressors. Genes Dev. 3:606-611. [DOI] [PubMed] [Google Scholar]