

Abstract
The role of cytosolic ATP in exocytosis was investigated by using amperometric measurement of insulin exocytosis in pancreatic beta cells, which were stimulated with photolysis of caged Ca2+ compounds. Insulin exocytosis occurred with two rates. We found that ATP hastened and augmented the exocytosis via selective enhancement of the exocytosis with the faster rate. A nonhydrolysable analog of ATP, adenosine 5′-O-(3-thiotriphosphate), which blocks ATPase, was even more effective than ATP, indicating that the phosphorylation event occurred downstream of ATP-dependent vesicle transportation and priming. The action of ATP was eliminated by a competitive antagonist of cAMP, and by an inhibitor of adenylate cyclase. These data characterize an ATP sensing mechanism for the Ca2+-dependent exocytosis involving adenylate-cyclase, cAMP-dependent protein kinase, and, possibly, the fusion machinery itself. Thus, the fast exocytotic machinery requires both phosphorylation and Ca2+ for the final triggering and likely constitutes a distal ATP sensor for insulin exocytosis that acts in concert with ATP-sensitive K+ channels.
The process of Ca2+-dependent exocytotic secretion includes multiple ATP-dependent steps (1). Hydrolysis of ATP serves as a source of energy for motor proteins that transport secretory vesicles from the trans-Golgi network to the plasma membrane. Other types of ATPases, such as the N-ethylmaleimide-sensitive fusion protein, also are required for the priming of secretory vesicles for fusion at the plasma membrane (2, 3). In addition, various kinases use ATP as a phosphate donor to regulate secretion (1). The role of phosphorylation in Ca2+-dependent exocytosis has been studied intensively in sensory neurons of Aplysia (4) as well as in the mammalian hippocampus (5, 6). In pancreatic beta cells, the contribution of cAMP-dependent kinase [protein kinase A (PKA)] to insulin secretion has been suggested to be relevant to the etiology of diabetes mellitus (7, 8). However, although exocytosis depends in part on the cytosolic concentration of ATP in beta cells (9–12), it is not clear how the actions of ATP are mediated. Furthermore, although protein kinases have been suggested to modulate the secretory machinery in both neurons and endocrine cells (4, 8), it is not known whether phosphorylation regulates exocytosis at a step downstream of transportation and priming of vesicles, processes that require ATP hydrolysis, or whether phosphorylation modifies the kinetics of the fusion reaction (4, 13, 14).
We now have investigated the exocytosis of insulin vesicles in primary pancreatic beta cells stimulated with rapid increases in the cytosolic Ca2+ concentration ([Ca2+]i), or Ca2+ jumps, produced by flash photolysis of caged-Ca2+ compounds. This artificial stimulation avoids the complex spatiotemporal gradients of [Ca2+]i that are associated with natural stimulation, and it allows the direct investigation of fusion reactions downstream of the Ca2+ trigger (15). We measured exocytosis by the amperometric detection of serotonin that had been loaded into the insulin-containing, large dense-core vesicles (LVs) of beta cells (16, 17), an approach that is both highly reliable and provides the greatest time resolution of available methods. Unlike measurements of membrane capacitance (17–20), the amperometry is affected neither by concurrent endocytosis nor exocytosis of vesicles other than LVs (15, 17, 21, 22). The role of phosphorylation in exocytosis thus was examined in perfused cells in the whole-cell mode, which allowed the concentrations of nucleotides to be controlled precisely.
MATERIALS AND METHODS
Preparation of Beta Cells and Solutions.
We prepared cultured mouse beta cells as described (17). The cells were whole-cell clamped (-65 mV) at room temperature (20–25°C), unless otherwise stated. The bathing solution contained 150 mM NaCl, 5 mM KCl, 1 mM MgCl2, 2 mM CaCl2, 10 mM Hepes-NaOH (pH 7.4), and 2.5 mM glucose. Forskolin (Sigma), adenosine 3′, 5′-monophosphothioate (Rp-cAMP, Calbiochem), or H89 (Calbiochem) was added to the bathing solution 5–20 min before whole-cell recording. Forskolin and H89 first were dissolved into dimethyl sulfoxide at concentrations of 10 and 20 mM, respectively. Capacitance measurement was performed as described (23). The internal solution contained 50 mM Hepes-CsOH (pH 7.2), 100 mM cesium glutamate, 5 mM CsCl, 0.2 mM benzothiazole coumarin (Molecular Probes), and 0.2 mM GTP. ATP (disodium salt; Sigma), adenosine 5′-O-(3-thiotriphosphate) (ATP[γS], Sigma), or 5′-adenylyl-β,γ-imidodiphosphate (AMP-PNP), tetrasodium salt (ICN) was added to the internal solution together with MgCl2 so that the free Mg2+ concentration was maintained at 1 mM. cAMP (Sigma) or cis-N-(as-2-phenylcyclopentyl)azacyclo-tridecan-2-imine hydrochloride (MDL-12,330A, Calbiochem) also were added in the internal solution. For the induction of Ca2+ jumps in response to ultraviolet irradiation, either 10 mM 2-nitrophenyl–EGTA [O, O′-bis(2-aminoethyl) ethyleneglycol-N,N,N′,N′-tetraacetic acid] (tetrapotassium salt; Molecular Probes) plus 5 mM CaCl2 or 9 mM dimethoxynitrophenyl-EGTA-4 (DMNPE-4) (24) plus 5 mM CaCl2 also was included in the internal solution. The osmolarity of the internal solutions was ≈320 mM after all additions. The mean access resistance was 6.9 ± 3.0 megaohms.
Measurement of [Ca2+]i and Photolysis of Caged-Compounds.
Dual-wavelength ratiometric fluorimetry was performed with the long-wavelength Ca2+ indicator benzothiazole coumarin (17, 23). Photolysis of caged-Ca2+ compounds was induced with a xenon flash lamp (High-Tech Instruments, London, U.K.) (23). The amplitude of the Ca2+ jumps produced by dimethoxynitrophenyl-EGTA-4 was about twice that of those produced by DMNPE-4; however, no significant difference was detected so far as the increases in [Ca2+]i were >10 μM.
Amperometric Measurements.
For the real-time measurement of LV exocytosis, beta cells were maintained for 6–8 hr in culture medium containing 0.5 mM serotonin and 0.5 mM 5-hydroxytryptophan before recording (16). Amperometric currents were filtered at 40 Hz and were sampled at 83 Hz. The histograms for the latency distribution of the secretory events were constructed from 7 to 81 amperometric traces under each experimental condition; they are displayed with a bin width of 0.5 s and are normalized by the corresponding cell number (Fig. 1C). The latency of each amperometric event was defined as the time between the onset of the Ca2+ jump and that of the amperometric current. In instances in which individual quantal events occurred so frequently that they overlapped each other, we estimated the number of events by dividing the total amperometric charge by the averaged charge of single quantal events. The average of the single quantal events was calculated from 5 to 20 such events in the same amperometric trace. The time course of exocytosis thus obtained must be retarded by the time of diffusion of serotonin from release sites to the carbon fiber electrode. This diffusional delay was estimated to be ≈20–50 ms in our simulation, and it should not significantly affect the slow time course of LV exocytosis in beta cells with time constants of >900 ms (Fig. 5A).
Figure 1.

Effects of cytosolic ATP on Ca2+-induced exocytosis in pancreatic beta cells. (A and B) Amperometric measurements of LV exocytosis from single pancreatic beta cells in the absence (A) or presence (B) of cytosolic ATP (3 mM). The lower traces show [Ca2+]i measured in the same cells. Iamp, amperometric current; UV, ultraviolet irradiation. (C) Amperometric latency histograms constructed from cells perfused with 0 mM (Top), 1 mM (Middle), or 3 mM (Bottom) ATP. Smooth curves represent maximum likelihood fitting of the histograms with a double-exponential density function (see Materials and Methods). (D) The fraction of amperometric events occurring within 2.5 s after the onset of Ca2+ jumps, m2.5, plotted against the cytosolic [ATP]. The smooth curve represents a theoretical curve with a half-maximal concentration (K0.5) of 0.5 mM. Data are means ± SEM. ∗, P < 0.01 vs. the value for 0 mM ATP. (E) ATP dependence of the number of amperometric events per cell corresponding to mode 1 and mode 2 of LV exocytosis as obtained from curve fitting indicated in C. Error bars represent SEM (see Materials and Methods). ∗, P < 0.01 vs. the value for 0 mM ATP.
Figure 5.

Regulation by ATP of the mode-1 LV exocytotic pathway in beta cells. (A) Semilogarithmic plots of amperometric latency histograms. Data are from cells perfused with 3 mM ATP[γS] (open circles), 3 mM ATP (open triangles), 0 mM ATP (open squares), or AMP-PNP (closed diamonds), as well as from those pretreated with Rp-cAMP before perfusion with 3 mM ATP (closed squares). Blue and dashed lines indicate the mode-1 and mode-2 components, respectively. (B) The mode-1 LVs, which constitute 90% of fusion-ready LVs in resting beta cells, require cAMP-dependent phosphorylation in addition to Ca2+ for the final triggering of exocytosis. Both adenylate cyclase and PKA confer ATP dependence on mode-1 exocytosis and act as the final ATP sensor. This model predicts that the ATP sensitivity of exocytosis can be modulated by the activities of various components of the cAMP signaling cascade (blue), including G proteins (Gs or Gi) and G protein coupled receptors (Rs or Ri).
From each latency histogram, the fraction (m2.5) of events that appeared between 0 and 2.5 s from the onset of the Ca2+ jump was obtained. The SEM of m2.5 was calculated as 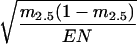 , where EN represents the total number of events in a histogram. The amperometric latency histograms were fitted with probability density functions that contain two major exponential components:
 |
1 |
where integrals of the first and second exponential functions are given by m1 and (1 − m1), respectively. Amperometric latency histograms were fitted with the density function, q(t), with the maximum likelihood method by adjusting the values for m1, τ0, τ1, and τ2. The values of the three time constants were always between 0.5 and 0.7 s for τ0, 0.7 and 1.1 s for τ1, and 8 and 11 s for τ2, irrespective of the experimental conditions for Figs. 1–4. Because these variabilities were considered not significant (Fig. 5A), we fixed τ0, τ1, and τ2 as 0.5, 0.9, and 9 s, respectively. The number of events per cell for the component with τ1 = 0.9 (mode 1), and that with τ2 = 9 (mode 2) was calculated by multiplying m1 and (1 − m1) by EN/cell, where EN/cell represents the mean number of events per cell. We included only those cells that showed at least one quantal event. The SEM of m1 was calculated numerically from  (25). SEM of the number of events per cell for mode 1 and mode 2 was obtained by multiplying the SEM of m1 by EN/cell. The significance of differences in the number of mode-1 or mode-2 events per cell was assessed with the two-tailed t test. Statistical comparisons were performed with data obtained from the same series of cultures. A P value of <0.01 was considered statistically significant.
Figure 4.

ATP dependence of the effects of cAMP on LV exocytosis. (A and B) Amperometric latency histograms and examples of amperometric traces (Insets) for cells perfused in the whole-cell mode with 0.5 mM ATP in the absence (A) or presence (B) of 0.2 mM cAMP. (C) [ATP] dependence of the number of mode-1 events per cell in the absence of presence of 0.2 mM cAMP. ∗, P < 0.01 vs. the corresponding value in the absence of cAMP. The number of mode-2 events per cell was not affected significantly by cAMP. (D) Block of the action of ATP by MDL-12,330A and its removal by inclusion of cAMP in the pipette. ∗, P < 0.01 vs. the corresponding value in the control condition with 3 mM ATP.
RESULTS
Enhancement of LV Exocytosis by Cytosolic MgATP.
Exocytosis in pancreatic beta cells was quantified by amperometric measurement of quantal secretion of serotonin from the LVs of single cells voltage-clamped in the whole-cell mode (17). Shortly (1.5–2.5 min) after the onset of whole-cell perfusion, exocytosis was triggered by instantaneous and spatially uniform increases in [Ca2+]i induced by flash photolysis of the caged-Ca2+ compounds 2-nitrophenyl–EGTA or dimethoxynitrophenyl-EGTA-4 (24, 26). Increases in [Ca2+]i of >10 μM were applied, so that the kinetics of exocytosis mostly represent stages downstream of Ca2+ binding to putative Ca2+ sensors (17). The rate and extent of exocytosis of LVs were enhanced markedly by the presence of ATP in the patch pipette (Fig. 1 A and B). Specifically, the quantal secretion of serotonin was apparent more frequently and earlier in the presence of 3 mM ATP (Fig. 1B) than in the absence of ATP (Fig. 1A).
The rate and amplitude of LV exocytosis were quantified by constructing amperometric latency histograms from many beta cells (Fig. 1C). The rate of exocytosis can be quantified simply by calculating the fraction of amperometric events (m2.5) that occurred within 2.5 s of the onset of the Ca2+ jump relative to the total number of events detected within 30 s. The value of m2.5 depended on ATP concentration ([ATP]): m2.5 was 0.41 ± 0.06 (mean ± SEM, n = 25) and 0.65 ± 0.02 (n = 81) in the absence and presence of 3 mM ATP, respectively, and a half-maximal effect was attained at 0.5 mM (Fig. 1D). Similar stimulatory effect of ATP was demonstrated when the experiments were carried out at 33°C: m2.5 was 0.30 ± 0.08 (mean ± SEM, n = 7) and 0.81 ± 0.02 (n = 10, P < 0.01) in the absence and presence of 3 mM ATP, respectively. The stronger effect of ATP at higher temperature is consistent with the results obtained by using the capacitance measurement (27).
The time courses of amperometric latency histograms were analyzed further by fitting with a function comprising two major exponential components (see Materials and Methods). The latency histograms could be approximated well by the function with time constants of 0.9 and 9 s, irrespective of [ATP] (Fig. 1C): Semilogarithmic plots of the latency histograms indicated that the time constants of exocytosis were essentially unaffected by [ATP] (see Fig. 5A). Plots of the mean number of amperometric events corresponding to each of the two components revealed that the action of ATP was largely attributable to an increase in the extent of the fast component of LV exocytosis (mode 1), with the extent of the slow component (mode 2) remaining relatively constant (Fig. 1E). A half-maximal concentration (K0.5) of ATP on the mode-1 exocytosis was ≈0.5 mM (Fig. 1E).
Our observations are consistent with the previous results obtained with capacitance measurement: ATP or PKA selectively augmented a component of capacitance increase that appears >0.5 s after Ca2+ jump (Fig. 6 A and B of ref. 19; Fig. 6 A and B of ref. 20). Such late component of capacitance increase was associated with amperometric events (Fig. 4 of ref. 17), and the majority of the mode-1 events appeared >0.5 s after the Ca2+ jumps (Figs. 1–5). Thus, the augmentation in the late capacitance increase reported in the previous studies (19, 20) corresponds to the augmentation in the mode-1 events in the present study. We have confirmed that the late capacitance increase was selectively augmented with cytosolic ATP (data not shown). The capacitance measurement, however, also inevitably includes endocytosis, and the effects of ATP on the exocytosis are difficult to quantify. Consequently, we have relied on amperometric measurement in the following experiments.
The effect of ATP hydrolysis on Ca2+-stimulated exocytosis was examined. When ATP was replaced with the hydrolysis-resistant analog, ATP[γS], exocytosis was much more extensive (Fig. 2A). The latency histogram indicated that the amplitude of mode-1 exocytosis in the presence of 3 mM ATP[γS] was four times that observed in the presence of 3 mM ATP (Fig. 2C), so that, under the former conditions, we found that mode-1 exocytosis accounted for ≈90% (40/45) of the LV fusion events in ATP[γS]-stimulated cells. However, the extent of mode-2 exocytosis was unchanged when ATP was replaced by the nonhydrolyzable ATP[γS] (Fig. 2C). Furthermore, the rates of secretion for both mode 1 and 2 pathways were unaffected by substitution of ATP[γS] into the internal solution (Fig. 2C; see Fig. 5A). Another hydrolysis-resistant analog, AMP-PNP, did not stimulate and actually suppressed mode-1 exocytosis relative to that apparent in the presence of ATP (Fig. 2 B and C). These data suggest that the action of ATP is mediated by phosphorylation because ATP[γS], but not AMP-PNP, can serve as a substrate for protein kinases (28). The larger effect of ATP[γS] relative to that of ATP might be attributable to the relative resistance of thiophosphorylated proteins to phosphatases (28, 29). The action of ATP was not blocked by 1 mM ADP (data not shown) and fully depended on Mg2+ (Fig. 2C). These observations exclude the possibility that the effects of ATP were mediated by a direct agonistic action, as in the case with adenosine receptors or with the ATP action on KATP channels (30).
Figure 2.

Effects of ATP analogs and Mg2+ on LV exocytosis. (A and B) Amperometric latency histograms for cells subjected to whole-cell perfusion with solutions containing 3 mM ATP[γS] (A) or 3 mM ANP-PNP (B). Insets show examples of amperometric traces. (C) Nucleotide and Mg2+ dependencies of the number of mode-1 (Upper) and mode-2 (Lower) events per cell estimated as in Fig. 1. All nucleotides were present at 3 mM. ∗, P < 0.01 vs. the value for 3 mM ATP.
These stimulatory effects cannot be attributed to the enhancement of active uptake of serotonin into LVs because ATP[γS] should not stimulate such uptake since an ATPase is involved in the vesicle loading cycle. The stimulatory effects of ATP[γS] also were not caused by conversion of ATP[γS] to GTP[γS] within the beta cells because GTP[γS] (0.1 mM) triggered spontaneous quantal events (data not shown) and capacitance increases (18) whereas ATP[γS] did not. The ATP action on exocytosis may be uniquely characteristic of pancreatic beta cells, as it has been found that the major component of quantal monoamine secretion in bovine adrenal chromaffin cells exhibited a fast component (τ = 0.5 ≈ 2 s), even in the absence of nucleotide (15), and the rate and extent of the major component was not affected significantly by ATP[γS] (data not shown). These data are consistent with previous studies that used capacitance measurements to investigate the effect of ATP[γS] in the chromaffin cells (31).
Regulation of Mode-1 LV Exocytosis by cAMP.
The effects of protein kinase inhibitors on the role of protein phosphorylation in the action of ATP on LV exocytosis in beta cells was examined. The inhibitors were applied to cells 5–20 min before whole-cell recording. A competitive antagonist of cAMP, Rp-cAMP, blocked the action of ATP (Fig. 3 A and C). Similarly, H89, at a concentration (10 μM) that selectively inhibits PKA, abrogated the effect of ATP (Fig. 3C). The general protein kinase inhibitor H7 (30 μM) also blocked the action of ATP. These data indicate that PKA contributes to the effects of ATP on mode-1 component of LV exocytosis whereas the mode-2 component of LV exocytosis was less affected by kinase inhibitors (Fig. 3C).
Figure 3.

Effects of protein kinase inhibitors and forskolin on LV exocytosis. (A and B) Amperometric latency histograms and examples of amperometric traces (Insets) for cells pretreated with 20 μM Rp-cAMP (A) or 10 μM forskolin (B) and subsequently perfused with 3 or 0.5 mM ATP, respectively. (C) Effects of various kinase inhibitors and forskolin on the number of mode-1 (Upper) and mode-2 (Lower) events per cell. Rp, Rp-cAMP; Fs, forskolin. ∗, P < 0.01 vs. the value for 3 mM ATP; †, P < 0.01 vs. the value for 0.5 mM ATP.
We next assessed the effects of forskolin, which stimulates adenylate cyclase and thereby increases the cytosolic concentration of cAMP. Several (5–20) minutes after exposure to forskolin (10 μM), the cells were dialyzed with [ATP] = 0.5 mM through the patch pipette. Photolytic calcium jumps applied 2 min after entering the whole-cell patch clamp mode evoked exocytosis of LVs with a rate and amplitude similar to those of LV exocytosis in cells perfused with [ATP] = 3 mM (Fig. 3 B and C). Forskolin treatment did not increase further the number of mode-1 LV events per cell in the presence of cytosolic ATP at 3 mM (Fig. 3C). Thus, at low [ATP]i, forskolin mimicked the effects of ATP and, at high [ATP]i, occluded the effects of ATP. These results are consistent with the hypothesis that ATP stimulates secretion via a cAMP-dependent pathway.
The effects of cAMP on LV exocytosis were examined directly by whole-cell perfusion. At a concentration of 0.2 mM, cAMP facilitated exocytosis at [ATP]i of 0.1 or 0.5 mM (Fig. 4 A and B) by selective augmentation of mode-1 LV exocytosis (Figs. 3C and 4C). No significant effect of cAMP was apparent in the absence of ATP (Fig. 4C). However, the cAMP effect was occluded at 3 mM ATP (Fig. 4C), which is consistent with the action of ATP being mediated by PKA. Furthermore, because forskolin also increased LV exocytosis (Fig. 3B), this suggests that the [ATP]i in the intact cells is <3 mM. These data indicate that the regulation of mode-1 LV exocytosis by cytosolic ATP is mediated by PKA.
Stimulation of secretion, by flash photolysis of caged Ca2+, after whole-cell dialysis with solutions containing ATP but no cAMP is likely attributable to the generation of cytosolic cAMP from ATP in the pipette as a result of the activity of adenylate cyclase (32). Indeed, the effect of 3 mM ATP was eliminated by pretreatment of cells with Rp-cAMP (Fig. 3 A and C) or was reduced by the addition of 1 mM Rp-cAMP to the pipette solution [mode-1 events per cell, 2.4 ± 0.6 (mean ± SEM), n = 7]. In addition, an irreversible inhibitor of adenylate cyclase, MDL-12,330A (33) in the pipette (0.5 mM) eliminated the effects of 3 mM ATP (mode-1 events per cell, 0.74 ± 0.3, n = 12) (Fig. 4D) whereas the blocking effect of MDL-12,330A was overcome (14.9 ± 1.16, n = 6) by further addition of 0.2 mM cAMP in the pipette (Fig. 4D).
DISCUSSION
Roles of Adenylate Cyclase and PKA in the Effects of ATP on Exocytosis.
We have shown that a uniform and controlled elevation of [Ca2+]i produced by photolysis of caged Ca2+ induces LV exocytosis in beta cells, which was enhanced dramatically by intracellular perfusion with ATP in a concentration-dependent manner. The effect of ATP was mediated downstream of steps that require ATP hydrolysis-dependent transportation and priming step (34, 35) because the enhancement also was supported by the hydrolysis-resistant analog ATP[γS]. This analog is known to block the priming step of vesicle fusion (36, 37) and cannot serve as a substrate for the ATPase activity of N-ethylmaleimide-sensitive fusion protein (38).
Several lines of evidence indicate that the action of ATP is mediated by PKA. First, selective inhibitors of PKA (Rp-cAMP and H89) blocked the effects of ATP. Second, intracellular application of cAMP or extracellular application of forskolin mimicked the action of ATP. And third, ATP[γS], but not AMP-PNP, could replace ATP; ATP[γS], but not AMP-PNP, can serve as a phosphate donor for protein kinases (28), although both analogs can be converted to cAMP by adenylate cyclase (28, 39). The observation that the effect of ATP[γS] was greater than that of ATP indicates the existence of substantial phosphatase activity in beta cells (40). Indeed, the slow and reduced exocytosis in cells perfused with solutions lacking ATP or containing 3 mM AMP-PNP is consistent with the occurrence of protein dephosphorylation in the absence of ATP. PKA catalyzes the phosphorylation of many proteins in beta cells (41), but the protein substrate responsible for the action of ATP on exocytosis remains to be elucidated.
Adenylate cyclase also appears to contribute to the action of ATP because (i) the effect of ATP (or ATP[γS]) was apparent in the absence of cAMP in the patch pipette internal solution; (ii) the action of ATP was blocked by a specific competitive antagonist of cAMP (Rp-cAMP), indicating that it was mediated by cAMP; (iii) the stimulatory effect of forskolin, which activates adenylate cyclase, was occluded in the presence of 3 mM ATP; (iv) the effect of ATP was abolished by the blocker of adenylate cyclase, MDL12,330A; and (v) the concentration dependence (K0.5 = 0.5 mM) of the action of ATP is consistent with the Michaelis constant of adenylate cyclase (0.25 to 0.6 mM) (39, 42). The K0.5 of ATP was reduced (to 0.2 mM) in the presence of a saturating concentration (0.2 mM) of cAMP in the patch pipette; this reduced ATP requirement is consistent with the smaller Michaelis constant of PKA (≈40 μM) (43).
The action of ATP is shown to be mediated by the sequential activation of adenylate cyclase and PKA (Fig. 5B). The basal activity of adenylate cyclase or PKA has been known to regulate diverse cellular functions in various cell types (44). Our observation that forskolin or 0.2 mM cAMP did not potentiate the action of 3 mM ATP suggests that the basal activity of adenylate cyclase was sufficient to mediate the maximal effect of ATP on beta cell exocytosis and, further, that it was greater than that of cyclic nucleotide phophodiesterase. The participation of these two ATP-dependent molecules (adenylate cyclase and PKA) with markedly different Michaelis constants suggests that the ATP sensitivity of exocytosis is susceptible to modulation by any other protein component of the cAMP signaling cascade (Fig. 5B). In fact, potent insulinotropic actions are induced with Gs-coupled receptors (7), pertussis toxin (islet activating protein) that inactivate Gi (45), or cAMP (7, 8, 13, 14, 46). Our data provide a mechanistic link between the potent actions of ATP (9, 11) and those of cAMP (7) in beta cells.
ATP-Induced Switching to Mode-1 LV Exocytosis.
We have shown that cytosolic ATP increased the rate of exocytosis and that the effect of ATP was caused by selective recruitment of the mode-1 component by cAMP-dependent phosphorylation (Fig. 5A). Thus, the phosphorylation acts to maintain the size of the pool of fusion-ready vesicles in the mode-1 pathway (Fig. 5B). In other words, LVs in the mode-1 pathway require both cAMP-dependent phosphorylation and Ca2+ for the final triggering of exocytosis (Fig. 5B) because the phosphorylation acts at a step downstream of ATP-hydrolysis-dependent processes just like the Ca2+ trigger. Because 90% of LV exocytosis in ATP[γS]-stimulated cells occurred in the mode-1 component (Fig. 5A), the majority (90%) of LVs belong to the mode-1 pathway.
The mode-2 exocytosis probably represents exocytosis of the LVs that slowly (9 s) undergo exocytosis and that do not require phosphorylation for Ca2+ triggering because the mode-2 exocytosis was not enhanced by ATP or PKA (Figs. 1–3 and 5A) and because the mode-2 exocytosis was unaffected, even when phosphorylation was severely prohibited (Figs. 2B, 3C, and 5A). Thus, our data suggest the existence of the two exocytotic pathways, one that requires phosphorylation for the final trigger and the other that does not. This interpretation is consistent with the results of the previous studies suggesting the existence of two parallel LV pathways in pancreatic beta cells (17, 22). We believe that it will be interesting to establish whether the vesicles in the mode-2 pathway may be mobilized into the mode-1 pathway. However any such sequential model is extremely restricted by our finding that neither ATP nor PKA reduced the amount of mode-2 exocytosis and that the speed of mode-2 exocytosis was not altered under any of the conditions tested.
The ATP Sensor for Glucose-Induced Insulin Exocytosis.
We propose that the exocytotic machinery for mode-1 LVs performs an essential and physiological ATP-sensing function in glucose-induced insulin exocytosis. Forskolin or cAMP stimulated exocytosis in intact beta cells in the present study as well as in previous studies (8, 13, 14, 46, 47). This observation, together with the caged Ca2+-stimulated perfused cells, suggests that the physiological [ATP]i is <3 mM and that the action of ATP on exocytosis has not achieved saturation in resting beta cells. Therefore, ATP is a potential physiological regulator of exocytosis in intact beta cells. According to the classical mechanism of glucose sensing in beta cells, an increase in the blood concentration of glucose results sequentially in an increase in the [ATP]i, the closing of KATP channels, cell depolarization, activation of voltage-gated Ca2+ channels, an increase in [Ca2+]i, and Ca2+-dependent insulin exocytosis (8, 48). The KATP channel-dependent mechanism of glucose sensing, however, cannot account for two important observations: (i) The extent of insulin secretion triggered by an increase in [Ca2+]i was reduced under conditions of ATP depletion (10, 12); and (ii) ATP increased insulin exocytosis, even when [Ca2+]i was clamped at a high level and KATP channels were open (9, 11). These KATP channel-independent effects of ATP can be explained readily by the ATP-sensing mechanism identified in the present study. Moreover, our model also can account for the observation that glucose-induced insulin exocytosis was enhanced when the activity of PKA was increased (7, 45), although it was suppressed when the activity of PKA was reduced (49). In addition, glucose increases [cAMP]i (46, 47, 50) as well as [Ca2+]i, and, therefore, glucose is sufficient to trigger insulin exocytosis.
We believe that the two ATP sensors for insulin secretion, KATP channels and the distal exocytotic ATP sensor, are equally important because the major population of fusion-ready vesicles require both Ca2+ and phosphorylation for the final triggering of exocytosis. An attractive hypothesis is that the extent of insulin exocytosis is tightly regulated by the final ATP sensor in an [ATP]i-dependent manner (Fig. 4B) whereas KATP channels maintain the electrical synchronicity of beta cells that underlies pulsatile secretion of insulin (51). Because the etiology of non-insulin-dependent diabetes mellitus has been suggested to involve PKA (7, 46), clarification of the mechanism of mode-1 exocytosis may contribute to our understanding of the etiology of diabetes mellitus and to the development of new therapies. Similar cAMP and ATP dependent regulatory mechanisms may be operating in neurons (4–6).
Acknowledgments
We thank K. Yasuda, T. Kishimoto, and T.-T. Liu for helpful discussions. This work was supported by Research for the Future of Japan Society for the Promotion of Science, Core Research for Evolutionary Science and Technology of the Japan Science and Technology Corporation, Grants-in-Aid (09273101 and 07278103) from the Ministry of Education, grants from Human Frontier Science Program Organization and Toyota Foundation to H.K., and National Institutes of Health Grant GM53395 to G.C.R.E.-D.; N.T. is a fellow of the Japan Society for the Promotion of Science.
ABBREVIATIONS
- Rp-cAMP
adenosine 3′,5′-monophosphothioate
- ATP[γS]
adenosine 5′-O-(3-thiotriphosphate)
- AMP-PNP
5′-adenylyl-β,γ-imidodiphosphate
- LV
large dense-core vesicle
- PKA
protein kinase A
- MDL-12
330A, cis-N-(as-2-phenylcyclopentyl)azacyclo-tridecan-2-imine hydrochloride
- DMNPE-4
dimethoxynitrophenyl-EGTA-4
Footnotes
A Commentary on this article begins on page 329.
References
- 1.Martin T F J. Trends Cell Biol. 1997;7:271–276. doi: 10.1016/S0962-8924(97)01060-X. [DOI] [PubMed] [Google Scholar]
- 2.Rothman J E. Nature (London) 1994;372:55–63. doi: 10.1038/372055a0. [DOI] [PubMed] [Google Scholar]
- 3.Südhof T C. Nature (London) 1995;375:645–653. doi: 10.1038/375645a0. [DOI] [PubMed] [Google Scholar]
- 4.Byrne J H, Kandel E R. J Neurosci. 1996;16:425–435. doi: 10.1523/JNEUROSCI.16-02-00425.1996. [DOI] [PMC free article] [PubMed] [Google Scholar]
- 5.Weisskopf M G, Castillo P E, Zalutsky R A, Nicoll R A. Science. 1994;265:1878–1882. doi: 10.1126/science.7916482. [DOI] [PubMed] [Google Scholar]
- 6.Chavez-Noriega L E, Stevens C F. J Neurosci. 1994;14:310–317. doi: 10.1523/JNEUROSCI.14-01-00310.1994. [DOI] [PMC free article] [PubMed] [Google Scholar]
- 7.Thorens B, Waeber G. Diabetes. 1993;42:1219–1225. doi: 10.2337/diab.42.9.1219. [DOI] [PubMed] [Google Scholar]
- 8.Ashcroft F M, Proks P, Smith P, Ämmälä C, Bokvist K, Rorsman P. J Cell Biochem. 1994;55S:54–65. doi: 10.1002/jcb.240550007. [DOI] [PubMed] [Google Scholar]
- 9.Gembal M, Gilon P, Henquin J. J Clin Invest. 1992;89:1288–1295. doi: 10.1172/JCI115714. [DOI] [PMC free article] [PubMed] [Google Scholar]
- 10.Detimary P, Gilon P, Nenquin M, Henquin J. Biochem J. 1994;297:455–461. doi: 10.1042/bj2970455. [DOI] [PMC free article] [PubMed] [Google Scholar]
- 11.Aizawa T, Sato Y, Ishihara F, Taguchi N, Komatsu M, Suzuki N, Hashizume K, Yamada T. Am J Physiol. 1994;266:C622–C627. doi: 10.1152/ajpcell.1994.266.3.C622. [DOI] [PubMed] [Google Scholar]
- 12.Rustenbeck I, Herrmann C, Grimmsmann T. Diabetes. 1997;46:1305–1311. doi: 10.2337/diab.46.8.1305. [DOI] [PubMed] [Google Scholar]
- 13.Ämmälä C, Ashcroft F M, Rorsman P. Nature (London) 1993;363:356–358. doi: 10.1038/363356a0. [DOI] [PubMed] [Google Scholar]
- 14.Gillis K D, Misler S. Pflügers Arch. 1993;424:195–197. doi: 10.1007/BF00374612. [DOI] [PubMed] [Google Scholar]
- 15.Ninomiya Y, Kishimoto T, Yamazawa T, Ikeda H, Miyashita Y, Kasai H. EMBO J. 1997;16:929–934. doi: 10.1093/emboj/16.5.929. [DOI] [PMC free article] [PubMed] [Google Scholar]
- 16.Smith P A, Duchen M R, Ashcroft F M. Pflügers Arch. 1995;430:808–818. doi: 10.1007/BF00386180. [DOI] [PubMed] [Google Scholar]
- 17.Takahashi N, Kadowaki T, Yazaki Y, Miyashita Y, Kasai H. J Cell Biol. 1997;138:55–64. doi: 10.1083/jcb.138.1.55. [DOI] [PMC free article] [PubMed] [Google Scholar]
- 18.Proks P, Eliasson L, Ämmälä C, Rorsman P, Ashcroft F M. J Physiol. 1996;496:255–264. doi: 10.1113/jphysiol.1996.sp021682. [DOI] [PMC free article] [PubMed] [Google Scholar]
- 19.Renström E, Eliasson L, Rorsman P. J Physiol. 1997;502:105–118. doi: 10.1111/j.1469-7793.1997.105bl.x. [DOI] [PMC free article] [PubMed] [Google Scholar]
- 20.Eliasson L, Renström E, Ding W, Proks P, Rorsman P. J Physiol. 1997;503:399–412. doi: 10.1111/j.1469-7793.1997.399bh.x. [DOI] [PMC free article] [PubMed] [Google Scholar]
- 21.Oberhauser A F, Robinson I, Fernandez J M. Biophys J. 1996;71:1131–1139. doi: 10.1016/S0006-3495(96)79315-3. [DOI] [PMC free article] [PubMed] [Google Scholar]
- 22.Kasai, H. (1999) Trends Neurosci., in press.
- 23.Kasai H, Takagi H, Ninomiya Y, Kishimoto T, Ito K, Yoshida A, Yoshioka T, Miyashita Y. J Physiol. 1996;494:53–65. doi: 10.1113/jphysiol.1996.sp021475. [DOI] [PMC free article] [PubMed] [Google Scholar]
- 24.Ellis-Davies G C R. Tetrahedron Lett. 1998;39:953–956. [Google Scholar]
- 25.Wilks S S. Mathematical Statistics. New York: Wiley; 1962. [Google Scholar]
- 26.Ellis-Davies G C R, Kaplan J H. Proc Natl Acad Sci USA. 1994;91:187–191. doi: 10.1073/pnas.91.1.187. [DOI] [PMC free article] [PubMed] [Google Scholar]
- 27.Renström E, Eliasson L, Bokvist K, Rorsman P. J Physiol. 1996;494:41–52. doi: 10.1113/jphysiol.1996.sp021474. [DOI] [PMC free article] [PubMed] [Google Scholar]
- 28.Yount R G. Adv Enzymol. 1975;37:1–56. doi: 10.1002/9780470122884.ch1. [DOI] [PubMed] [Google Scholar]
- 29.Trautwein, W. & Kameyama, M. (1986) Jpn. Heart J. 27, Suppl. 1, 31–50. [PubMed]
- 30.Ashcroft F M, Kakei M. J Physiol. 1989;416:349–367. doi: 10.1113/jphysiol.1989.sp017765. [DOI] [PMC free article] [PubMed] [Google Scholar]
- 31.Parsons T D, Coorssen J R, Horstmann H, Almers W. Neuron. 1995;15:1085–1096. doi: 10.1016/0896-6273(95)90097-7. [DOI] [PubMed] [Google Scholar]
- 32.Salmaon Y, Lin M C, Londos C, Rendell M, Rodbell M. J Biol Chem. 1975;250:4239–4245. [PubMed] [Google Scholar]
- 33.Guellaen G, Mahu J L, Mavier P, Berthelot P, Hanoune J. Biochim Biophys Acta. 1977;484:465–475. doi: 10.1016/0005-2744(77)90102-4. [DOI] [PubMed] [Google Scholar]
- 34.Augustine G J, Burns M E, DeBello W M, Pettit D L, Schweizer F E. Annu Rev Pharmacol Toxicol. 1996;36:659–701. doi: 10.1146/annurev.pa.36.040196.003303. [DOI] [PubMed] [Google Scholar]
- 35.Calakos N, Scheller R H. Physiol Rev. 1996;76:1–29. doi: 10.1152/physrev.1996.76.1.1. [DOI] [PubMed] [Google Scholar]
- 36.Banerjee A, Barry V A, DasGupta B R, Martin T F J. J Biol Chem. 1996;271:20223–20226. doi: 10.1074/jbc.271.34.20223. [DOI] [PubMed] [Google Scholar]
- 37.Kiraly-Borri C E, Morgan A, Burgoyne R D, Weller U, Wollheim C B, Lang J. Biochem J. 1996;314:199–203. doi: 10.1042/bj3140199. [DOI] [PMC free article] [PubMed] [Google Scholar]
- 38.Whiteheart S W, Rossnagel K, Buhrow S A, Brunner M, Jaenicke R, Rothman J E. J Cell Biol. 1994;126:945–954. doi: 10.1083/jcb.126.4.945. [DOI] [PMC free article] [PubMed] [Google Scholar]
- 39.Ho R, Sutherland E W. Proc Natl Acad Sci USA. 1975;72:1773–1777. doi: 10.1073/pnas.72.5.1773. [DOI] [PMC free article] [PubMed] [Google Scholar]
- 40.Ämmälä C, Eliasson L, Bokvist K, Berggren P, Honkanen R E, Sjoeholm A, Rorsman P. Proc Natl Acad Sci USA. 1994;91:4343–4347. doi: 10.1073/pnas.91.10.4343. [DOI] [PMC free article] [PubMed] [Google Scholar]
- 41.Sugden M C, Ashcroft S J H, Sugden P H. Biochem J. 1979;180:219–229. doi: 10.1042/bj1800219. [DOI] [PMC free article] [PubMed] [Google Scholar]
- 42.Birnbaumer L, Stephen L P, Rodbell M. J Biol Chem. 1969;244:3468–3476. [PubMed] [Google Scholar]
- 43.Mitchell J W, Mellgren R L, Thomas J A. J Biol Chem. 1980;255:10368–10374. [PubMed] [Google Scholar]
- 44.Li W, West J W, Lai Y, Scheuer T, Catterall W A. Neuron. 1992;8:1151–1159. doi: 10.1016/0896-6273(92)90135-z. [DOI] [PubMed] [Google Scholar]
- 45.Katada T, Ui M. J Biol Chem. 1981;256:8310–8317. [PubMed] [Google Scholar]
- 46.Dachicourt N, Serradas P, Giroix M, Gangnerau M, Portha B. Am J Physiol. 1996;271:E725–E732. doi: 10.1152/ajpendo.1996.271.4.E725. [DOI] [PubMed] [Google Scholar]
- 47.Charles M A, Fanska R, Schmid F G, Forsham P H, Grodsky G M. Science. 1973;179:569–571. doi: 10.1126/science.179.4073.569. [DOI] [PubMed] [Google Scholar]
- 48.Yaekura K, Kakei M, Yada T. Diabetes. 1996;45:295–301. doi: 10.2337/diab.45.3.295. [DOI] [PubMed] [Google Scholar]
- 49.Sharp G W. Am J Physiol. 1996;271:C1781–C1799. doi: 10.1152/ajpcell.1996.271.6.C1781. [DOI] [PubMed] [Google Scholar]
- 50.Pipeleers D G, Schuit F C, in’t Veld P A, Maes E, Hooghe-Peters E L, Van De Winkel M, Gepts W. Endocrinology. 1985;117:824–833. doi: 10.1210/endo-117-3-824. [DOI] [PubMed] [Google Scholar]
- 51.Bergesten P. Am J Physiol. 1995;268:E282–E287. doi: 10.1152/ajpendo.1995.268.2.E282. [DOI] [PubMed] [Google Scholar]