

Abstract
Objectives. We evaluated whether cumulative exposure to job strain increases blood pressure.
Methods. A prospective study of 8395 white-collar workers was initiated during 1991 to 1993. At follow-up, 7.5 years later, 84% of the participants were reassessed to estimate cumulative exposure to job strain.
Results. Compared with men who had never been exposed, men with cumulative exposure and those who became exposed during follow-up showed significant systolic blood pressure increments of 1.8 mm Hg (95% confidence interval [CI]=0.1, 3.5) and 1.5 mm Hg (95% CI=0.2, 2.8), respectively, and relative risks of blood pressure increases in the highest quintile group of 1.33 (95% CI = 1.01, 1.76) and 1.40 (95% CI = 1.14, 1.73). Effect magnitudes were smaller among women. Effects tended to be more pronounced among men and women with low levels of social support at work.
Conclusions. Among these white-collar workers, exposure to cumulative job strain had a modest but significant effect on systolic blood pressure among men. The risk was of comparable magnitude to that observed for age and sedentary behavior. Men and women with low levels of social support at work appeared to be at higher risk for increases in blood pressure.
High blood pressure is a major risk factor for cardiovascular disease.1–4 Several factors such as age, obesity,5–7 sedentary behavior,6,8,9 alcohol consumption,6,8 and salt intake8,10,11 may contribute to the development of high blood pressure. Epidemiological studies have shown that psychosocial factors (including workplace psychosocial factors) may contribute to high blood pressure.12–16 Most studies examining the association between work-place psychosocial factors and blood pressure have been based on the job strain model developed by Karasek,17 in which adverse work-place psychosocial factors are defined as a combination of high psychological demands and low decision latitude. Lack of social support in the workplace could further increase the effects of job strain.18,19
Studies assessing the impact of job strain on blood pressure have involved several limitations and have generated different results. Some cross-sectional studies using casual blood pressure measurements (i.e., a small number of measurements taken at rest)20–23 and most cross-sectional studies assessing ambulatory blood pressure19,24–33 have reported significant associations between job strain and blood pressure. However, cross-sectional designs may be biased by selection effects34 and do not allow evaluation of the temporal relation between exposure and outcome or the impact of cumulative exposure. To our knowledge, 4 prospective studies have evaluated the effects of cumulative exposure to job strain on blood pressure in normotensive individuals, and these studies have produced mixed results.
Chapman et al.35 and Fauvel et al.36 found no effect on blood pressure over 5 years of cumulative exposure. Schnall et al. found that systolic and diastolic blood pressure levels were 5.7 and 4.4 mm Hg higher, respectively, among workers with 3 years of cumulative exposure to job strain than among workers who had never been exposed.29 Moreover, higher blood pressure was found among men who had been employed for 25 years or more and who had been exposed to job strain for 50% of their working life than among men without past exposure to job strain.37 Recently, Markovitz et al.38 reported that changes in psychological demands and decision latitude ratios affected systolic blood pressure. Limitations of these studies relate to low (40%35) or unknown38 participation rates, high rates of loss to follow-up (25%,35 31.5%,29 and 38%38), inclusion of exclusively male participants,29 and use of casual blood pressure measurements.35,38
We prospectively evaluated whether cumulative exposure to job strain significantly increased blood pressure levels over a 7.5-year period among men and women employed in white-collar occupations. In addition, we evaluated the potential modifying effects of social support in the workplace.
METHODS
Study Design and Population
The study population involved white-collar workers aged 18 to 65 years old employed by 22 public organizations in Quebec City. Their jobs encompassed the full range of white-collar occupations (manual workers were excluded39), including senior management (10.4%), professional (35.5%), technical (20.8%), and office (30.6%) workers. Education levels ranged from no high-school diploma to university degree. The study design and population have been described elsewhere.40 Briefly, between 1991 and 1993, 9189 workers, 75% of the target population, participated in a prospective study intended to evaluate the effects of job strain on blood pressure and cardiovascular disease.
All invited participants who were working 20 hours per week or less (0.8%), who were pregnant (1.5%), or who had cardiovascular disease, including treated hypertension (5.2%), were excluded from the study. Of the 8395 participants, 7.7% refused to take part at follow-up, and 2.3% were lost to follow-up. Between January 1999 and June 2003, 89% workers were rescreened. Exclusions were also made at follow-up; namely, 1.2% of the participants had died, 3.0% had been treated for hypertension detected at baseline, and 0.7% were pregnant. Finally, workers with more than 2 missing answers related to psychological demands or decision latitude at baseline (0.9%) or at follow-up (1.2%) and those missing blood pressure measurements (5.0%) were excluded from the analyses. Thus, data were available for 6719 participants.
Data Collection and Variables
At baseline and follow-up, workers completed a self-administered questionnaire focusing on demographic characteristics, risk factors for hypertension and cardiovascular disease (smoking, low level of physical activity, high cholesterol, diabetes), family history of cardiovascular disease or hypertension, and characteristics of work and social life. At the worksite (with the exception of those not working at follow-up who were seen at a research clinic), trained nurses measured blood pressure, weight, height, and waist circumference using validated protocols.41,42
In accordance with the American Heart Association protocol,41 workers’ blood pressure was measured at rest after they had been sitting for 5 minutes. The averages of 2 blood pressure measurements taken at baseline and 3 taken at follow-up, 1 to 2 minutes apart, were used as baseline and follow-up blood pressure levels. Two outcome variables were created separately for systolic and diastolic blood pressure. The first was mean follow-up blood pressure. Workers treated for hypertension at follow-up were excluded from these analyses because their blood pressure level value had been lowered via medication. The second was a dichotomous variable identifying workers with mean blood pressure increases in the highest quintile of the sample. This variable allowed inclusion of workers treated for hypertension, who were assigned to the highest quintile group.
We measured both components of Karasek’s job strain model at baseline and follow-up using 18 items from the Job Content Questionnaire.43 Psychological demands reflect quantity of work, time constraints, and level of intellectual effort required. Decision latitude reflects opportunities for learning, autonomy, and participation in the decisionmaking process. The results of previous studies have supported the psychometric properties (internal consistency, factorial validity, and discriminant validity) of both the original English44–46 and French46–48 versions of the questionnaire.
We computed psychological demands and decision latitude scores using algorithms recommended by Karasek. In the case of workers with missing data on 2 or fewer items on a given scale, we imputed an average score based on their answered items. This score was applied to 131 and 86 workers for psychological demands and decision latitude, respectively, at baseline and to 81 and 50 workers, respectively, at follow-up. Workers with missing data on more than 2 items were considered as having incomplete data.
At both baseline and follow-up, we used the quadrant method to assess exposure. Workers with psychological demands scores of 24 or higher (the median for the general Quebec working population) were classified as having high psychological demands, and others were categorized as having low psychological demands.49 Workers with decision latitude scores of 72 or lower (again, the median for the general Quebec working population) were classified as having low decision latitude; the remainder were classified as having high decision latitude.49
The exposed group comprised workers with high psychological demands and low decision latitude; the active group comprised workers with high psychological demands and high decision latitude; and the passive group comprised workers with low psychological demands and low decision latitude. Other workers were classified as unexposed. Workers who were unemployed or retired at follow-up (n = 866) were considered unexposed at follow-up. Cumulative exposure to job strain was assessed according to exposure observed at baseline and follow-up: exposed at both baseline and follow-up, became exposed during follow-up (exposed only at follow-up), exposure ceased during follow-up (exposed only at baseline), and active, passive, or unexposed at both baseline and follow-up (never exposed; reference group).
Several factors were considered as potential confounders, including the demographic variables age, marital status, and education (highest level completed). Family responsibilities were assessed according to the number of children living with the worker.50 Overweight was defined as a body mass index (weight in kilograms divided by height in meters squared) of 25 or above.51 Waist circumference was measured in centimeters.
We defined abdominal obesity as waist circumferences above 102 cm in men and 89 cm in women.51 Smokers were defined as those smoking 1 or more cigarettes per day.50 Alcohol consumption, measured according to average number of alcoholic drinks consumed per week in the preceding 12 months (1 drink = 1 glass of beer or wine or 1 oz [30 mL] of liquor), was categorized as either alcohol abuse (more than 20 drinks consumed per week) or nonabuse.50 We defined sedentary behavior as having engaged in physical exercise less than once per week during the previous 6 months.50 One exercise session was categorized as 20 minutes or more of rigorous recreational physical activity. Results were similar when sedentary behavior was defined as engaging in physical exercise fewer than 3 times per week during the previous 6 months. Cumulative exposure to these potential confounders over the 7.5-year study period was taken into account. Other factors assessed were family history of health problems (cardiovascular disease or high blood pressure) and personality profile (evaluated in terms of hostility,52 cynicism,52 and anger53). We measured social support at work at follow-up using 6 items related to supervisor support and 5 related to coworker support.43
Analyses
All analyses were conducted separately for systolic and diastolic blood pressure and for men and women.54 Student t tests and χ2 analyses were used to compare baseline characteristics among included and excluded workers. We estimated mean follow-up blood pressure values for each job strain group using analyses of covariance adjusting for baseline blood pressure values.55 When we conducted analyses that instead focused on blood pressure change between baseline and follow-up, the results were identical to those described here. We estimated risk ratios (RRs) for blood pressure increases in the highest quintile for each job strain group using binomial regression analysis adjusting for baseline blood pressure values.56 These analyses were also used to assess confounding. A variable was considered to be a confounder if its introduction into a model resulted in a change in effect of more than 10%. The level of statistical significance was set at .05.
The modifying effects of social support at work, age (younger than 45 years vs 45 years or older), and highest completed education level (college or less vs university) were evaluated through stratified analyses. These effects were also evaluated through the statistical significance (P < .10) of interactions obtained from analyses of covariance. A complementary analysis compared the effect of job strain on blood pressure with that of known blood pressure risk factors. Body mass index and waist circumference yielded similar results. The effects of alcohol abuse could not be evaluated because fewer than 2% of the workers abused alcohol. SAS statistical software57 was used in conducting all of the analyses.
RESULTS
Table 1 ▶ summarizes the baseline characteristics of the men and women included in the analyses in comparison with those excluded for technical reasons (incomplete data for job strain or blood pressure, refused to participate, lost to follow-up). The group of excluded men and women had higher baseline blood pressure levels than those who took part, and more of these individuals were smokers and were overweight. The group of excluded women was less educated than the group of included women. However, excluded and included workers were comparable in terms of job strain exposure, social support at work, and seniority at work.
TABLE 1—
Characteristics at Baseline Among Men and Women Included and Excluded From the Analyses: Quebec City, 1991–2003
| Men | Women | |||||
| Included (n = 3483) | Excludeda (n = 581) | P | Included (n = 3236) | Excludeda (n = 802) | P | |
| Mean age, y | 41.0 | 40.7 | .600 | 38.0 | 38.6 | .052 |
| Percentage in age group, y | <.001 | <.001 | ||||
| ≥45 | 31.9 | 39.6 | 16.9 | 25.4 | ||
| 35–44 | 46.6 | 30.1 | 50.9 | 40.3 | ||
| < 35 | 21.5 | 30.3 | 32.2 | 34.3 | ||
| Baseline job strain category, % | .552 | .949 | ||||
| Exposed | 17.8 | 18.4 | 23.8 | 22.9 | ||
| Active | 28.0 | 25.1 | 15.4 | 15.3 | ||
| Passive | 34.9 | 36.9 | 48.7 | 49.8 | ||
| Unexposed | 19.4 | 19.5 | 12.1 | 12.0 | ||
| Low social support at work,b % | 57.7 | 60.0 | .533 | 56.4 | 61.5 | .172 |
| Mean no. of years working for organization | 10.6 | 10.3 | .448 | 9.8 | 9.5 | .407 |
| Education (highest level completed), % | .187 | .009 | ||||
| High school or less | 13.2 | 15.9 | 43.6 | 49.6 | ||
| Collegec | 26.0 | 24.8 | 30.4 | 27.6 | ||
| University | 60.8 | 59.3 | 26.1 | 22.8 | ||
| Mean systolic blood pressure, mm Hg | 121.4 | 123.0 | <.001 | 110.8 | 112.2 | .009 |
| Mean diastolic blood pressure, mm Hg | 76.4 | 76.5 | .037 | 70.3 | 70.8 | .195 |
| Cardiovascular risk factors, % | ||||||
| Daily smoking | 15.5 | 20.9 | <.001 | 19.6 | 27.1 | <.001 |
| Sedentary behavior | 36.2 | 37.1 | .701 | 46.3 | 46.4 | .960 |
| Overweightd | 51.5 | 57.2 | .011 | 27.1 | 31.1 | .025 |
| Abdominal obesitye | 15.5 | 25.9 | .031 | 14.3 | 13.3 | .788 |
Note. P values are for Student t statistics for comparisons of means and χ2statistics for comparisons of percentages between included and excluded workers. aExcluded for technical reasons (refused to participate at follow-up, lost to follow-up, incomplete data for blood pressure or job strain). bSocial support at work was measured with 1052 included and 215 excluded men and 947 included and 217 excluded women at baseline. cIn the province of Quebec, college refers to preuniversity or vocational studies. dOverweight was defined as a body mass index of 25 kg/m2 or above. eAbdominal obesity was defined as waist circumferences above 102 cm for men and 89 cm for women.
The mean age of the men included in the analyses was 41.0 years (SD=8.2), their mean systolic blood pressure level was 121.4 mm Hg (SD=12.0, range=84–167), and their mean diastolic blood pressure level was 76.4 mm Hg (SD=9.1, range=40–109). The mean age of women included in the study was 38.0 years (SD=7.2), their mean systolic blood pressure level was 110.8 mm Hg (SD=11.6, range= 83–160), and their mean diastolic blood pressure level was 70.3 mm Hg (SD=8.8, range= 41–102). Most workers were seen during the period from 1991 to 1993 and reexamined during the period from 1999 to 2001. Other workers initially lost to follow-up or refusing to take part were seen from 2002 to 2003. The mean and median follow-up period was 7.5 years (SD = 1.1). Mean follow-up systolic and diastolic blood pressure values were 124.2 (SD = 13.3) and 79.8 (SD = 9.0) for men and 114.6 (SD = 13.6) and 73.6 (SD = 8.9) for women. Workers assigned to the highest quintile group, representing 22% of the participants overall, showed an average 7.5-year blood pressure increase of more than 12.0/10.5 mm Hg.
Table 2 ▶ presents mean blood pressure values at follow-up, adjusted for baseline values, for never-exposed workers and the increments observed for other cumulative job strain categories. Compared with never-exposed men, those with exposure to cumulative job strain showed a significant increment of 1.8 mm Hg (95% confidence interval [CI]=0.1, 3.5) in systolic blood pressure level. Men exposed at follow-up only showed a significant increment in systolic blood pressure of similar magnitude. No significant effect was observed among men exposed at baseline only or among women. The effect of cumulative job strain was smaller and not significant for diastolic blood pressure. Table 2 ▶ also shows the risk ratio for blood pressure increases in the highest quintile for each cumulative job strain category. Similar effects were observed: men with exposure to cumulative job strain or exposure at follow-up only had significant blood pressure increase risk ratios of 1.33 (95% CI=1.01, 1.76) and 1.40 (95% CI=1.14, 1.73).
TABLE 2—
Differences in Blood Pressure at Follow-Up and Risk Ratios for Blood Pressure Increases in the Highest Quintile Group: Cumulative Job Strain Categories Compared With the Never-Exposed Category: Quebec City, 1991–2003
| Systolic Blood Pressure, Adjusted (95% CI) | Diastolic Blood Pressure, Adjusted (95% CI) | |
| Difference in blood pressure at follow-up, mm Hg | ||
| Men | ||
| Never exposed | 119.7 | 77.7 |
| Exposed only at baseline | 1.0 (–0.0, 2.0) | 0.8a (0.0, 1.5) |
| Exposed only at follow-up | 1.5a (0.2, 2.8) | 0.6 (–0.3, 1.5) |
| Exposed at baseline and follow-up | 1.8a (0.1, 3.5) | 0.8 (–0.5, 2.0) |
| Women | ||
| Never exposed | 119.1 | 75.5 |
| Exposed only at baseline | 0.1 (–0.9, 1.1) | 0.3 (–0.5, 1.0) |
| Exposed only at follow-up | 0.2 (–0.9, 1.4) | –0.1 (–0.9, 0.8) |
| Exposed at baseline and follow-up | 0.5 (–0.8, 1.8) | 0.5 (–0.5, 1.4) |
| Risk ratio for blood pressure increase in highest quintile | ||
| Men | ||
| Never exposed | 1.0 | 1.0 |
| Exposed only at baseline | 0.98 (0.81, 1.18) | 1.06 (0.90, 1.24) |
| Exposed only at follow-up | 1.40b (1.14, 1.73) | 1.10 (0.92, 1.32) |
| Exposed at baseline and follow-up | 1.33b (1.01, 1.76) | 1.07 (0.84, 1.36) |
| Women | ||
| Never exposed | 1.0 | 1.0 |
| Exposed only at baseline | 1.10 (0.94, 1.29) | 1.08 (0.92, 1.28) |
| Exposed only at follow-up | 1.10 (0.91, 1.32) | 0.91 (0.74, 1.12) |
| Exposed at baseline and follow-up | 1.15 (0.93, 1.41) | 1.06 (0.85, 1.31) |
Note. CI = confidence interval. Adjusted models included the following covariates: age, body mass index, social support at work, living with a child, number of years working for the organization, and baseline systolic or diastolic blood pressure values. a Statistically significant difference (P < .05) compared with never-exposed group according to F and t statistics obtained from analysis of covariance. bStatistically significant risk ratio (P < .05) compared with never-exposed group according to overall χ2 statistic obtained from binomial regression analysis.
Social support at work had a significant modifying effect on systolic blood pressure among men (P = .07). Stratified analyses also revealed consistent modifying effects among women. For the 1583 men at low social support levels, the effect associated with cumulative exposure was 2.1 mm Hg (95% CI = 0.0, 4.1), with a risk ratio of 1.47 (95% CI = 1.08, 2.00). Among the 1588 women with low levels of social support, the increment was 1.3 mm Hg (95% CI = −0.4, 2.9), with a risk ratio of 1.29 (95% CI = 0.99, 1.68). Exposure at follow-up only yielded effects of similar magnitude across all groups of men and women at low social support levels. Men and women at high social support levels showed no job strain effect, men with a blood pressure increment of 1.0 mm Hg (95% CI = −2.3, 4.3) and a risk ratio of 0.99 (95% CI = 0.50, 1.93) and women with a blood pressure increment of −0.8 mm Hg (95% CI = −3.1, 1.5) and a risk ratio of 0.97 (95% CI = 0.66, 1.42).
To verify the effects of known blood pressure risk factors and to compare them with job strain effects, we measured the blood pressure effects associated with age, sedentary behavior, and overweight. Among men, the increment of 1.8 mm Hg associated with job strain tended to be similar in magnitude to the increments associated with sedentary behavior (0.8; 95% CI = −0.1, 1.8) and with each 10-year increase in age (0.9; 95% CI = 0.0, 1.8) but lower than the increments associated with being overweight (4.1; 95% CI = 3.4, 4.9). Similarly, Figure 1 ▶ shows that the effect of exposure to job strain on blood pressure increases in the highest quintile of men (1.33; 95% CI = 1.01, 1.76) tended to be similar to that of sedentary behavior (RR = 1.13; 95% CI = 0.96, 1.33) or being 10 years older (RR = 1.29; 95% CI = 1.05, 1.58) and smaller than that of being overweight (1.69; 95% CI = 1.44, 1.97). Among women, the effect of job strain on blood pressure was smaller than that of these known blood pressure risk factors (data not shown).
FIGURE 1—
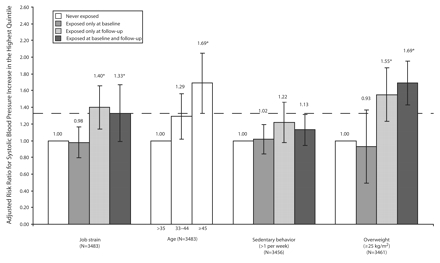
Adjusted risk ratios for systolic blood pressure increases in the highest quintile according to job strain and known high blood pressure risk factors among men in Quebec City, 1991–2003.
Note. The models included the following covariates: age, body mass index, social support at work, living with a child, number of years working for the organization, and baseline systolic blood pressure value. Known high blood pressure risk factors were also controlled for job strain. *P < .05 compared with > 35 years of age and never exposed.
DISCUSSION
In this study of white-collar workers, cumulative exposure to job strain led to significant increases in systolic blood pressure among men. Men who became exposed during follow-up showed similar increases. Effects tended to be more pronounced among men and women with low levels of social support at work.
Four prospective studies, all involving normotensive workers, have evaluated the effects of cumulative job strain on blood pressure. Fauvel et al.36 found no difference in 5-year follow-up systolic or diastolic ambulatory blood pressure, unadjusted for baseline blood pressure, between workers with cumulative exposure to job strain and those with no exposure. This study was limited by its small sample size (n = 158) and the fact that only 54% of the participants were evaluated at follow-up. Thus, it is likely that the study lacked the necessary power to detect effects of job strain on blood pressure.
Chapman et al.35 showed no effects of cumulative job strain on casual blood pressure over 5 years among 2634 workers. This difference could have resulted from the use of proxies of Karasek’s questions, different measurements of cumulative job strain, use of casual blood pressure measurements, and the fact that only 40% of the target population was represented. Markovitz et al.38 reported that changes in psychological demands/decision latitude ratios had an effect on casual systolic blood pressure. However, no effect of cumulative job strain on hypertension incidence was found, possibly as a result of the minor overall incidence of hypertension in the sample (2.75%), the measurement of casual blood pressure, and the young study population (18 to 30 years at baseline).38
Finally, Schnall et al.29 reported a significant effect of cumulative job strain on increased ambulatory blood pressure over 3 years among 195 men. An additional assessment of job strain exposure made before participants entered the study revealed that ambulatory systolic blood pressure levels were 5 to 8 mm Hg higher among men who had been employed for 25 years or more and had been exposed to job strain for 50% of their working lives than among men without past exposure.37 The larger increases observed by Schnall et al. may have been because of their use of ambulatory blood pressure measurements. Thus, the effects observed in previous longitudinal studies were most consistent with respect to systolic blood pressure, as were the effects observed in previous cross-sectional studies.58
In our study, the systolic blood pressure increases found among men were modest but generally statistically significant, as were the risk ratios for large blood pressure increases. These effects were similar in magnitude to those associated with sedentary behavior and age, known blood pressure risk factors. In addition, similar effects—a blood pressure increment of 2.4 mm Hg (95% CI = −2.2, 7.1) and a risk ratio of 1.48 (95% CI = 0.74, 2.95)—were observed among the 830 men with higher baseline blood pressure levels (130 or above; mean = 138/83 mm Hg, SD = 7/10 mm Hg). Larger increases might presumably be found over individuals’ entire working life and may be associated with long-term risk of cardiovascular disease, consistent with the greater effect of life course exposure to job strain on blood pressure (5–8 mm Hg) found by Landsbergis et al.37
In addition, previous studies have shown that preventive population-based approaches to reducing systolic blood pressure by 2 mm Hg are likely to decrease risks of coronary heart disease and stroke by 7% and 10%, respectively.59,60 Such minor changes in blood pressure may thus prevent large numbers of premature deaths and disabling strokes.59 Finally, there is no threshold (at least down to 115/75) below which decreasing blood pressure is not beneficial.61 Several studies suggest that psychosocial factors (chronic, episodic, or acute) may influence the patho-physiological mechanisms of blood pressure increases, including activation of the autonomic nervous system and increased cardiac output.62,63 The effect of cumulative stressors on blood pressure may be because of the cumulative effect of multiple exposures of varying duration.64
The larger effects of job strain found among workers with low levels of social support at the workplace are consistent with the iso-strain model (according to which job strain is an adverse psychosocial factor particularly in the case of those with low levels of social support at the workplace).15,18,19 Furthermore, the significant interaction supports the hypothesis that reduced levels of social support enhance the effects of job strain on blood pressure. Here the overall pattern of effects tended to be similar among men and women, although magnitudes were lower among women. As was the case with men, a larger job strain effect was observed among women with low levels of social support at work. Less intense exposure because of different occupational trajectories or gender-based pathophysiological mechanisms65 could explain these reduced effects among women.
We found that men of high socioeconomic status showed effects of job strain on blood pressure that were similar to those exhibited by men of low socioeconomic status (data not shown). This result is inconsistent with that of Landsbergis et al.,66 who observed effects only among men of low socioeconomic status. The wider occupational status range included in the Landsbergis et al. study may explain this difference. The hypothesis that decision latitude alone is associated with higher blood pressure levels67 was not supported by this study. The effects of cumulative low decision latitude on blood pressure were weaker than those of cumulative job strain (data not shown). Furthermore, adjustment for cumulative decision latitude did not lower the effect of cumulative job strain on blood pressure (data not shown).
We used another cutoff in the job strain definition (tertiles) and a continuous method (ratio of scales) to verify whether other formulations would have involved lower misclassification rates.19 We obtained inconsistent effects using tertiles but consistent effects using the continuous method (data not shown), probably reflecting the added complexity of alternate formulations in attempts to classify exposure at 2 time points. Thus, we selected the quadrant method.58 Baseline exposure and the 5-item psychological demand scale46 generated consistent results (data not shown). Although this finding supports our measure, it does not rule out a nondifferential misclassification bias that probably generated an underestimation of the true effect.68,69
Our study involved some limitations. Blood pressure measures were based on a limited number of determinations, as is true of most large epidemiological studies. Risk ratios based on a single measurement are underestimates because of regression dilution bias.4 Thus, risk ratios for blood pressure increases would probably have been higher had the study involved multiple measurements, namely measurements involving ambulatory devices. Also, the study population was composed of white-collar workers, and thus, the results may not generalize to other populations. However, exposure variability values (mean = 23.1, SD = 3.5, for psychological demands and mean = 70.3, SD = 10.7, for decision latitude; percentage exposed: 20.7) were similar to those of the general working population (mean = 23.9, SD = 3.8, for psychological demands and mean = 72.7, SD = 11.8, for decision latitude; percentage exposed: 21.9),50 supporting internal validity.
Other limitations included misclassification of exposure owing to dichotomized psychological demand and decision latitude scales, inclusion of intermediate exposures (active and passive)70 for the unexposed group, and repetition of exposure misclassification at 2 time points in the cumulative assessment. Another source of nondifferential information bias could have led to an underestimation of the true effect; that is, classifying exposure according to 2 time points does not take into account the fact that workers may have temporarily changed in terms of exposure between these 2 points. No information was available on job strain stability over the 7-year period.
This study also had many strengths, including being the longest and largest prospective cohort investigation, to our knowledge, to evaluate the effects of job strain on blood pressure. It enabled assessment of the effects of cumulative exposure, and the cohort involved a large proportion of women. Moreover, participation and tracking rates were high, limiting the possibility of selection bias.69 The comparison between workers included and excluded from the analyses revealed similarities with respect to exposure and outcome variables, further minimizing the possibility of selection bias.68 Residual confounding was improbable given that a large number of factors, including behavioral factors, and changes in these factors over follow-up were controlled for in the analyses.
Missing values were imputed for workers with missing data on 2 or fewer items on a given scale. Reanalyses of the data excluding these workers generated results similar to those described here (data not shown). Adjustment for baseline blood pressure ruled out potential effects of baseline differences in blood pressure between exposure subgroups.55 Only preplanned comparisons were tested, limiting the potential impact of multiple comparisons. Finally, robustness was supported by similar results (data not shown) obtained in reanalyses that (1) included workers treated for hypertension detected at baseline, (2) excluded workers with cardiovascular disease at follow-up, and (3) excluded workers unemployed or retired at follow-up.
We found that cumulative exposure to job strain resulted in significant increases in systolic blood pressure among male white-collar workers, especially those with low levels of social support at work. Similar blood pressure effects were found among workers who became exposed during follow-up. Effect magnitudes were similar to those observed for age and sedentary behavior. Among women, the pattern of effects tended to be similar, although magnitudes were smaller. These results suggest that primary interventions aimed at reducing job strain may have significant effects on blood pressure.
Acknowledgments
Funding for this work was provided by the Canadian Institutes of Health Research (CIHR) and the Heart and Stroke Foundation of Québec. Chantal Guimont was the recipient of a research award from CIHR. C. Brisson was a CIHR Investigator.
We would like to thank the organizations that participated in the study. We also thank Brigitte Larocque, who made helpful contributions to the article.
Human Participant Protection This study was approved by the ethical review board of the Centre hospitalier affilié universitaire de Québec. Participants provided written informed consent.
Peer Reviewed
Contributors C. Guimont assisted with the study, supervised and synthesized the data analyses, and led the writing. C. Brisson originated and supervised all aspects of the study. G. R. Dagenais and A. Milot supervised the aspects of the study related to blood pressure measurement and interpretation. M. Vézina supervised the public health issues of the study. B. Mâsse supervised data analyses. C. Blanchette conducted all data analyses. C. Brisson, G. R. Dagenais, A. Milot, M. Vézina, B. Mâsse, J. Moisan, and N. Laflamme collaborated in the conception of the study and the supervision of data collection. All authors participated in reviewing and drafting the article.
References
- 1.Kannel WB. Risk factors in hypertension. J Cardiovasc Pharmacol. 1989;13(suppl 1):S4–S10. [DOI] [PubMed] [Google Scholar]
- 2.Pickering TG. Short-term variability of blood pressure, and the effects of physical and mental activity. In: Ambulatory Monitoring and Blood Pressure Variability. London, England: Science Press Ltd; 1990.
- 3.Kaplan NM. Clinical Hypertension. 5th ed. Balti-more, Md: Williams & Wilkins; 1990.
- 4.MacMahon S, Peto R, Cutler J, et al. Blood pressure, stroke, and coronary heart disease, part 1. Prolonged differences in blood pressure: prospective observational studies corrected for the regression dilution bias. Lancet. 1990;335:765–774. [DOI] [PubMed] [Google Scholar]
- 5.Whelton SP, Chin A, Xin X, He J. Effect of aerobic exercise on blood pressure: a meta-analysis of randomized, controlled trials. Ann Intern Med. 2002;136: 493–503. [DOI] [PubMed] [Google Scholar]
- 6.Appel LJ. Lifestyle modification as a means to prevent and treat high blood pressure. J Am Soc Nephrol. 2003;14(suppl 2):S99–S102. [DOI] [PubMed] [Google Scholar]
- 7.Norman JE, Bild D, Lewis CE, Liu K, West DS. The impact of weight change on cardiovascular disease risk factors in young black and white adults: the CARDIA study. Int J Obes Relat Metab Disord. 2003; 27:369–376. [DOI] [PubMed] [Google Scholar]
- 8.Campbell NR, Burgess E, Taylor G, et al. Lifestyle changes to prevent and control hypertension: do they work? A summary of the Canadian consensus conference. Can Med Assoc J. 1999;160:1341–1343. [PMC free article] [PubMed] [Google Scholar]
- 9.Hennekens CH. Lessons from hypertension trials. Am J Med. 1998;104:50–53. [DOI] [PubMed] [Google Scholar]
- 10.Sacks FM, Svetkey LP, Vollmer WM, et al. Effects on blood pressure of reduced dietary sodium and the Dietary Approaches to Stop Hypertension (DASH) diet. N Engl J Med. 2001;344:3–10. [DOI] [PubMed] [Google Scholar]
- 11.Midgley JP, Matthew AG, Greenwood CM, Logan AG. Effect of reduced dietary sodium on blood pressure: a meta-analysis of randomized controlled trials. JAMA. 1996;275:1590–1597. [DOI] [PubMed] [Google Scholar]
- 12.Markovitz JH, Matthews KA, Kannel WB, Cobb JL, D’Agostino RB. Psychological predictors of hypertension in the Framingham Study: is there tension in hypertension? JAMA. 1993;270:2439–2443. [PubMed] [Google Scholar]
- 13.Spicer J, Chamberlain K. Cynical hostility, anger, and resting blood pressure. J Psychosom Res. 1996;40: 359–368. [DOI] [PubMed] [Google Scholar]
- 14.Yan LL, Liu K, Matthews KA, Daviglus ML, Furguson TF, Kiefe CI. Psychosocial factors and risk of hypertension: the Coronary Artery Risk Development in Young Adults (CARDIA) study. JAMA. 2003;290: 2138–2148. [DOI] [PubMed] [Google Scholar]
- 15.Schnall P, Belkic K, Landsbergis P, Baker D. Why the workplace and cardiovascular disease? In: Schnall PL, Belkic K, Landsbergis P, Baker D, eds. Occupational Medicine: State of the Art Reviews. Philadelphia, Pa: Hanley & Belfus Inc; 2000:1–6. [PubMed]
- 16.Adams JH, Aubert RE, Clark VR. The relationship among John Henryism, hostility, perceived stress, social support, and blood pressure in African-American college students. Ethn Dis. 1999;9:359–368. [PubMed] [Google Scholar]
- 17.Karasek RA Jr. Job demands, job decision latitude, and mental strain: implications for job redesign. Admin Sci Q. 1979;24:285–308. [Google Scholar]
- 18.Johnson JV. Theoretical developments in psychosocial work environment research. Int J Health Serv. 1989;19:457–458. [DOI] [PubMed] [Google Scholar]
- 19.Landsbergis PA, Schnall PL, Warren K, Pickering TG, Schwartz JE. Association between ambulatory blood pressure and alternative formulations of job strain. Scand J Work Environ Health. 1994;20: 349–363. [DOI] [PubMed] [Google Scholar]
- 20.Melamed S, Ben-Avi I, Luz J, Green MS. Repetitive work, work underload and coronary heart disease risk factors among blue-collar workers—the CORDIS study. J Psychosom Res. 1995;39:19–29. [DOI] [PubMed] [Google Scholar]
- 21.Kawakami N, Haratani T, Araki S. Job strain and arterial blood pressure, serum cholesterol, and smoking as risk factors for coronary heart disease in Japan. Int Arch Occup Environ Health. 1998;71:429–432. [DOI] [PubMed] [Google Scholar]
- 22.Pieper C, LaCroix AZ, Karasek RA. The relation of psychosocial dimensions of work with coronary heart disease risk factors: a meta-analysis of five United States data bases. Am J Epidemiol. 1989;129: 483–494. [DOI] [PubMed] [Google Scholar]
- 23.Curtis AB, James SA, Raghunathan TE, Alcser KH. Job strain and blood pressure in African Americans: the Pitt County Study. Am J Public Health. 1997;87: 1297–1302. [DOI] [PMC free article] [PubMed] [Google Scholar]
- 24.Blumenthal JA, Thyrum ET, Siegel WC. Contribution of job strain, job status and marital status to laboratory and ambulatory blood pressure in patients with mild hypertension. J Psychosom Res. 1995;39: 133–144. [DOI] [PubMed] [Google Scholar]
- 25.Cesana G, Ferrario M, Sega R, et al. Job strain and ambulatory blood pressure levels in a population-based employed sample of men from northern Italy. Scand J Work Environ Health. 1996;22:294–305. [DOI] [PubMed] [Google Scholar]
- 26.Harenstam AB, Theorell TP. Work conditions and urinary excretion of catecholamines—a study of prison staff in Sweden. Scand J Work Environ Health. 1988;14: 257–264. [DOI] [PubMed] [Google Scholar]
- 27.Light KC, Turner JR, Hinderliter AL. Job strain and ambulatory work blood pressure in healthy young men and women. Hypertension. 1992;20:214–218. [DOI] [PubMed] [Google Scholar]
- 28.Schnall PL, Schwartz JE, Landsbergis PA, Warren K, Pickering TG. Relation between job strain, alcohol, and ambulatory blood pressure. Hypertension. 1992;19: 488–494. [DOI] [PubMed] [Google Scholar]
- 29.Schnall PL, Schwartz JE, Landsbergis PA, Warren K, Pickering TG. A longitudinal study of job strain and ambulatory blood pressure: results from a three-year follow-up. Psychosom Med. 1998;60:697–706. [DOI] [PubMed] [Google Scholar]
- 30.Steptoe A, Roy MP, Evans O, Snashall D. Cardiovascular stress reactivity and job strain as determinants of ambulatory blood pressure at work. J Hypertens. 1995;13:201–210. [PubMed] [Google Scholar]
- 31.Theorell T, de Faire U, Johnson J, Hall E, Perski A, Stewart W. Job strain and ambulatory blood pressure profiles. Scand J Work Environ Health. 1991;17: 380–385. [DOI] [PubMed] [Google Scholar]
- 32.Van Egeren LF. The relationship between job strain and blood pressure at work, at home, and during sleep. Psychosom Med. 1992;54:337–343. [DOI] [PubMed] [Google Scholar]
- 33.Laflamme N, Brisson C, Moisan J, Milot A, Mâsse B, Vézina M. Job strain and ambulatory blood pressure among female white-collar workers. Scand J Work Environ Health. 1998;24:334–343. [DOI] [PubMed] [Google Scholar]
- 34.Checkoway H, Pearce NE, Crawford-Brown DJ. Research Methods in Occupational Epidemiology. New York, NY: Oxford University Press Inc; 1989.
- 35.Chapman A, Mandryk JA, Frommer MS, Edye BV, Ferguson DA. Chronic perceived work stress and blood pressure among Australian government employees. Scand J Work Environ Health. 1990;16:258–269. [DOI] [PubMed] [Google Scholar]
- 36.Fauvel JP, M’Pio I, Quelin P, Rigaud JP, Laville M, Ducher M. Neither perceived job stress nor individual cardiovascular reactivity predict high blood pressure. Hypertension. 2003;42:1112–1116. [DOI] [PubMed] [Google Scholar]
- 37.Landsbergis PA, Schnall PL, Pickering TG, Warren K, Schwartz JE. Life-course exposure to job strain and ambulatory blood pressure in men. Am J Epidemiol. 2003; 157:998–1006. [DOI] [PubMed] [Google Scholar]
- 38.Markovitz JH, Matthews KA, Whooley M, Lewis CE, Greenlund KJ. Increases in job strain are associated with incident hypertension in the CARDIA study. Ann Behav Med. 2004;28:4–9. [DOI] [PubMed] [Google Scholar]
- 39.Collins Cobuild English Dictionary. London, England: HarperCollins; 1998.
- 40.Brisson C, Larocque B, Moisan J, Vézina M, Dagenais GR. Psychological factors at work, smoking, sedentary behavior, and body mass index: a prevalence study among 6995 white collar workers. J Occup Environ Med. 2000;42:40–46. [DOI] [PubMed] [Google Scholar]
- 41.Frohlich ED, Grim C, Labarthe DR, et al. Recommendations for blood pressure determination by sphygmomanometers. Hypertension. 1988;11:209A–222A.3280480 [Google Scholar]
- 42.Et la santé, ça va? Quebec, Quebec, Canada: Rapport de l’enquête Santé Québec; 1987.
- 43.Karasek R. Job Content Questionnaire and User’s Guide: Department of Industrial and Systems Engineering. Los Angeles, Calif: University of Southern California; 1985.
- 44.Karasek RA. Lower health risk with increased job control among white collar workers. J Organizational Behav. 1990;11:171–185. [Google Scholar]
- 45.Karasek RA, Schwartz J, Pieper C. Validation of a Survey Instrument for Job-Related Cardiovascular Illness. New York, NY: Department of Industrial Engineering and Operations Research, Columbia University; 1983.
- 46.Karasek R, Brisson C, Kawakami N, Houtman I, Bongers P, Amick B. The Job Content Questionnaire ( JCQ): an instrument for internationally comparative assessments of psychosocial job characteristics. J Occup Health Psychol. 1998;3:322–355. [DOI] [PubMed] [Google Scholar]
- 47.Brisson C, Dion G, Moisan J, et al. Reliability and construct validity of the psychological demand and decision latitude scales of the Karasek Job Content Questionnaire. Work Stress. 1998;12:322–336. [Google Scholar]
- 48.Larocque B, Brisson C, Blanchette C. Cohérence interne, validité factorielle et validité discriminante de la traduction française des échelles de demande psychologique et de latitude décisionnelle du “Job Content Questionnaire” de Karasek. Rev Epidemiol Sante Publique. 1998;46:371–381. [PubMed] [Google Scholar]
- 49.Santé Québec. Et votre coeur, ça va? Rapport de l’enquête québécoise sur la santé cardiovasculaire. Quebec, Quebec, Canada: Gouvernement du Québec; 1994.
- 50.Daveluy C, Pica L, Audet N, et al. Enquête sociale et de santé 1998. 2nd ed. Quebec, Quebec, Canada: Institut de la statistique du Québec; 2000.
- 51.Willett WC, Dietz WH, Colditz GA. Guidelines for healthy weight. N Engl J Med. 1999;341:427–434. [DOI] [PubMed] [Google Scholar]
- 52.Barefoot JC, Dodge KA, Peterson BL, Dahlstrom WG, Williams RB Jr. The Cook-Medley hostility scale: item content and ability to predict survival. Psychosom Med. 1989;51:46–57. [DOI] [PubMed] [Google Scholar]
- 53.Haynes SG, Levine S, Scotch N, Feinleib M, Kannel WB. The relationship of psychosocial factors to coronary heart disease in the Framingham study: I. Methods and risk factors. Am J Epidemiol. 1978;107: 362–363. [DOI] [PubMed] [Google Scholar]
- 54.Belkic KL, Landsbergis PA, Schnall PL, Baker D. Is job strain a major source of cardiovascular disease risk? Scand J Work Environ Health. 2004;30:85–128. [DOI] [PubMed] [Google Scholar]
- 55.Bonate P. Analysis of Pretest-Posttest Designs. London, England: Chapman & Hall; 2000.
- 56.Skov T, Deddens J, Petersen MR, Endahl L. Prevalence proportion ratios: estimation and hypothesis testing. Int J Epidemiol. 1998;27:91–95. [DOI] [PubMed] [Google Scholar]
- 57.SAS System for Sun OS. Cary, NC: SAS Institute Inc; 2000.
- 58.Belkic K, Landsbergis P, Schnall P, et al. Psychosocial factors: review of the empirical data among men. In: Schnall PL, Belkic K, Landsbergis P, Baker D, eds. Occupational Medicine: State of the Art Reviews. Philadelphia, Pa: Hanley & Belfus Inc; 2000:24–46.
- 59.Lewington S, Clarke R, Qizilbash N, Peto R, Collins R. Age-specific relevance of usual blood pressure to vascular mortality: a meta-analysis of individual data for one million adults in 61 prospective studies. Lancet. 2002;360:1903–1913. [DOI] [PubMed] [Google Scholar]
- 60.Whelton PK, He J, Appel LJ, et al. Primary prevention of hypertension: clinical and public health advisory from the National High Blood Pressure Education Program. JAMA. 2002;288:1882–1888. [DOI] [PubMed] [Google Scholar]
- 61.Sleight P, Yusuf S. New evidence on the importance of the renin-angiotensin system in the treatment of higher-risk patients with hypertension. J Hypertens. 2003;21:1599–1608. [DOI] [PubMed] [Google Scholar]
- 62.Kop WJ. Chronic and acute psychological risk factors for clinical manifestations of coronary artery disease. Psychosom Med. 1999;61:476–487. [DOI] [PubMed] [Google Scholar]
- 63.Peters M, Godaert G, Ballieux R, et al. Cardiovascular and endocrine responses to experimental stress: effects of mental effort and controllability. Psychoneuroendocrinology. 1998;23:1–17. [DOI] [PubMed] [Google Scholar]
- 64.Pickering TG. The effects of environmental and lifestyle factors on blood pressure and the intermediary role of the sympathetic nervous system. J Hum Hypertens. 1997;11(suppl 1):S9–S18. [PubMed] [Google Scholar]
- 65.Douglas P. Coronary artery disease in women. In: Braunwald E, Zipes D, Libby P, eds. Heart Disease: A Textbook of Cardiovascular Medicine. Philadelphia, Pa: WB Saunders Co; 2001:2038–2051.
- 66.Landsbergis PA, Schnall PL, Pickering TG, Warren K, Schwartz JE. Lower socioeconomic status among men in relation to the association between job strain and blood pressure. Scand J Work Environ Health. 2003;29:206–215. [DOI] [PubMed] [Google Scholar]
- 67.Bosma H, Marmot MG, Hemmingway H, Nichol-son AC, Brunner E, Stansfeld SA. Low job control and risk of coronary heart disease in Whitehall II (prospective cohort) study. BMJ. 1997;314:558–565. [DOI] [PMC free article] [PubMed] [Google Scholar]
- 68.Checkoway H, Pearce N, Kriebel D. Research Methods in Occupational Epidemiology. 2nd ed. New York, NY: Oxford University Press Inc; 2004.
- 69.Rothman KJ, Greenland S. Modern Epidemiology. Philadelphia, Pa: Lippincott-Raven Publishers; 1998.
- 70.Karasek RA, Theorell T. Healthy Work: Stress, Productivity and the Reconstruction of Working Life. New York, NY: Basic Books; 1990.